Kinase Conformation Resource
News - February 13, 2026.
Active structure criteria updated in 2026. The new criteria distinguish substrate-binding
capability at the C-terminal segment of the activation loop, compared to the 2023 criteria (described in
the 2023 biorxiv preprint). With these new criteria, we have produced AlphaFold2 active structures of
all 437 catalytically active human kinases (i.e., excluding pseudokinases)
Biorxiv preprint (2023),
to be updated shortly with new criteria for active structures based on analysis of 54
unique substrate-bound kinase structures
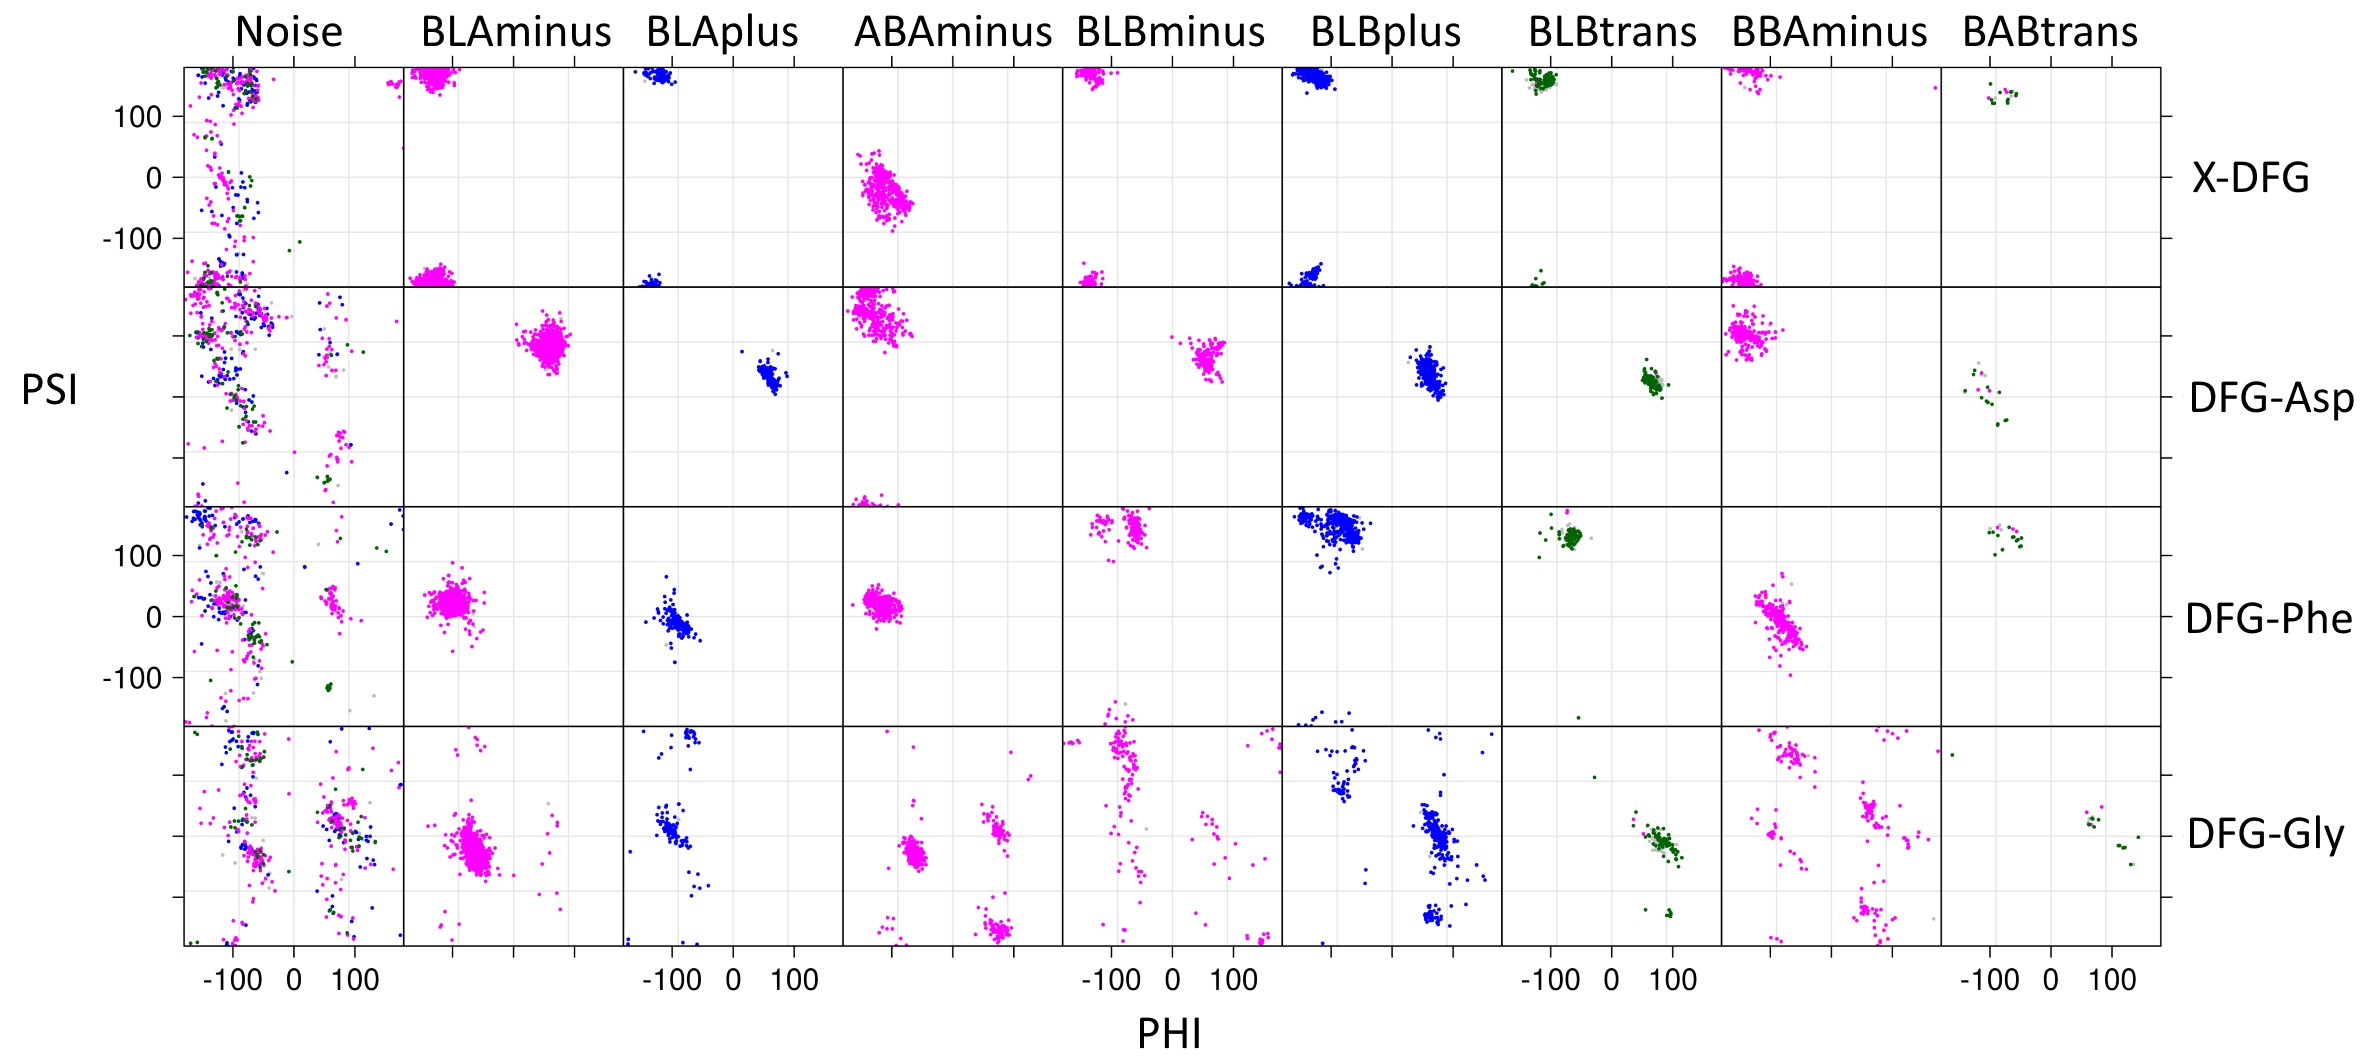
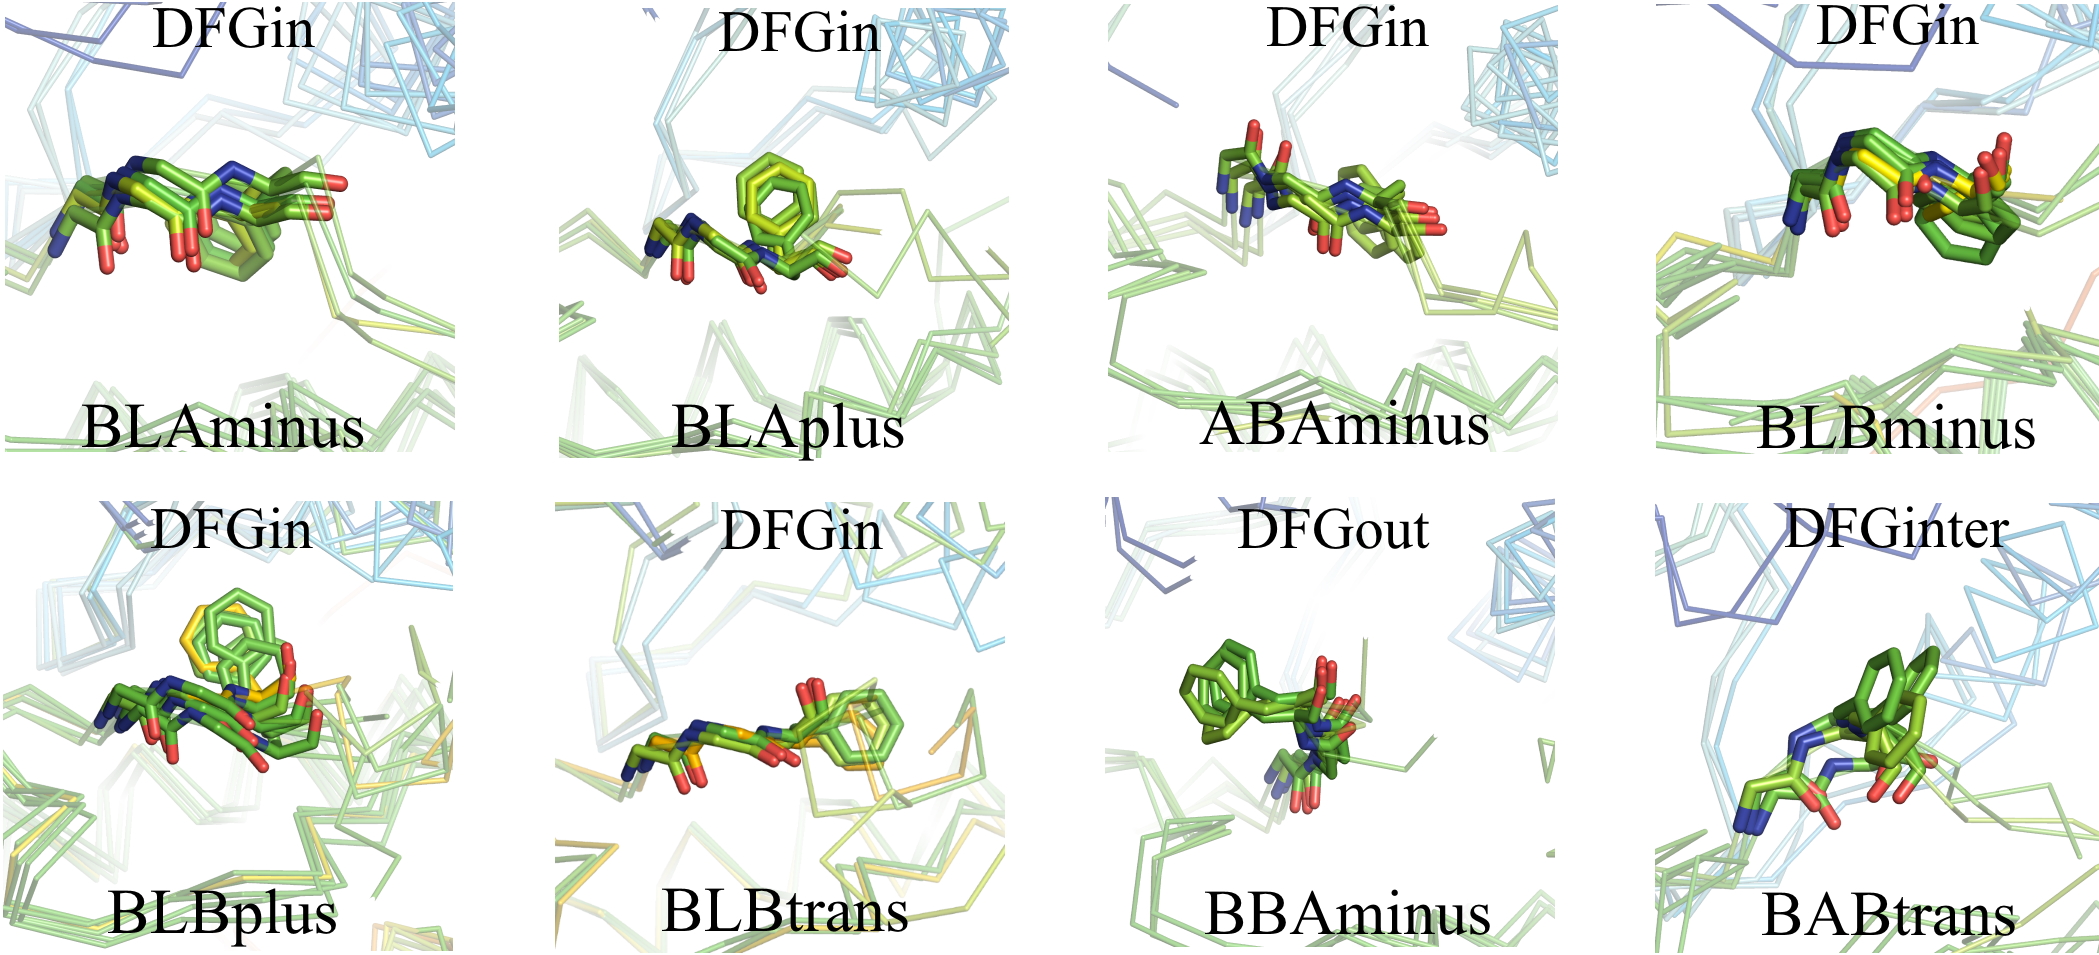
All structures have an ‘Activity’ label based on six criteria: DFGin, BLAminus, the N-terminal domain salt bridge, the HRD motif conformation, and the positions of the N and C terminal segments of the activation loop. Labels corresponding to these criteria are listed in the columns headed by ‘Spatial label,’ ‘Dihedral label,’ ‘Chelix-Saltbridge label,’, ‘HRD label’ and ‘ActLoop label’ presented on every page. Structures must be DFGin, BLAminus, HRD-in, and Saltbr-in to be considered "Active". If atoms are missing, then the structure is considered Inactive. In addition, the ActLoop-NT and ActLoop-CT labels are used to determine if the structure can bind substrates. If residues are missing, then the kinase activity label is "None". If any of these criteria are "out", then the structure is labeled Inactive. Details will be presented in the updated preprint (forthcoming)
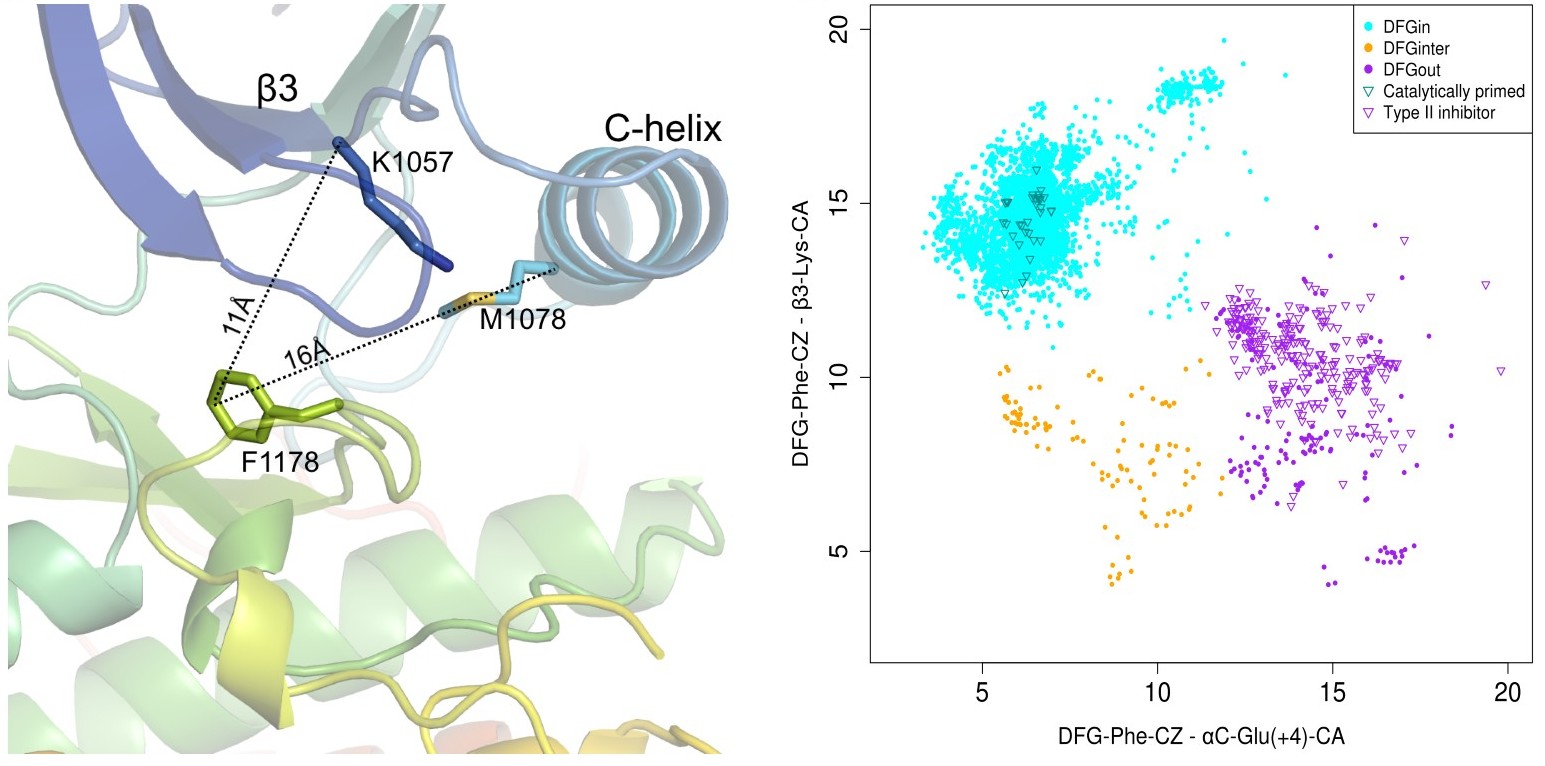
The Chelix-Saltbridge label is composed of two components: (1) The Chelix is labeled ‘in’ or ‘out’ (or ‘none’ if residues are missing), based on the distance of the Cbeta atoms of the Lys and Glu of the N-terminal domain (≤10 Å means ‘in’, >10 Å means ‘out’). (2) The saltbridge is ‘in’ if the shorter of the NZ-OE1 and NZ-OE2 distances is ≤3.6 Å, and otherwise is ‘out’. (‘none’ if atoms are missing).
The HRD label is ‘in’ is based on the backbone dihedral angles of the His and Arg residues, which must be in the alpha and L regions of the Ramachandran map, respectively.
The ActLoopNT label is ‘in’ if the there is a hydrogen bond (≤3.6 Å) between the N or O atoms of the sixth residue of the activation loop (DFGxxX) and the O or N atoms of the residue before the HRD motif (Xhrd). Otherwise it is ‘out’ (or ‘none’ if the atoms are missing). This criterion ensures that the N-terminal segment of the activation loop is extended along the surface of the kinase so that substrate can bind properly.
The ActLoopCT label is ‘in’ if the structure conforms to a set of dihedral angle constraints and distance constraints on the C-terminal residues of the activation loop. Since TYR kinases bind substrates differently than other kinases, the requirements differ between TYR kinases and nonTYR kinases. The criteria are listed on the "advanced" page for each search result.
For nonTYR kinases, there are dihedral angle requirements on the backbone of residues APE6, APE7, and APE8 (counting backwards from the end of the activation loop: e.g., APE6 is XxxAPE). APE7-APE6 have to be in the A,A regions of the Ramachandran map or in the B,L regions, where:
APE8 has to be in the B region of the Ramachandran map. The side-chain rotamer of APE8, when this residue is Ser or Thr, should be gauche-minus (χ1 ∈ (-120°, 0°)). The rotamer requirement is utilized to confirm a hydrogen bond between the side-chain of APE8 and the side-chain of the HRD aspartic acid. There are further distance requirements:
For TYR kinases, there are dihedral angle requirements on the backbone of residues APE6, APE7, APE8, APE9, and APE10. The requirements on APE6-APE7 ensure an alpha-helical formation, while those on APE8-APE10 ensure a beta-strand formation with substrates. There is also a distance constraint between APE9 Cα and the carbonyl oxygen of the HRD residue.
The ActLoop label is a composite of these two labels.
In the Pymol sessions and coordinates, the Activity label follows the kinase+species name. The Saltbridge and ActLoop NT+CT criteria are contained in a string consisting of ‘SNC’ followed by one-letter states (‘i’ for ‘in’; ‘o’ for ‘out’; ‘n’ for ‘none’). For example, ‘SNCiio’ means the Saltbridge is ‘in’, the ActLoopNT segment is ‘in’;, and the ActLoopCT segment is ‘out’;. This is followed by the APEdihe and APEdist labels. APEdihe covers the dihedral angles of APE10-APE9-APE8-APE8rot-APE6+7. APEdist consists of the distance labels for residues APE12-APE11-APE10-APE9.
We have added AlphaFold2 models of active forms (given the criteria above) for all 437 catalytically competent human kinases with typical kinase domains (i.e., excluding 57 pseudokinases). These are all accessible through the search page for family, gene, etc. Each AlphaFold2 model is labeled with the form ‘AF-P12345-K1’, where ‘P12345’ is the Uniprot code, and ‘K1’ means the first Kincore model we have included in the database for that kinase. See this page to download all the models and associated data.
Protein kinases (PKs) are enzymes that transfer phosphoryl group from an ATP molecule to Ser, Thr or Tyr residue of the substrate protein. The human genome consists 484 PK genes (497 domains) that are divided broadly into nine families based on their sequences namely, AGC, CAMK, CK1, CMGC, NEK, RGC, STE, TKL, TYR and OTHER (unclassified). They share a conserved structural fold consisting of two lobes: an N-terminal lobe, formed by five stranded β-sheet with an α-helix called the C-helix, and a C-terminal lobe comprising six α-helices. The two lobes are connected by a flexible region in the middle which forms the ATP binding active site of the protein.
The activation loop is typically 20-30 residues in length and is the most critical secondary structural element of the active site of PKs. It is in completely extended conformation in the catalytically active state of the enzyme facilitating the binding of ATP molecule and the substrate. However, it folds on the surface of the protein in different kinds of inactive states. The activation loop begins with a conserved sequence motif called DFGmotif (Asp, Phe, and Gly residues). These residues are observed to be in a unique orientation when the loop is extended (active state) but display remarkable flexibility in folded (inactive) loop conformations.
Typical structure of protein kinase
Multiple orientations of DFG-Phe in EGFR
We have determined the location of DFG-Phe ring in the binding pocket based on its distance from two
conserved residues,
Based on the spatial location of DFG-Phe ring in the binding pocket we have classified kinase structures into three broad groups:
Each spatial group consists of multiple closely related conformations. To cluster these conformations we used the backbone dihedrals (φ,ψ) of X-DFG (residue before conserved Asp), DFG-Asp, DFG-Phe and side chain dihedral (χ1) of DFG-Phe. These dihedrals we used to compute a distance matrix which is then provided as an input to DBSCAN (Density-based spatial clustering of applications with noise), a density-based clustering algorithm. The different clusters observed are labeled on the basis of Ramachandran region (A, B, L, and E) occupied by XDF residue backbone and the DFG-Phe χ1 rotamer (minus = -60°; plus = +60°; trans = 180°).
For the DFGin group we obtained six clusters labeled as BLAminus, BLAplus, ABAminus, BLBminus, BLBplus, and BLBtrans. All the catalytically primed structures (ATP+Mg bound and activation loop phosphorylated) are observed in the BLAminus cluster.
For the DFGout group we obtained just one cluster. In this cluster, the X-D-F residues occupy the B-B-A regions of the Ramachandran map and DFG-Phe is in a -60° rotamer. More than 82% of Type 2 inhibitor bound structures are BBAminus; the remainder are in the DFGout noise group.
The structures in the DFGinter conformation display more variability than the other states. For the DFGinter group we obtained only one small cluster. The X-D-F residues are in a B-A-B conformation and the DFG-Phe residue is observed in a trans rotamer with a few chains displaying a rotamer orientation between g-minus and trans.
A. Pairwise
comparisons of 5 different states of human BRAF
kinase
DFGin-BLBplus structures (“SRC-inactive” conformation in
blue with grayish-blue activation loop) compared with DFGin-BLAminus
(orange, active conformations), BLBminus (magenta-pink), DFGinBLAplus
(“FGFR-inactive”, cyan-lightcyan), and DFGout-BBAminus (Type-2 ligand
binding, lightbrownyellow). A small number of outlier structures in
some classes are not shown. In each case, the position of the
activation loop and the C-helix is correlated with the state of the
kinase, and differs among the 5 states.
B. BLAminus and BLBplus states of EGFR
EGFR BLAminus (107
chains, left, orange) and BLBplus (79 chains, right, blue) structures with both the activation loop
(right side of each image) and C-terminal tail (left side of each image) shown in lighter colors. The C-terminus of each group is shown in magenta spheres. The state of the activation loop is highly correlated with the
position of the C-terminal tail. In the active BLAminus structures, the tail is mostly coil and reaches up
to strands B2 and B3 of the N-terminal domain. In the “SRC-inactive” BLBplus state, the tail contains a
helix (residues 993-1002) in contact with the C-terminal domain, and then turns around with the C-terminus in contact with the I-helix of the C-terminal domain.
C. Results of searches with the Kincore website
ATP-bound BLAminus structures from 14
different kinases in 6 kinase families (left) and BBAminus structures from 29 kinases with bound
Type 2 inhibitors (right).In the
BLAminus structures, the position of the DFG Phe (in yellow) and the conformation of the DFGmotif at
the beginning of the activation loop (shown in magenta) and the overall position of the activation loop
are consistent across the structures.
We have classified PK inhibitors into five groups based on the region of protein they bind to.
A list of FDA approved PK inhibitors with known structures can be accessed here.