Protein Side-chain Conformational Analysis
Table of Contents
- Introduction to the Conformational Analysis of Protein Side Chains
- Conformational Analysis of Backbone-Conformation Independent Interactions
- Graphical Views of the Backbone-Independent Rotamer Library
- Histograms of χ1 Rotamer Populations
- Histograms of χ1,χ2 Rotamer Populations
- Kernel density estimates of χ1 distributions
- Scatterplots of χ angles
- Kernel density estimates of χ2 for each χ1 rotamer type
- Conformational Analysis of Backbone-Conformation Dependent Interactions
- Graphical Views of the Backbone-Dependent Rotamer Library
- Ramachandran plots for each χ1 rotamer
- Box Plots (Ramachandran Maps) of χ1 Rotamer Preferences
- Surface plots of rotamer probabilities
- References
- Histograms of χ1 Rotamer Populations
- Histograms of χ1,χ2 Rotamer Populations
- Kernel density estimates of χ1 distributions
- Scatterplots of χ angles
- Kernel density estimates of χ2 for each χ1 rotamer type
- Ramachandran plots for each χ1 rotamer
- Box Plots (Ramachandran Maps) of χ1 Rotamer Preferences
- Surface plots of rotamer probabilities
Introduction to the Conformational Analysis of Protein Side Chains
This page presents a detailed description of local steric interactions that influence side-chain rotamer and χ angle choice. It includes graphical representations of the backbone-independent and backbone-dependent rotamer libraries annotated to show where local steric interactions affect rotamer populations and χ angle values. Individual figures for each amino acid type are provided in most cases. The images are all clickable for an enlarged view, and can be downloaded by right-clicking on them. They are also all available in this tar file. These figures can be reused and adapted in any format as long as a reference to this page is given (CC-BY 2.0 license).
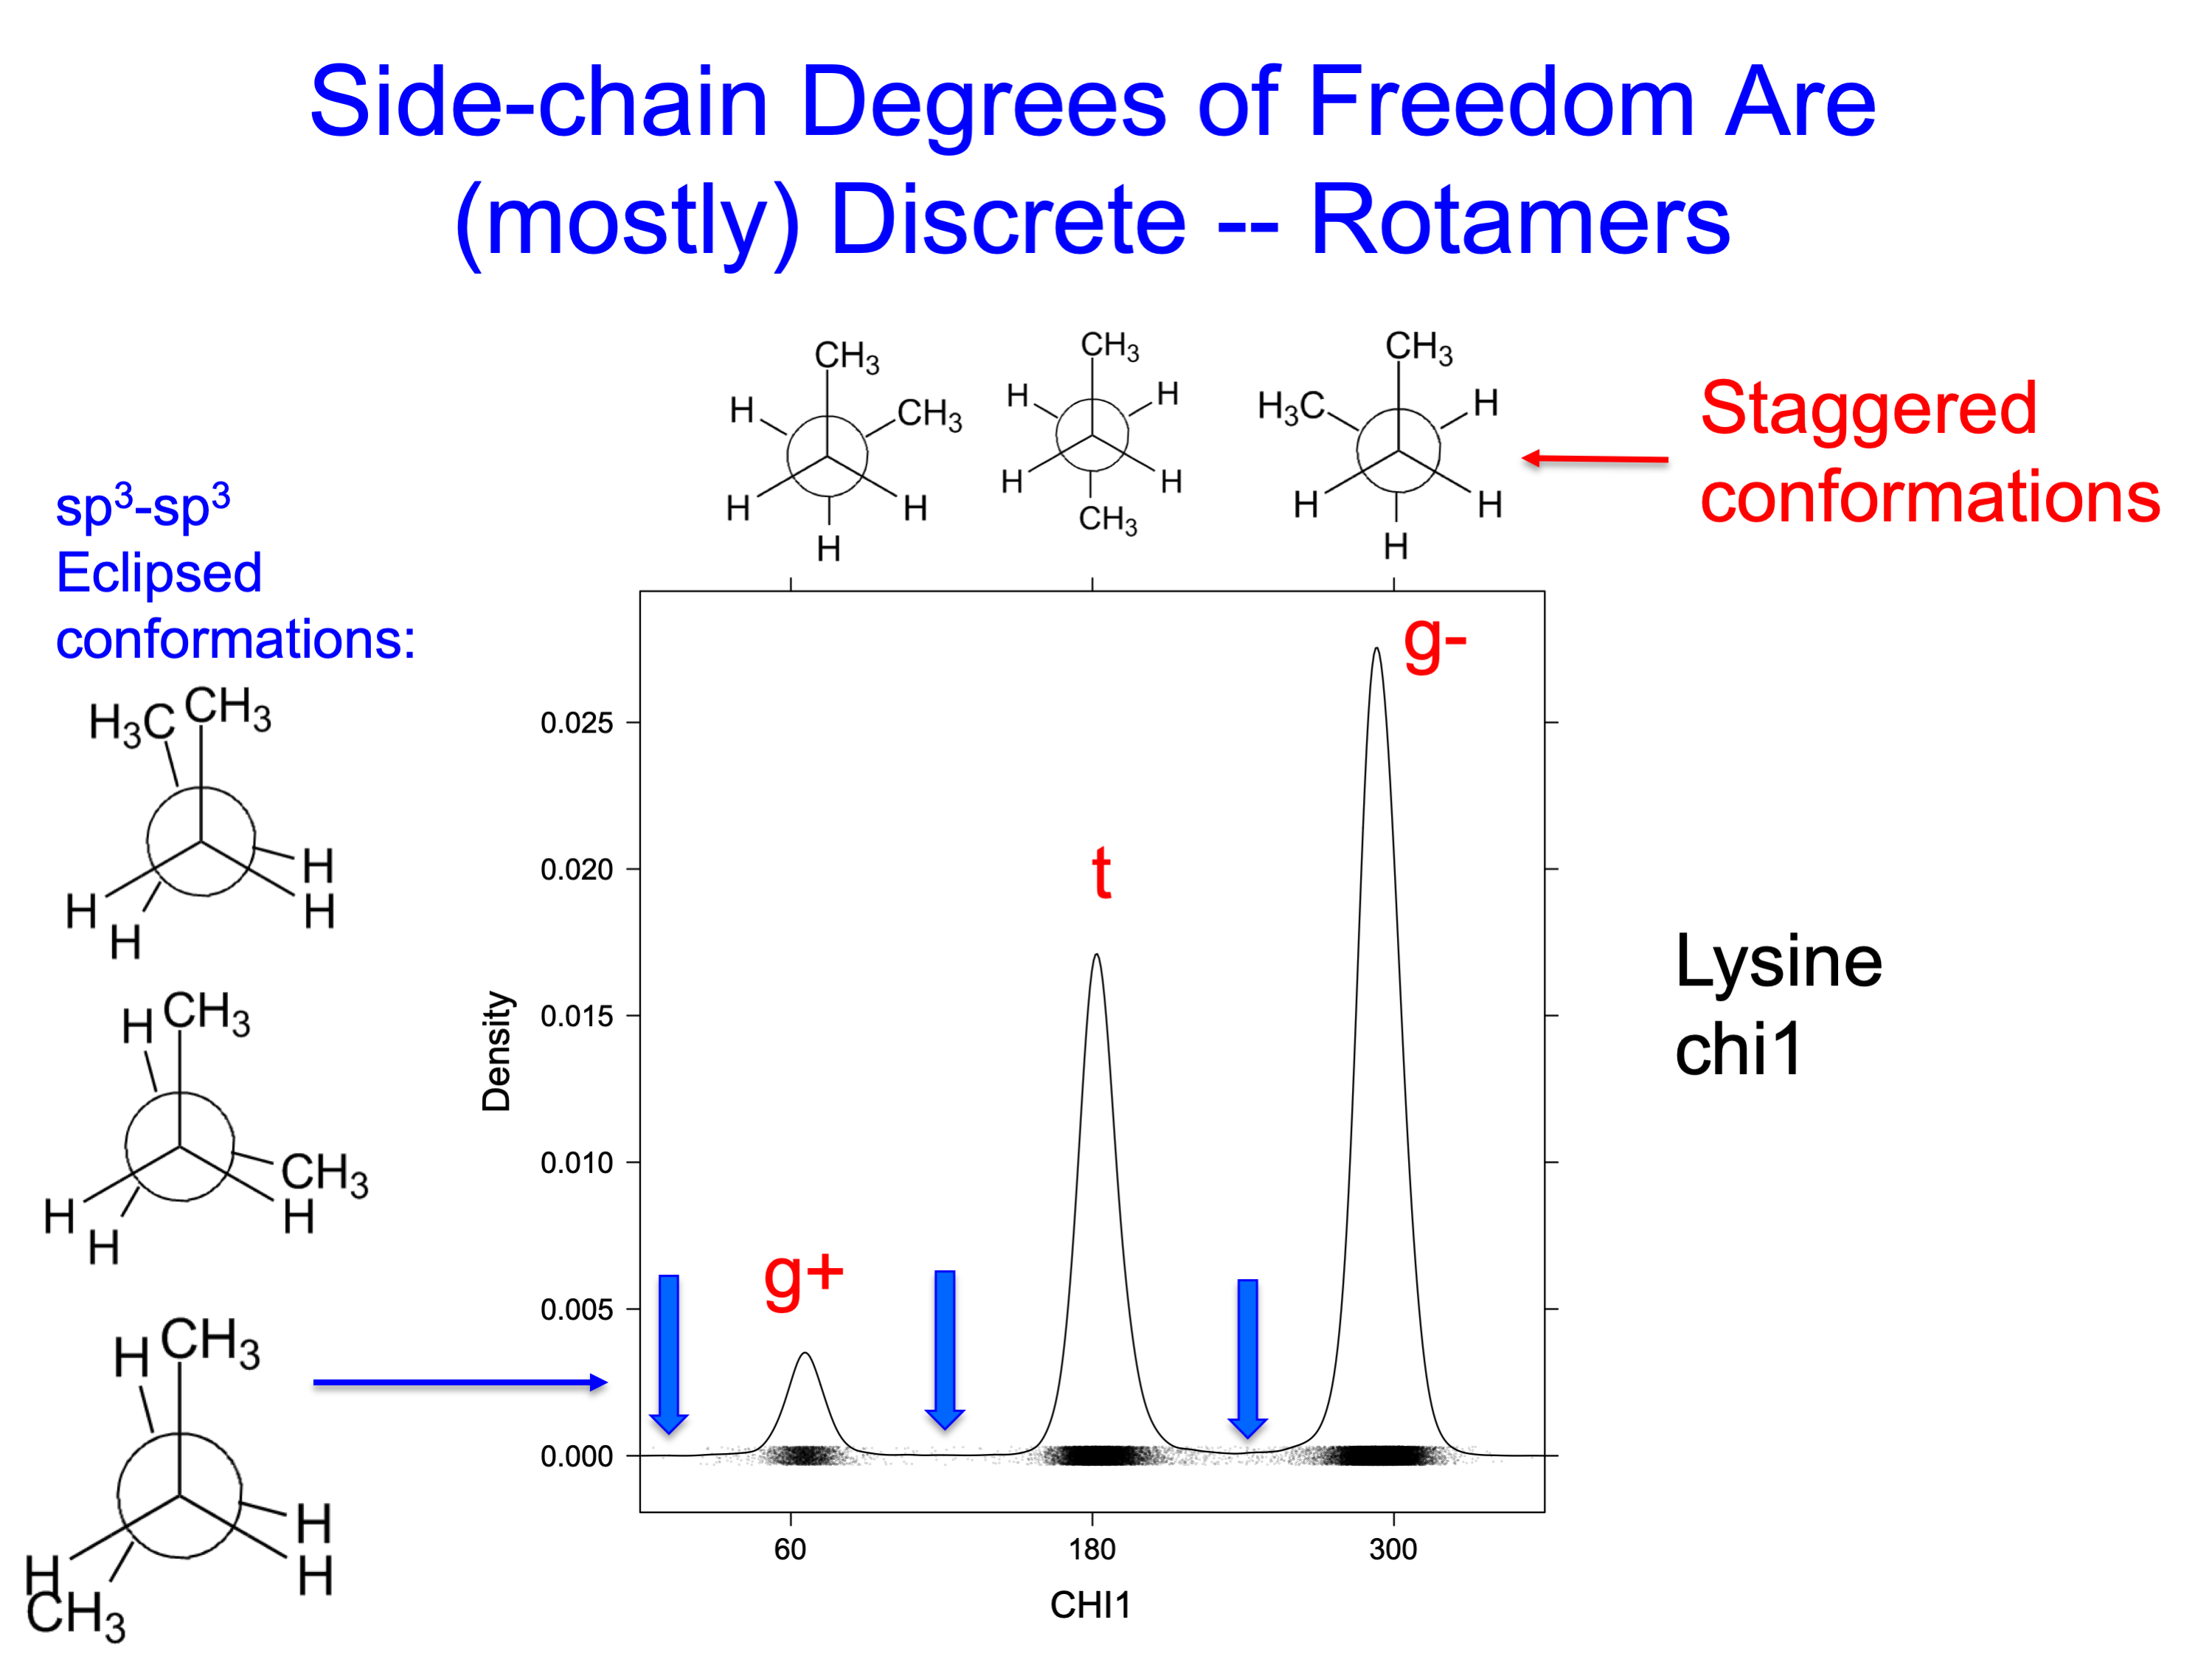
The conformational properties of side-chain dihedral angles depend on whether the central two atoms of the dihedral are sp3 hybridized (like tetrahedral carbons, hydroxyl oxygens, and amine nitrogens, or not. Aromatic carbon and nitrogen atoms as well as the atoms of amides and carboxylates are sp2 hybridized.
As with ethane and butane, the low energy conformations of an sp3-sp3 bonds tend to be staggered (60°, 180°, 300°), rather than eclipsed (0°, 120°, 240°) (see figure below) The gauche conformations of butane, "gauche-plus" or +60° and gauche-minus or -60° (which is the same as 300°), are about 0.9 kcal per mol higher in energy than the trans conformation (180°). At room temperature, each of these conformations would represent about 15% of structures each, while the trans conformation would be 70%.
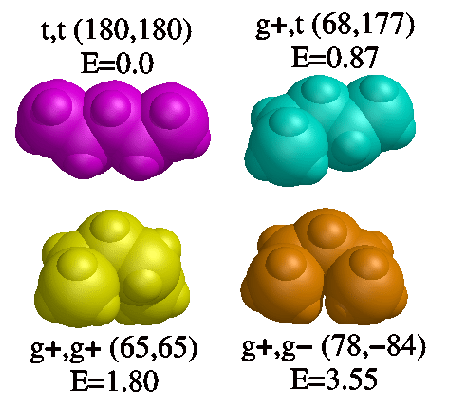
Chains of atoms longer than butane can exhibit steric hindrances that affect the populations of the possible conformations. We can write down the nine possible conformations of pentane, their relative energies (from quantum mechanical calculations), and populations at room temperature:
            t,t                     0.00 kcal/mol        48.9%
            t,g- and g-,t           0.87 kcal/mol        11.5% each
            t,g+ and g+,t           0.87 kcal/mol        11.5% each
            g-,g- and g+,g+         1.80 kcal/mol         2.4% each
            g+,g- and g-,g+         3.55 kcal/mol         0.1% each
Each gauche dihedral is worth about 0.9 kcal/mol. A conformation with two of them of the same sign (g-,g- or g+,g+) have energies of about 1.8 kcal/mol, so the interactions are roughly additive. But when the gauche interactions are of opposite sign, the energy rises to 3.55 kcal/mol. These are called "syn-pentane conformations," which occur when two successive dihedrals in a chain of five atoms are near +60°,-60° or-60°,+60°. In the syn-pentane conformation, the first and fifth atoms are too close together, and there is repulsion between the electrons in the sp3 molecular orbitals.
The figure below shows the four unique structures of local energy minima of pentane. The dihedrals derived from ab initio quantum mechanics calculations are given. In the syn-pentane conformation (g+,g-) the dihedrals are significantly skewed from the values of the other conformers (close to 180° and +60°) in order to lower the steric repulsion.
If we compare the energies of pentane conformations with dihedrals {+X,+X} with those with dihedrals of {+X,-X}, the energies of the opposite sign pair are significantly higher than the same-sign pair when 0° < X < 90° degrees. This is especially important in the backbone conformation dependent analysis below. When we look at {ψ,χ1} and {φ,χ1} pairs of dihedrals we have to look at a range around ψ or φ=+60° or -60° that includes the range 0° to 90° and -90° to 0° respectively.
These interactions occur in any hydrocarbon chain and more generally in any chain of five heavy atoms, and can be used to find conformations of protein side chains with repulsive steric interactions with backbone atoms. These interactions can be backbone-conformation independent (the delta heavy atoms with backbone N or C form a 5 atom chain, e.g. N-CA-CB-CG-CD) or backbone-conformation dependent (e.g. Ci-1-N-CA-CB-CG). The backbone-conformation independent interactions depend on χ1 and χ2. The backbone-conformation dependent interactions depend on φ or ψ and χ1. In the tables below, the various combinations of dihedrals that produce local side-chain/backbone interactions are described.
Backbone-Conformation-Independent Interactions
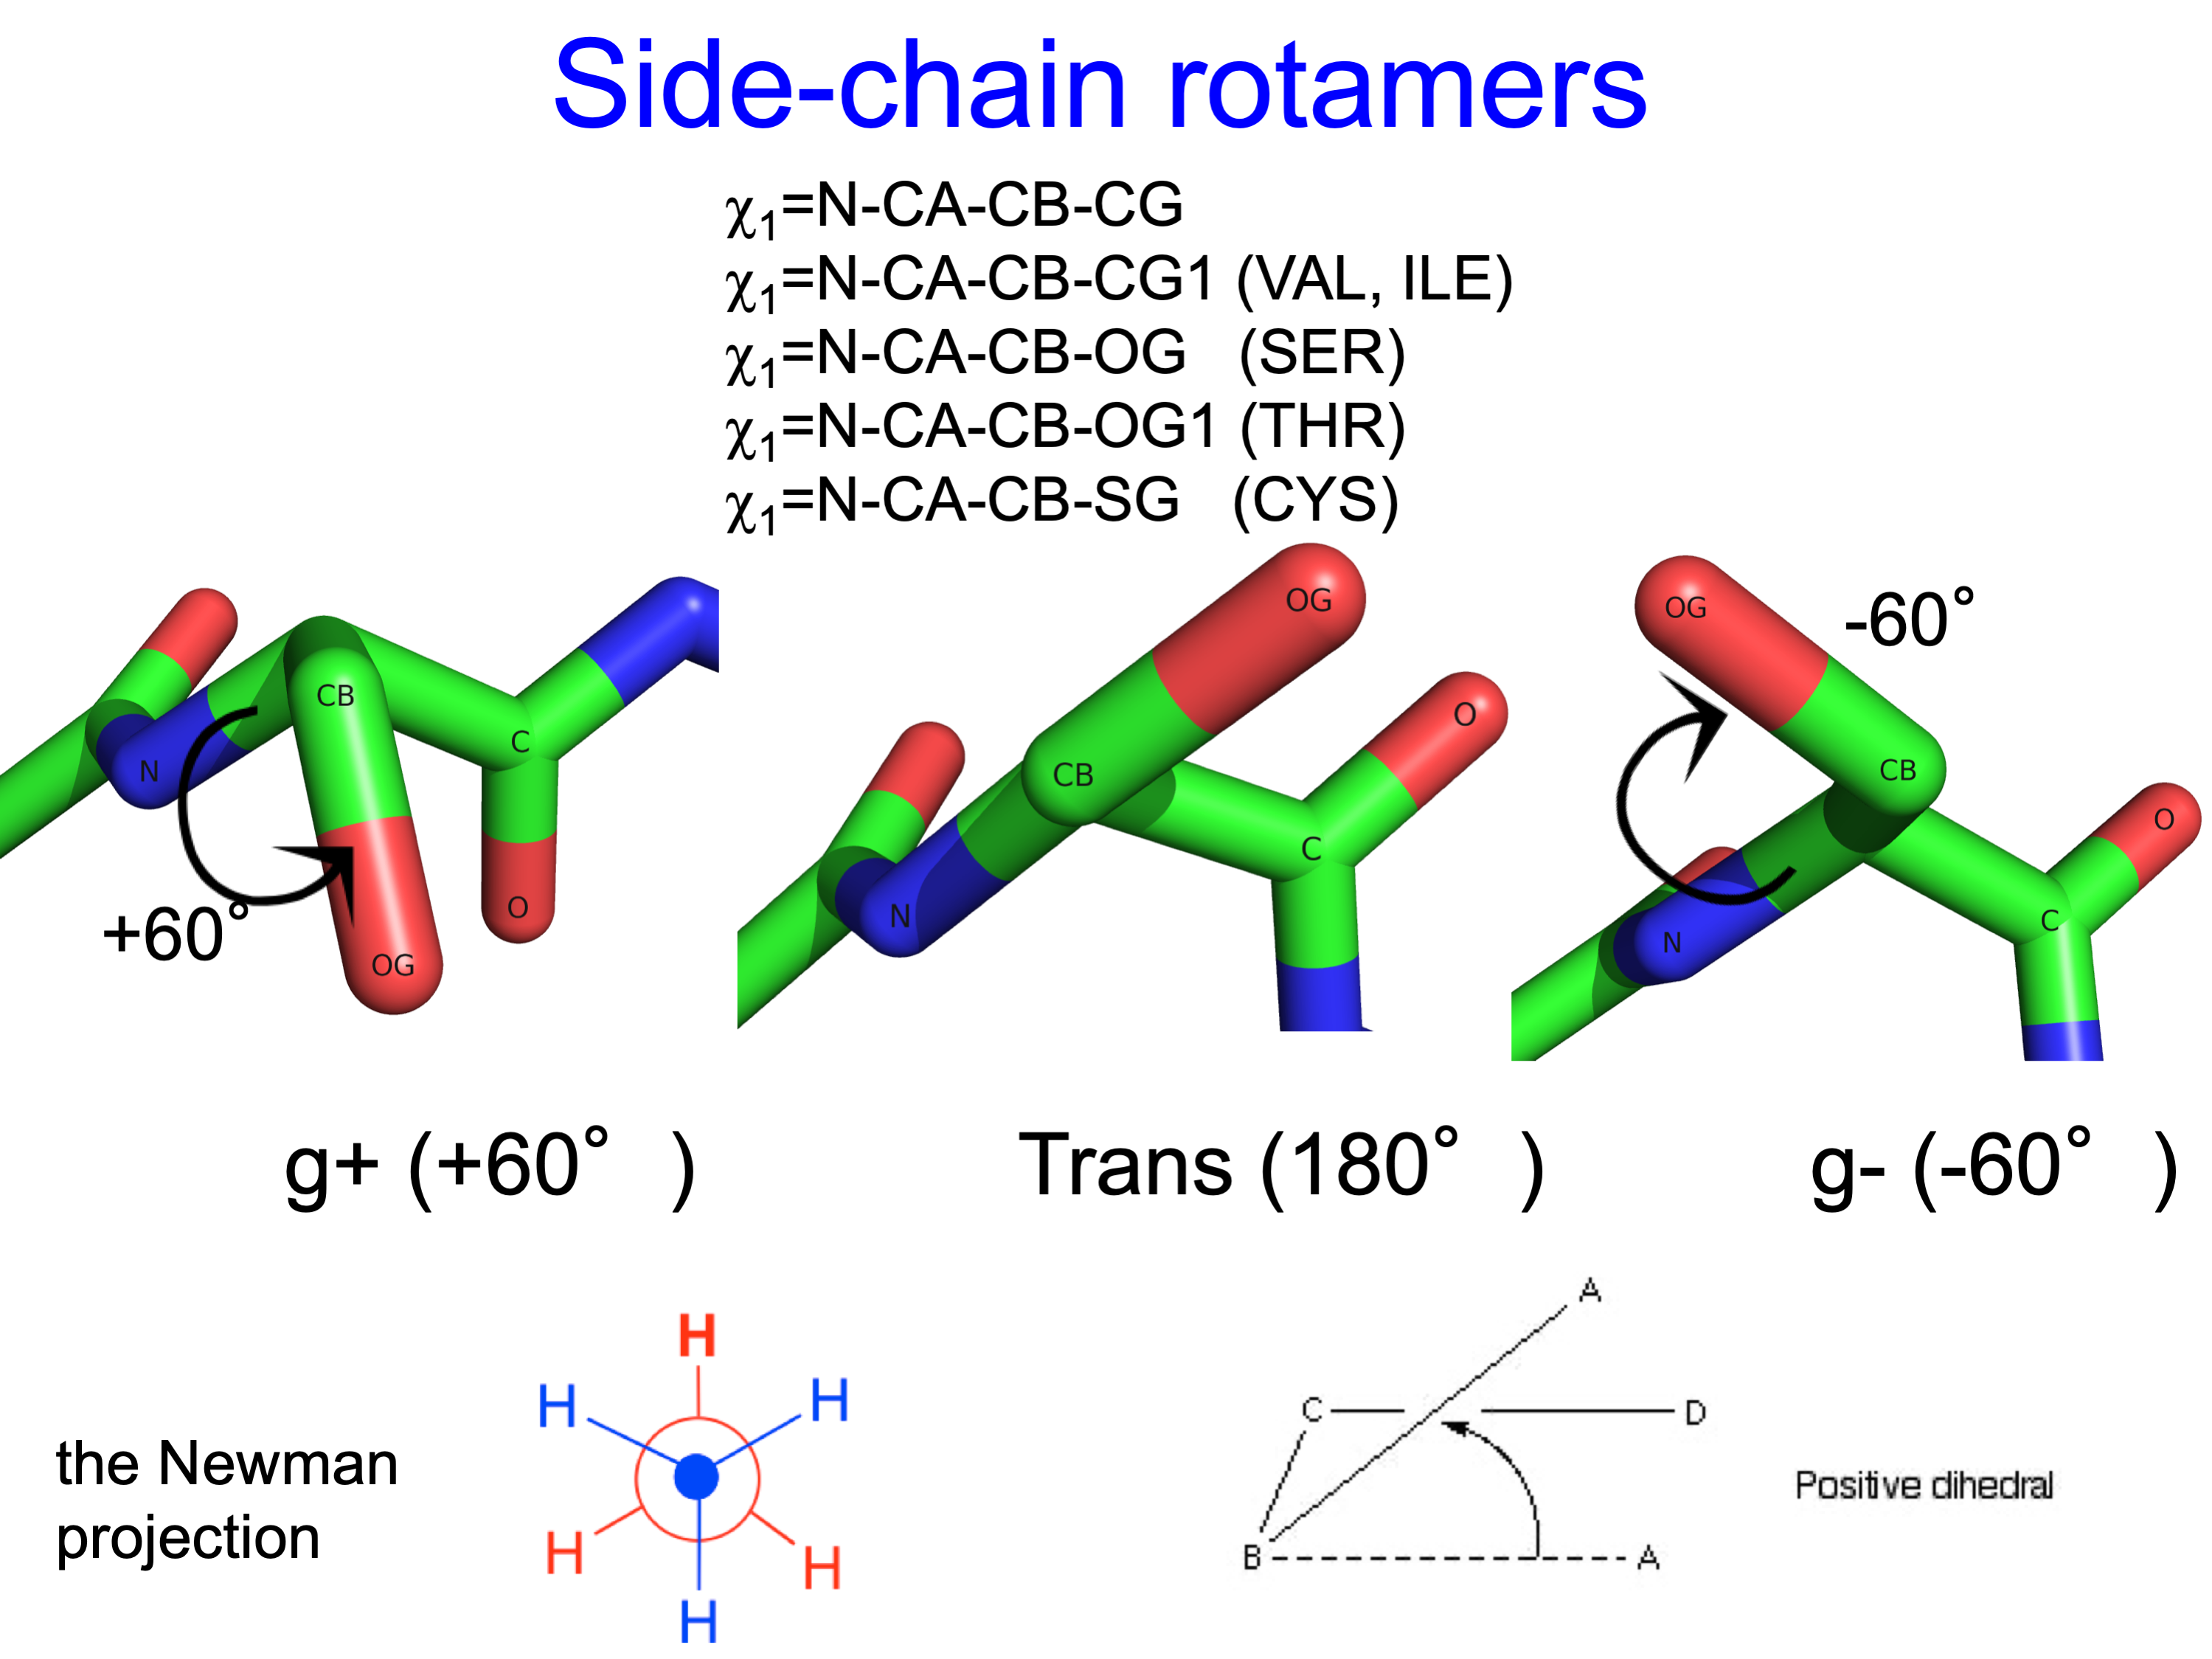
We define the χ1 rotamers ("r1") for all side chains (except Pro) as follows
                  0° <= χ1 < 120°       g+
                120° <= χ1 < 240°       t
               -120° <= χ1 <   0°       g-
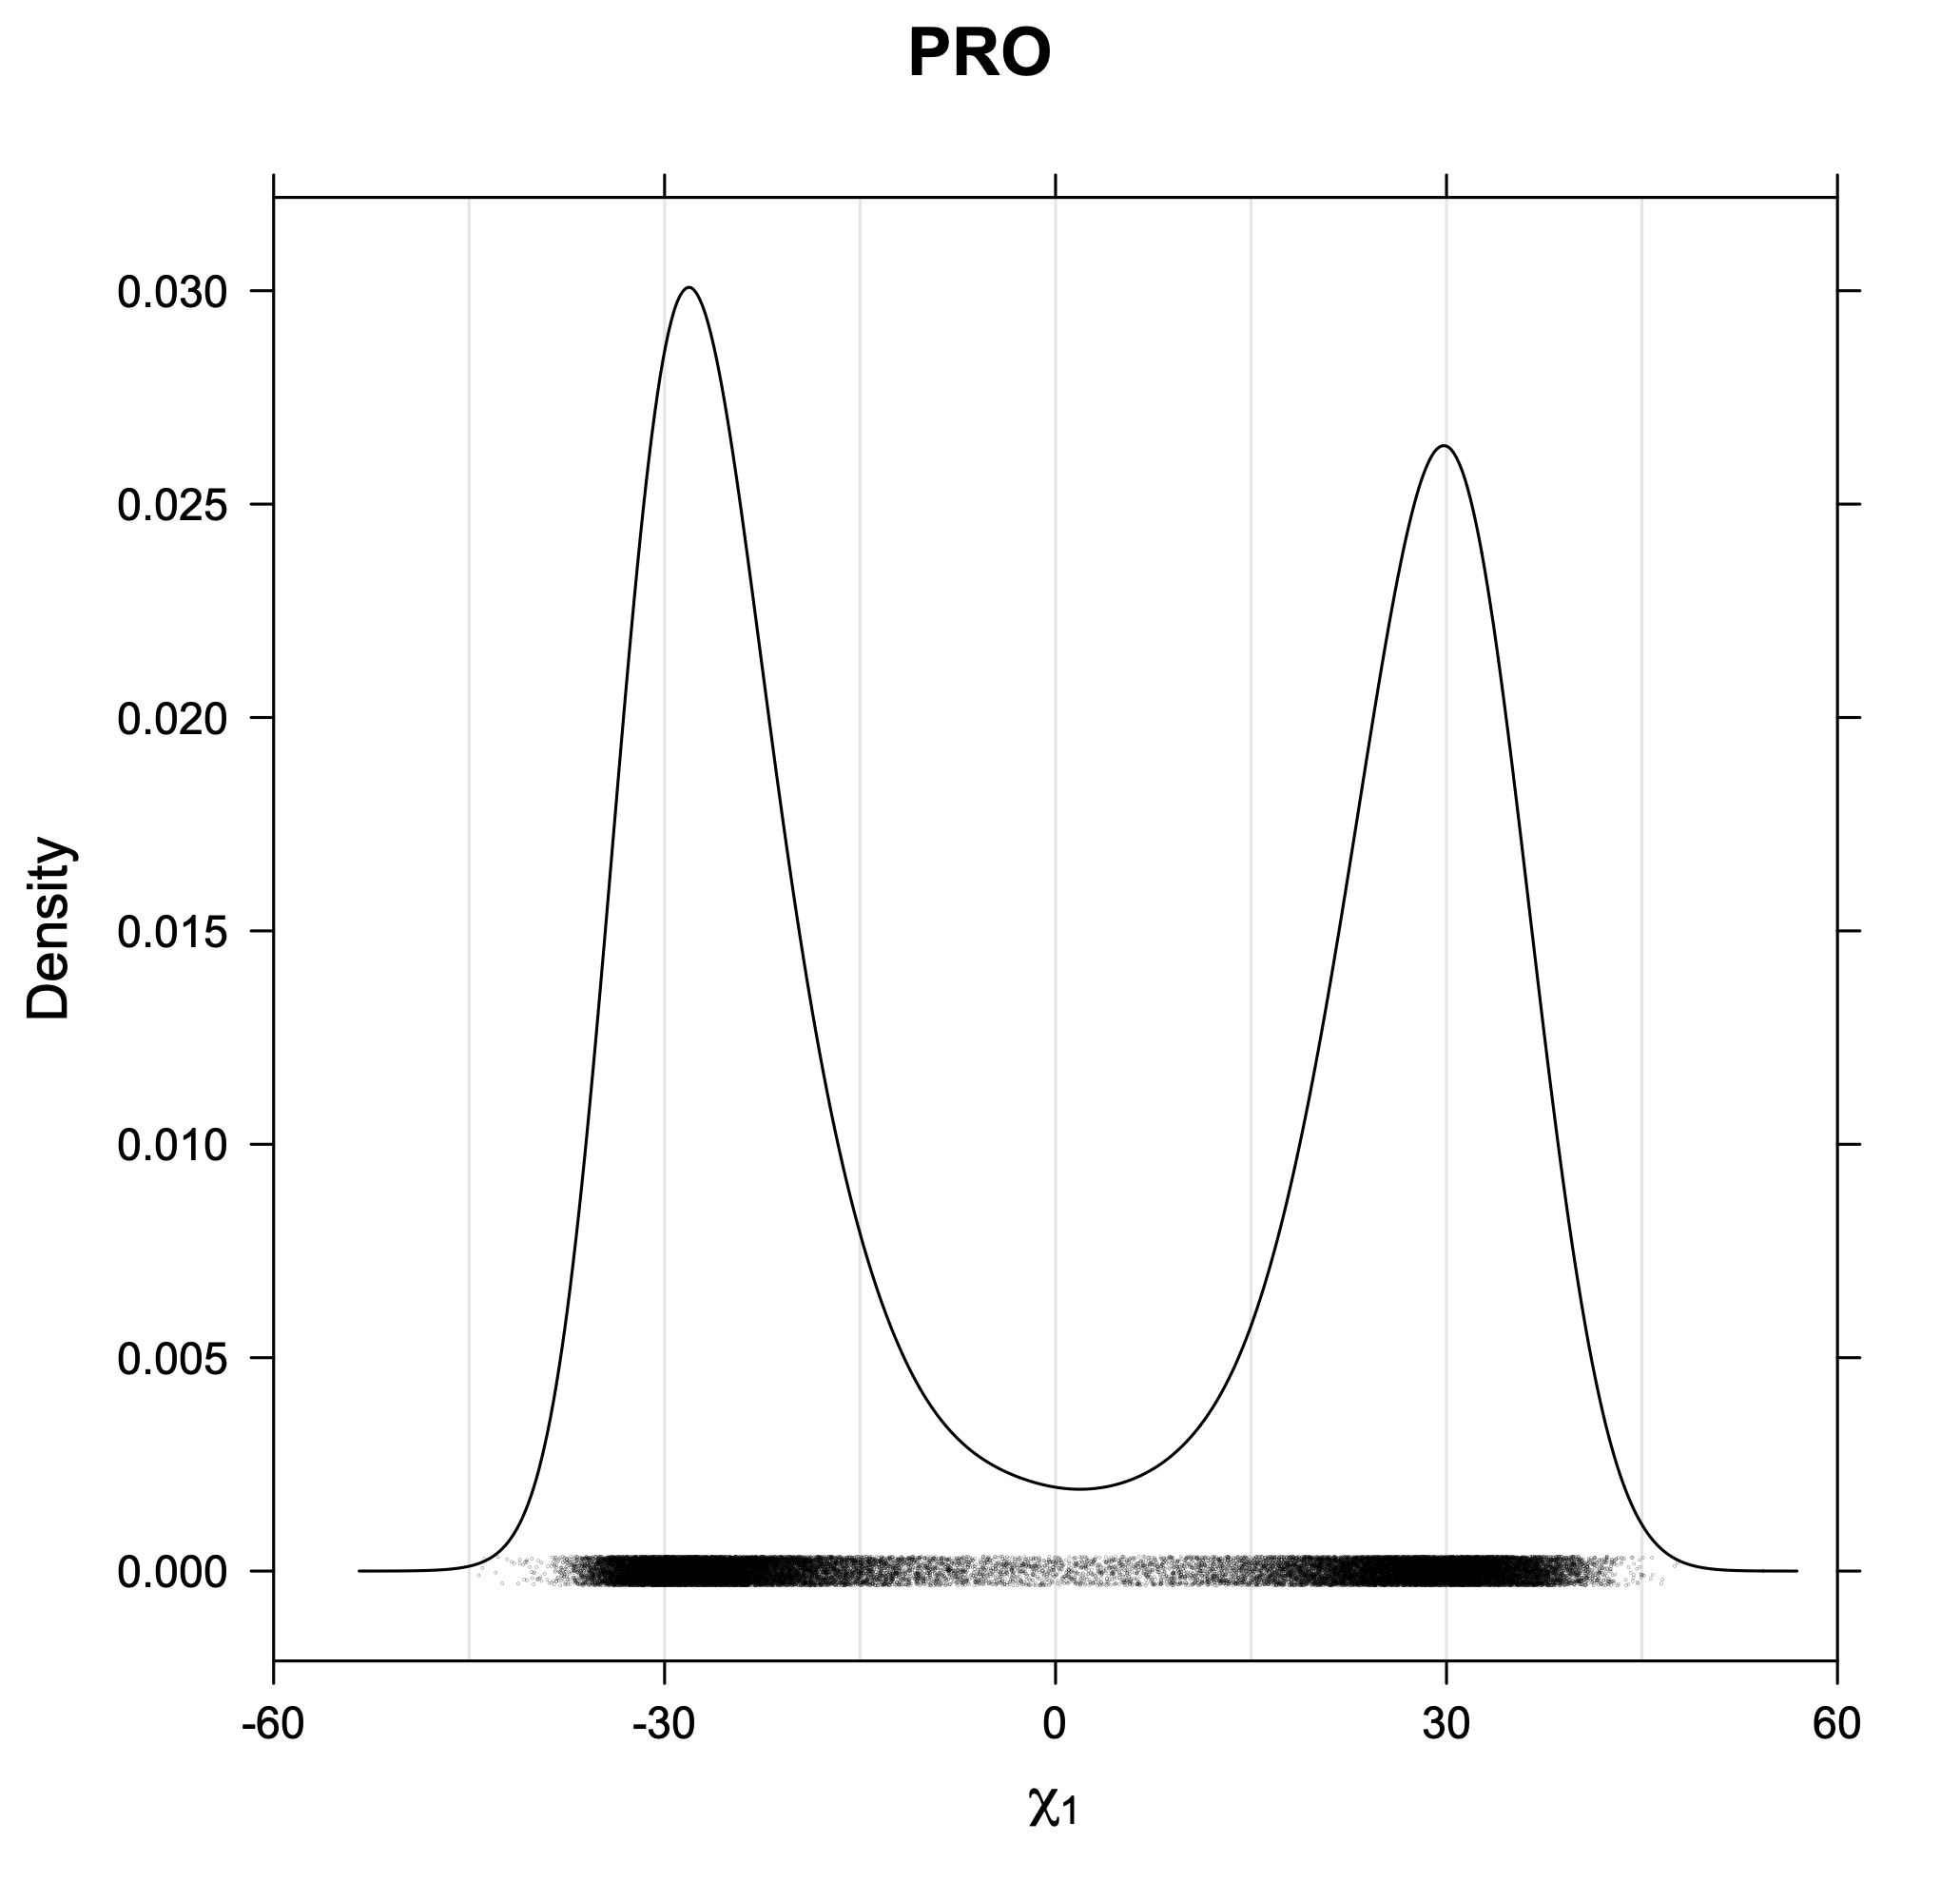
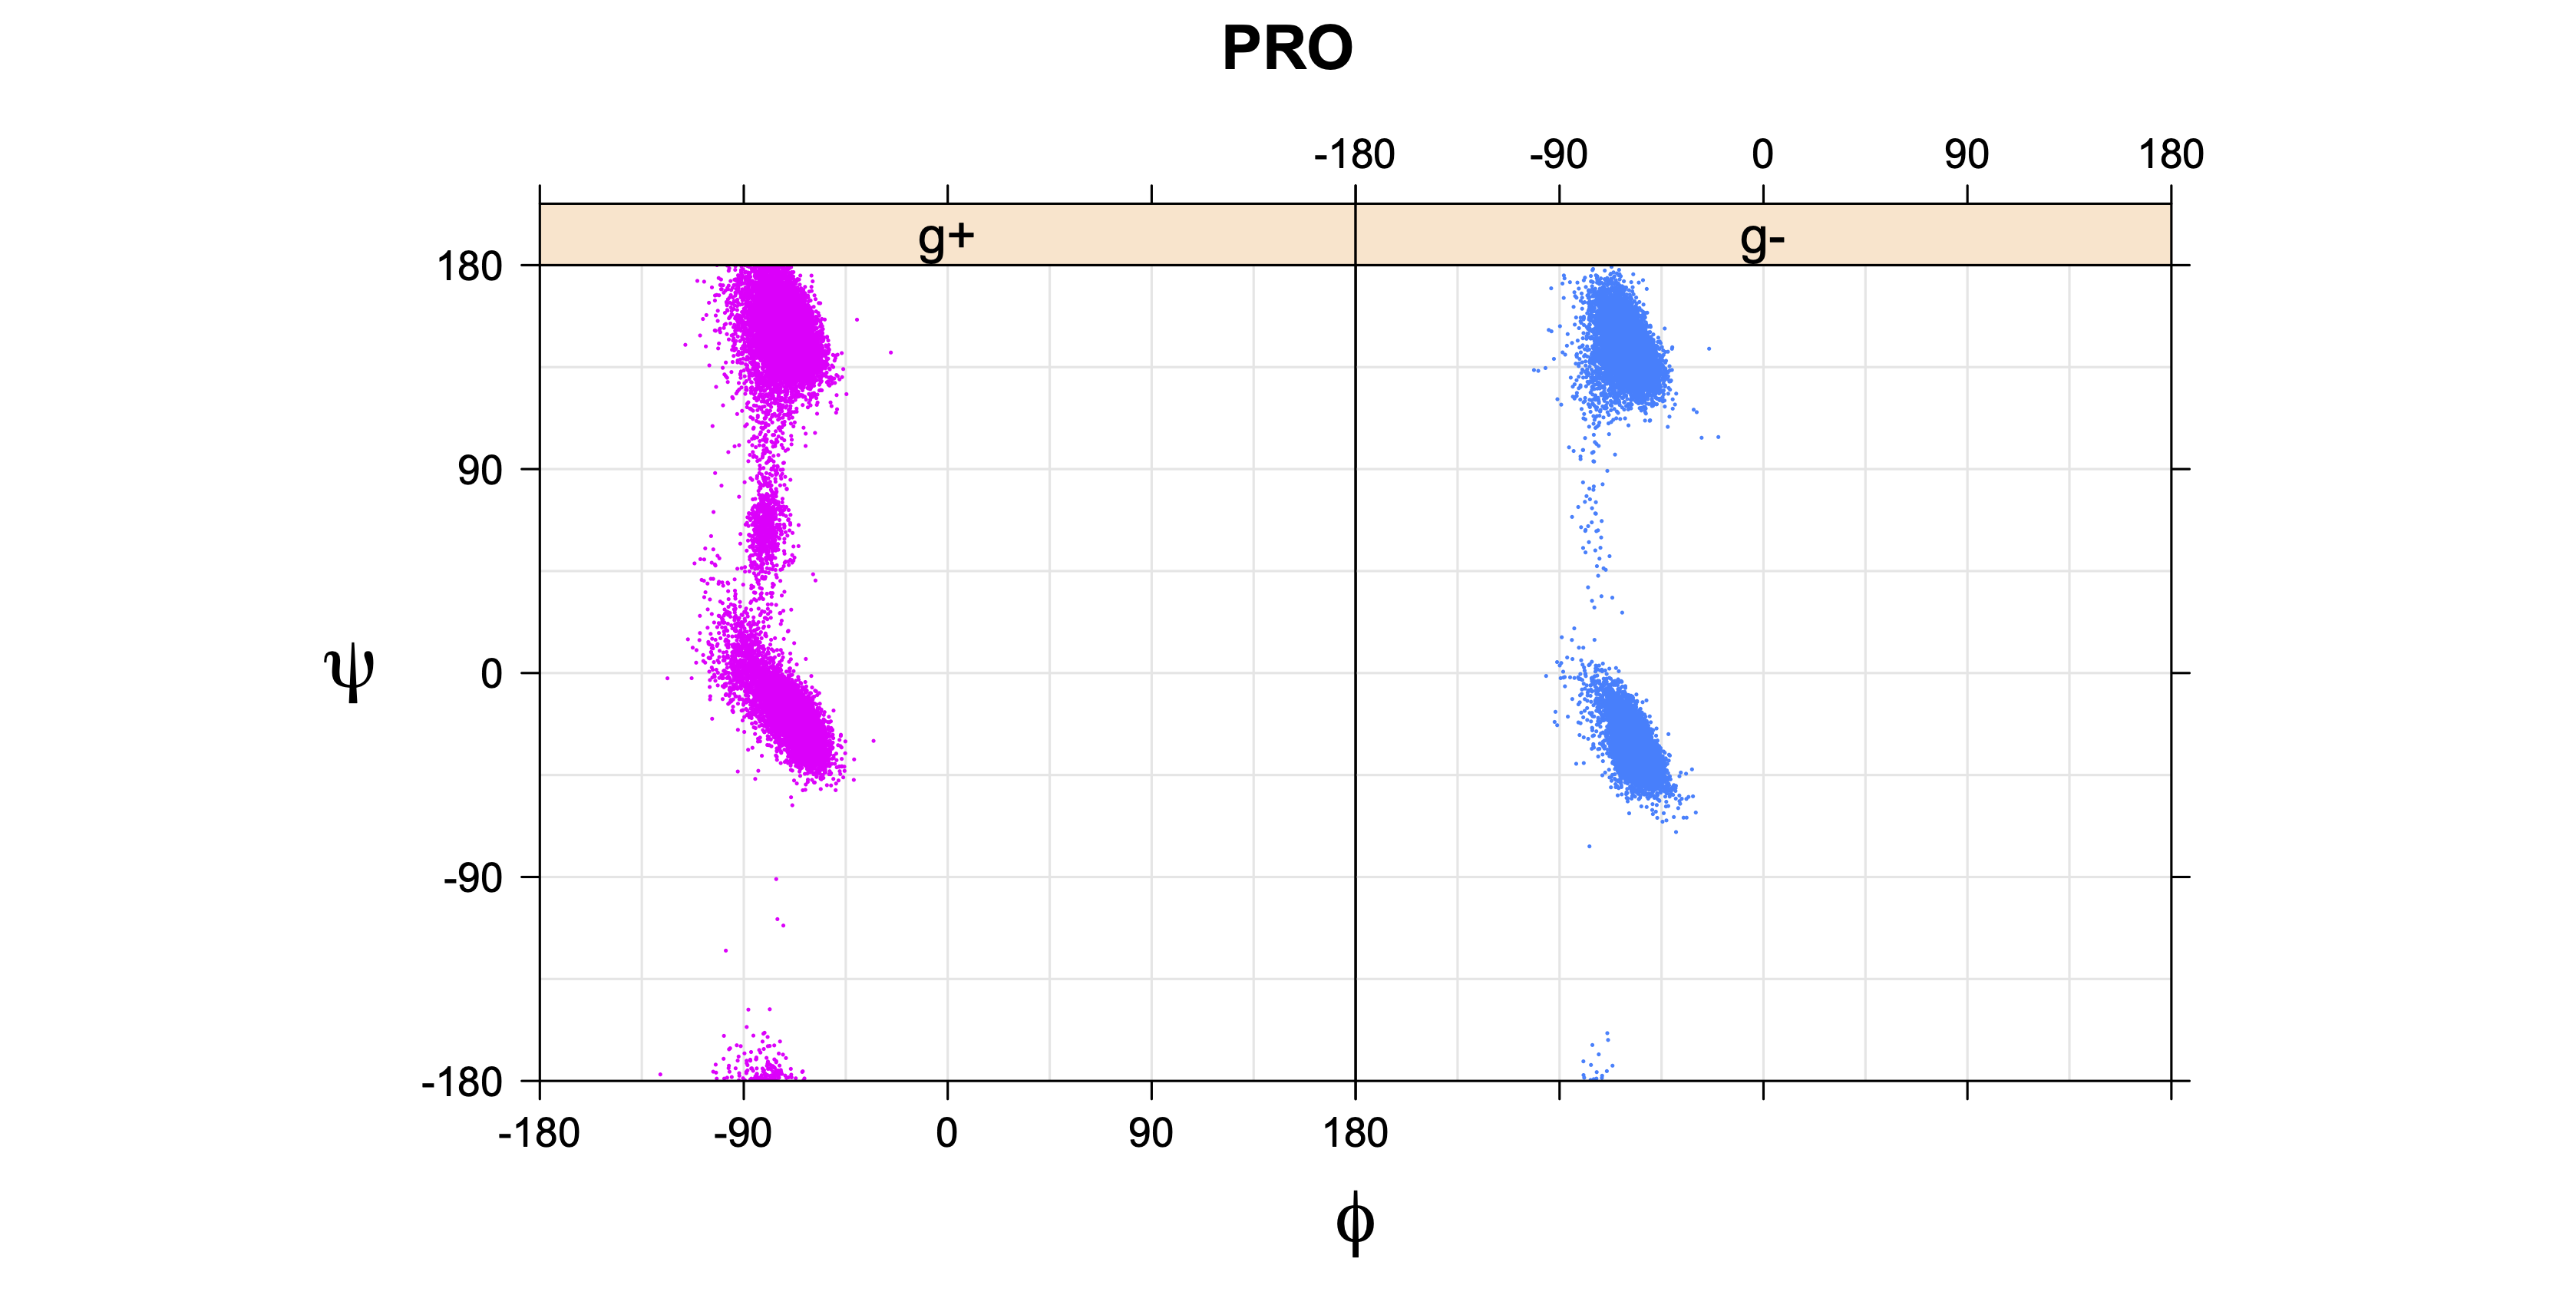
For Proline,
                χ1 >= 0°      g+ (or CG-endo)
                χ1 <  0°      g- (or CG-exo)
The three χ1 rotamers of all side-chain types (except Pro) look like this:
Because of close steric interactions between the delta carbons and the backbone N and C atoms of residue i, some conformations have very low frequency.
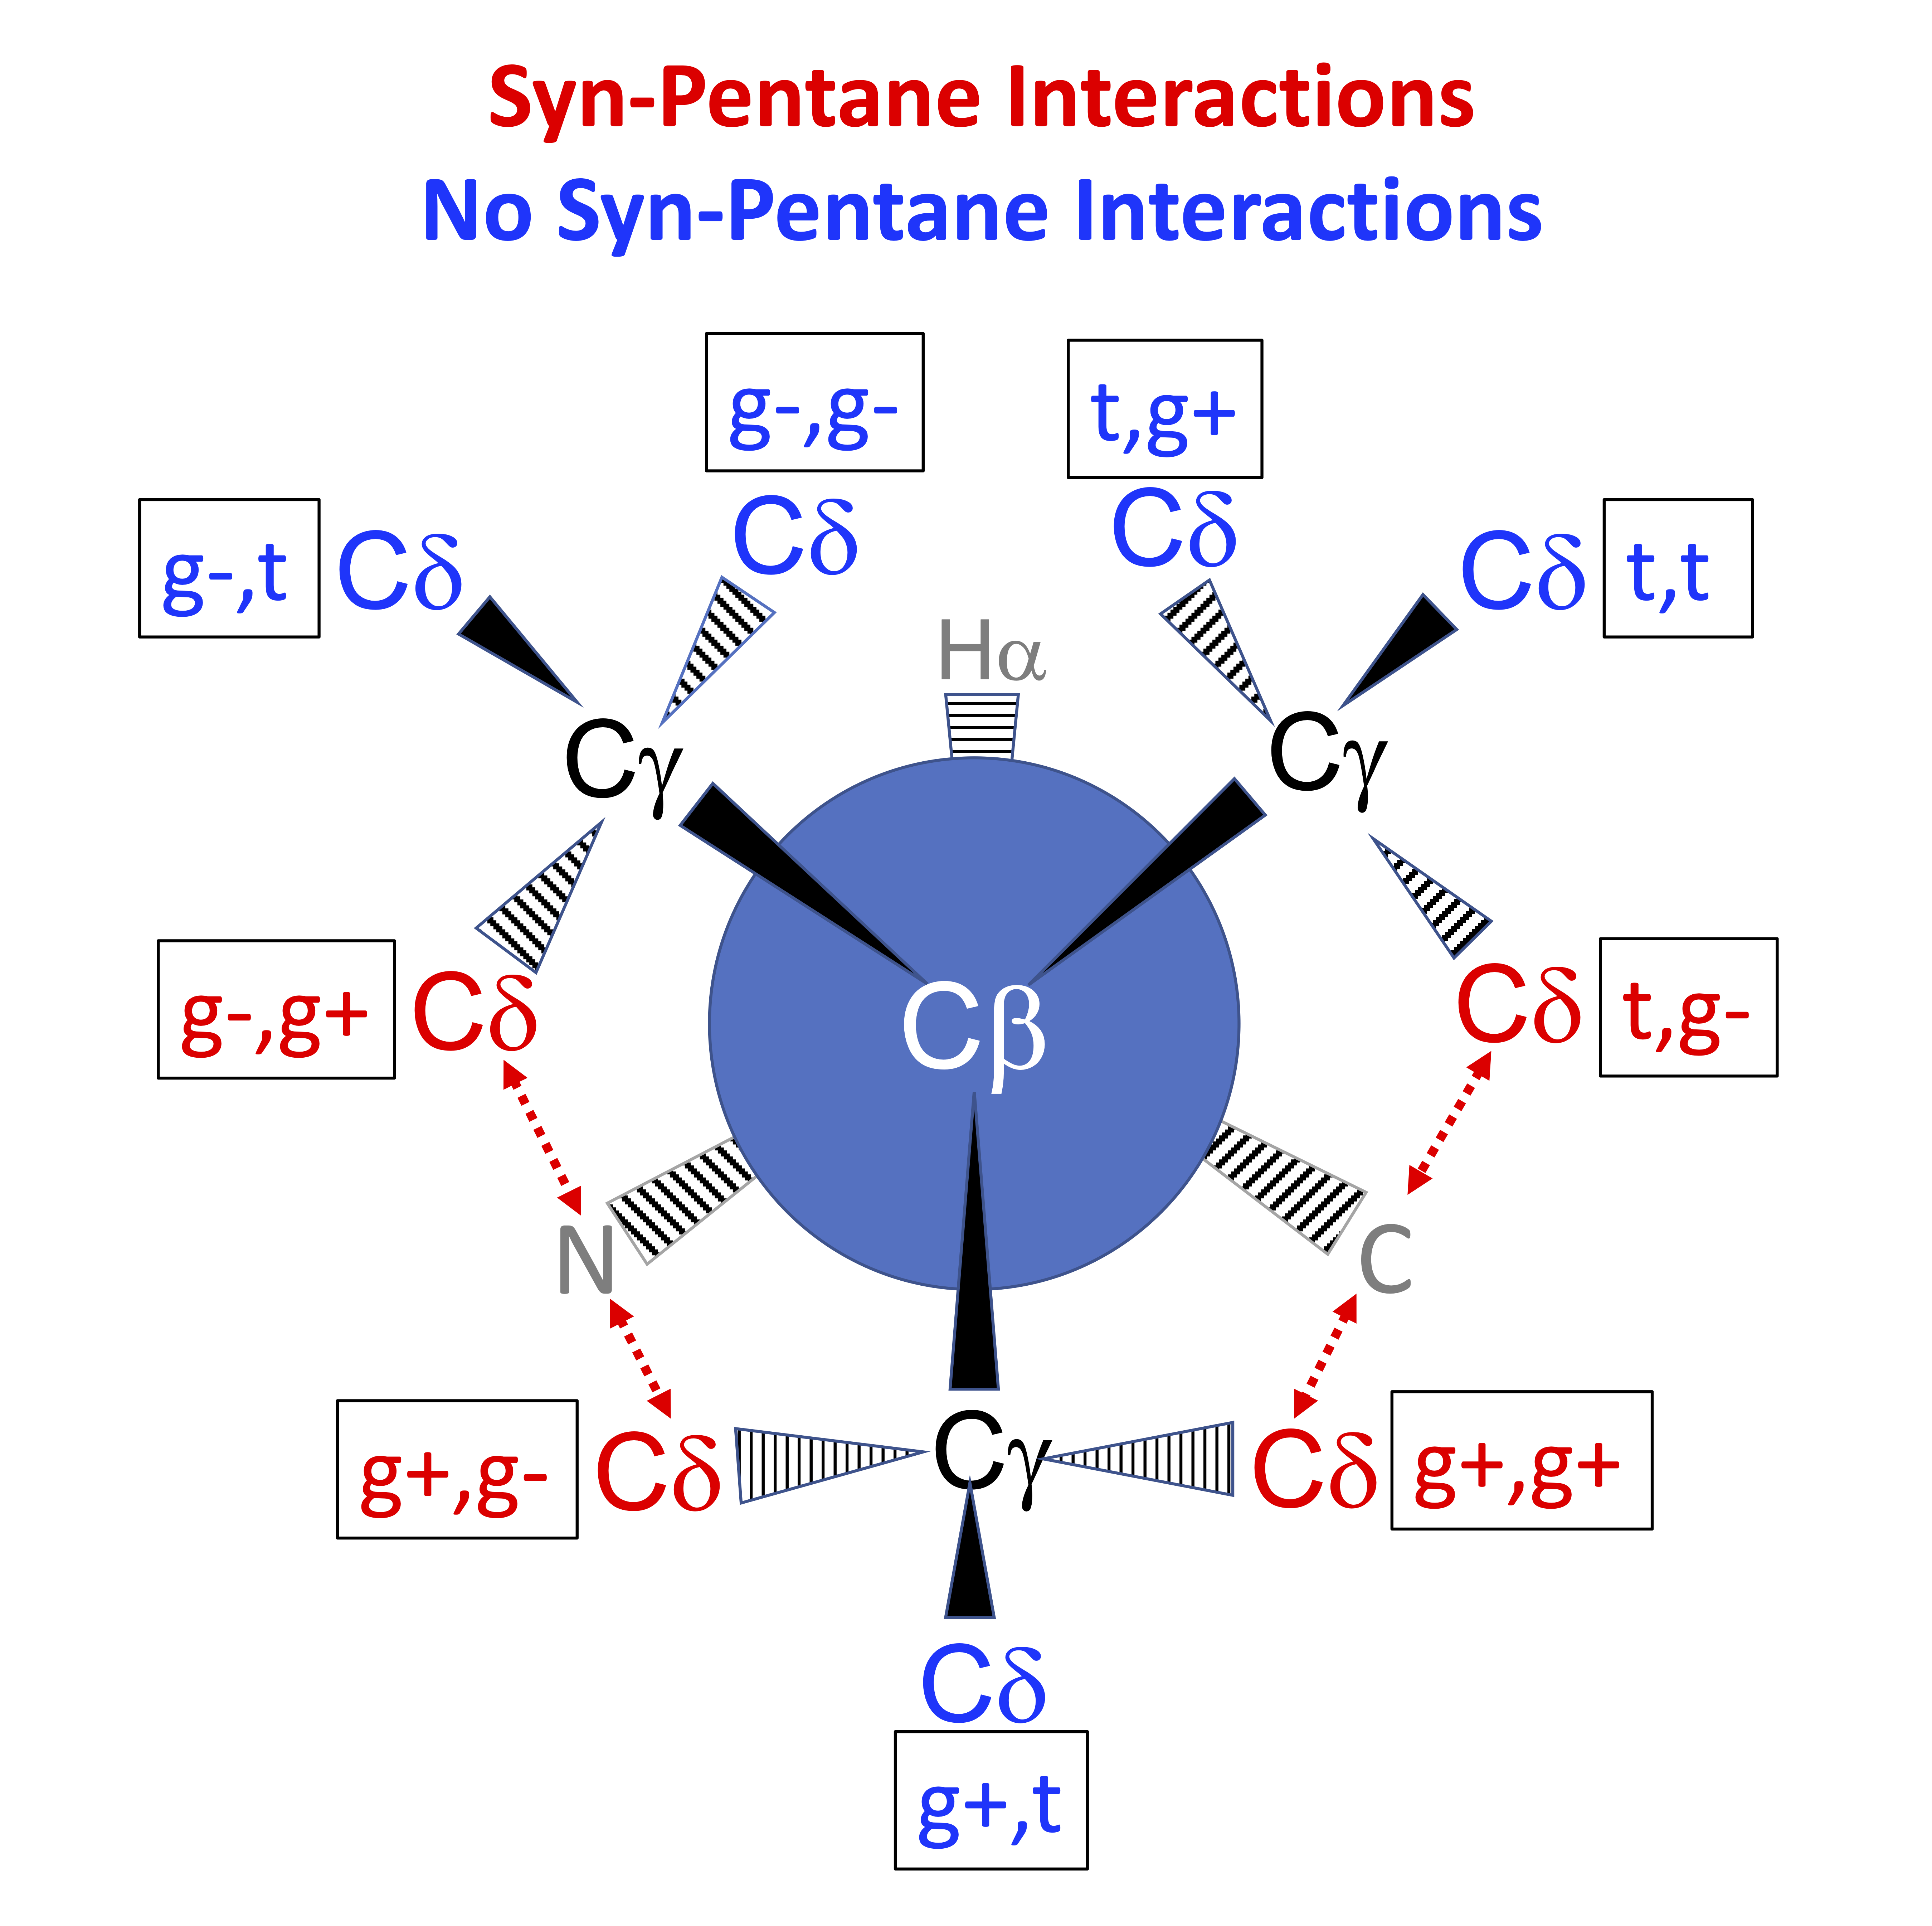
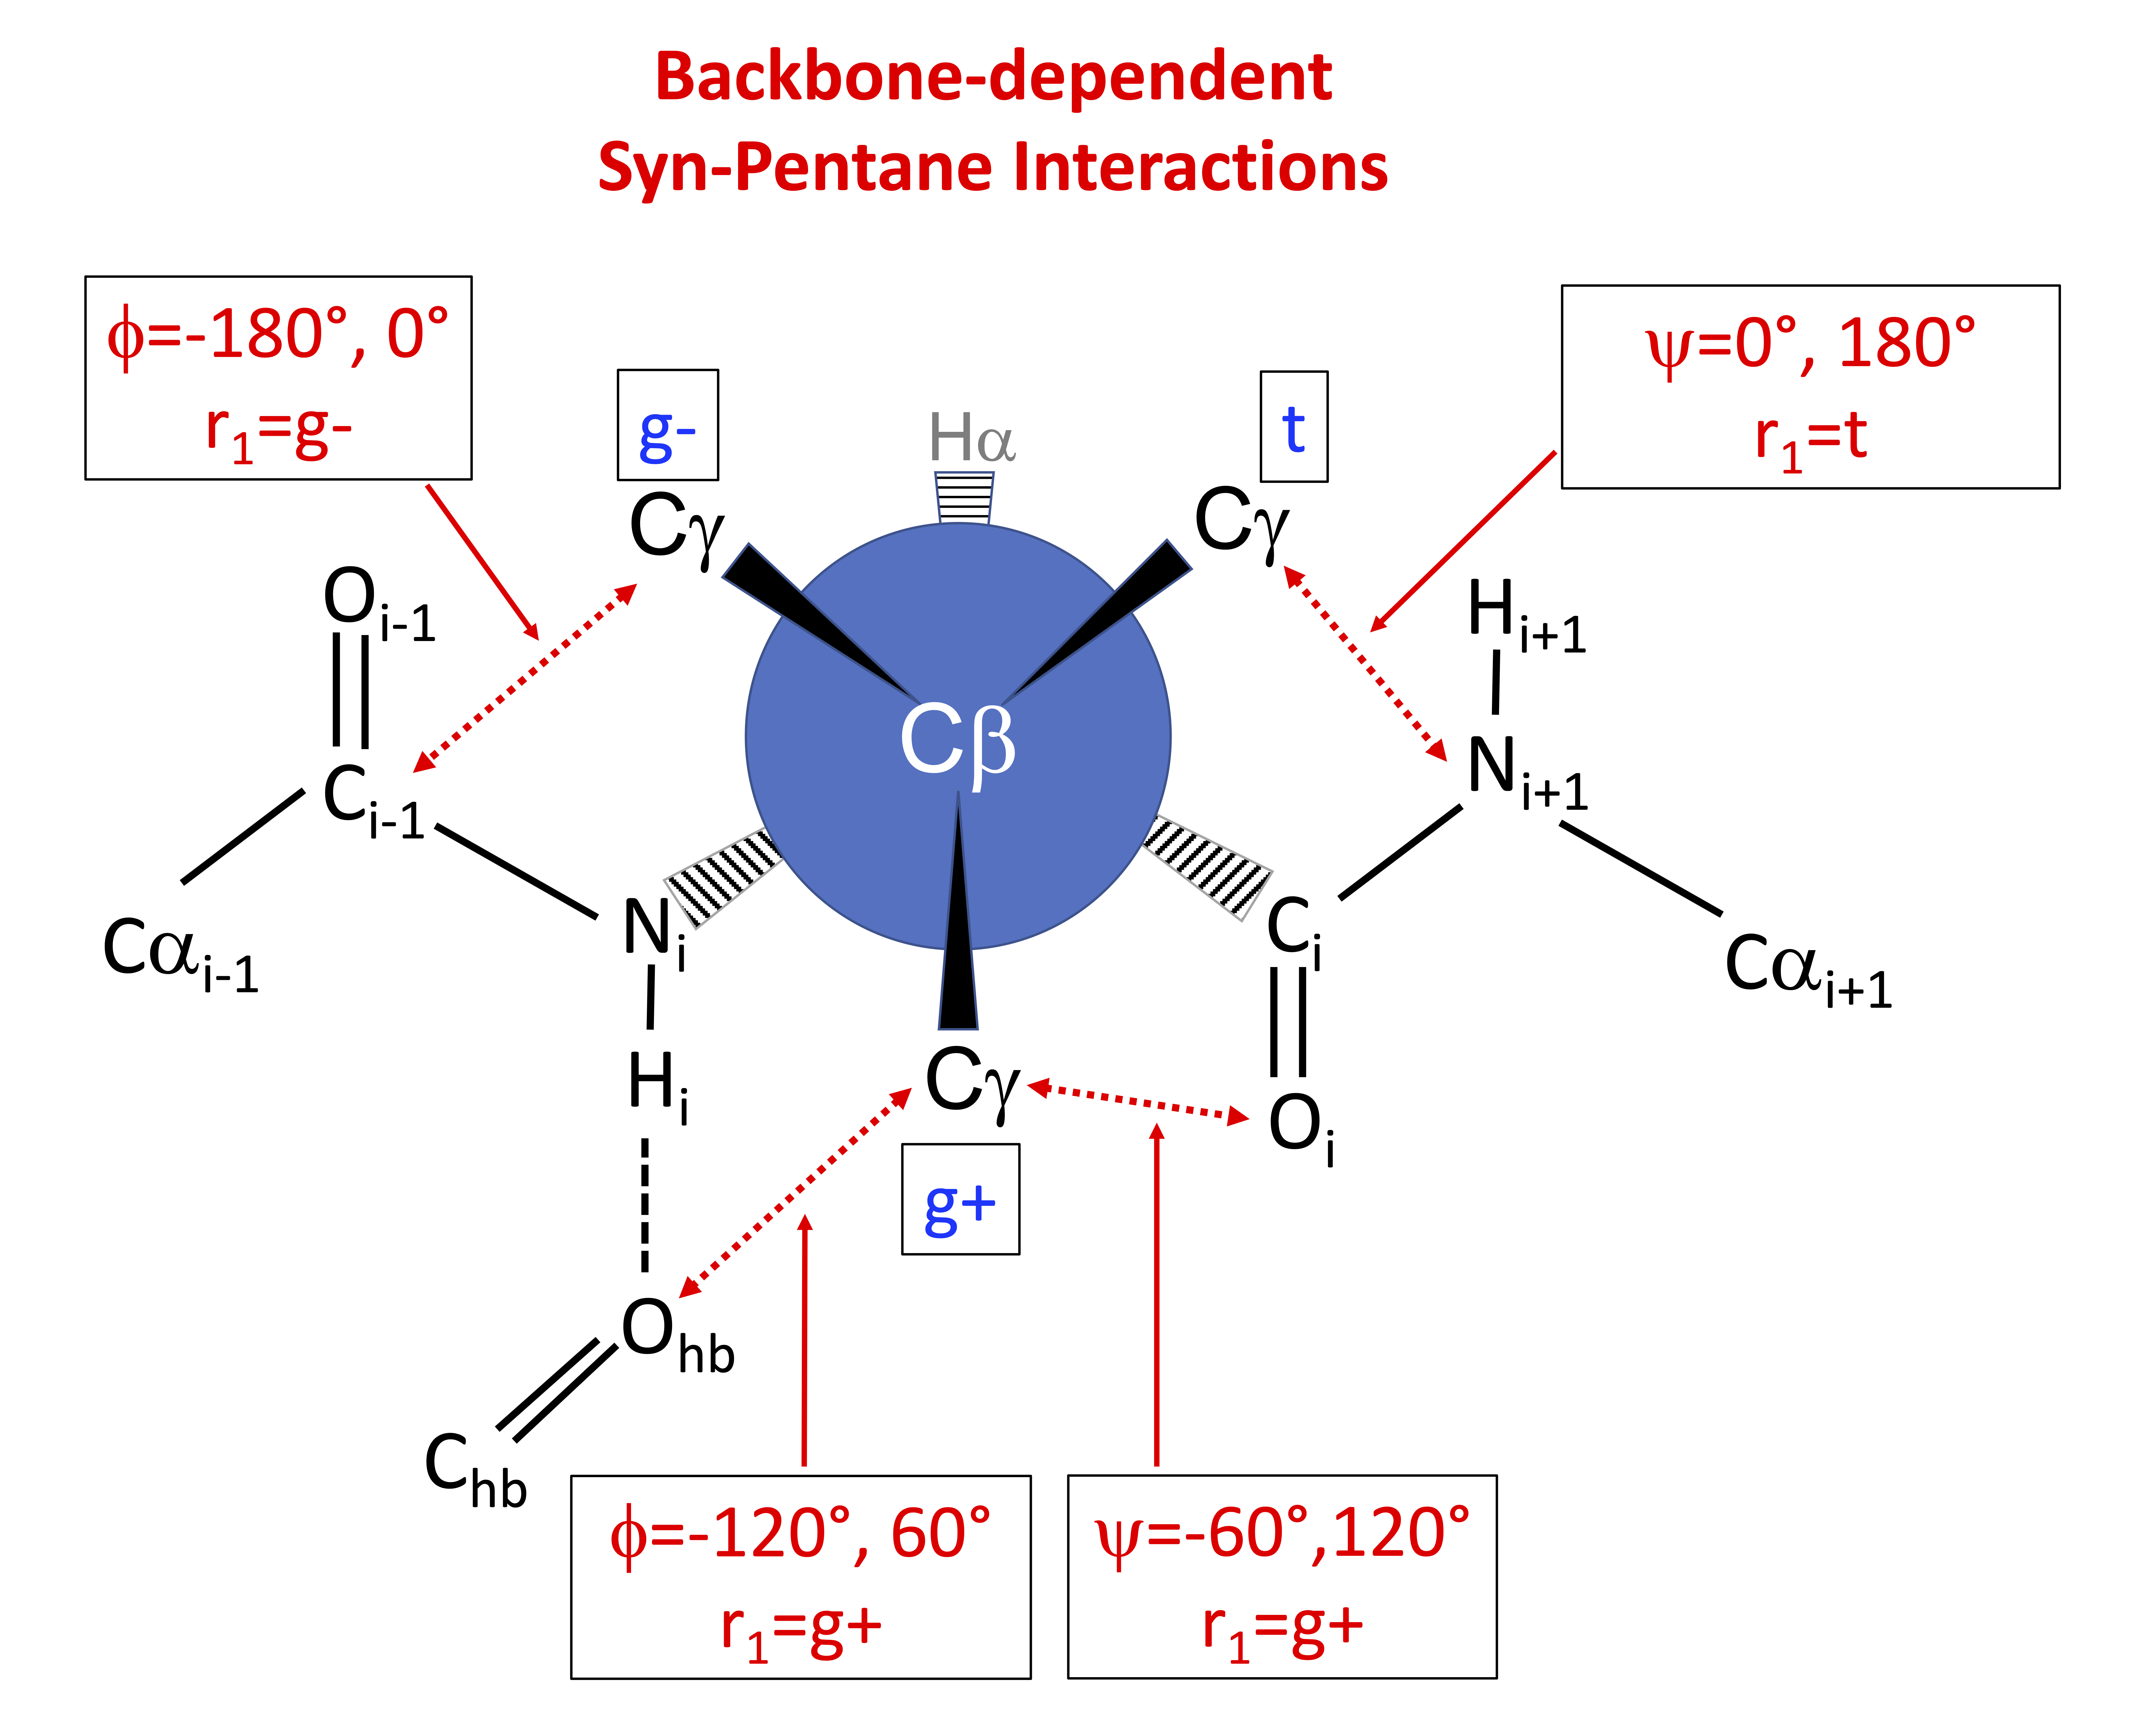
In the Newman diagram above, with the alpha carbon (not visible) behind the beta carbon, syn-pentane interactions between delta carbons and the local backbone are shown in red. In each of these cases, the dihedrals (N or C)-CA-CB-CG and CA-CB-CG-CD form approximately +60°,-60° or -60°,+60° pairs of dihedrals.
Derivation of rotamer states with syn-pentane interactions for different types of side chains is detailed just below.
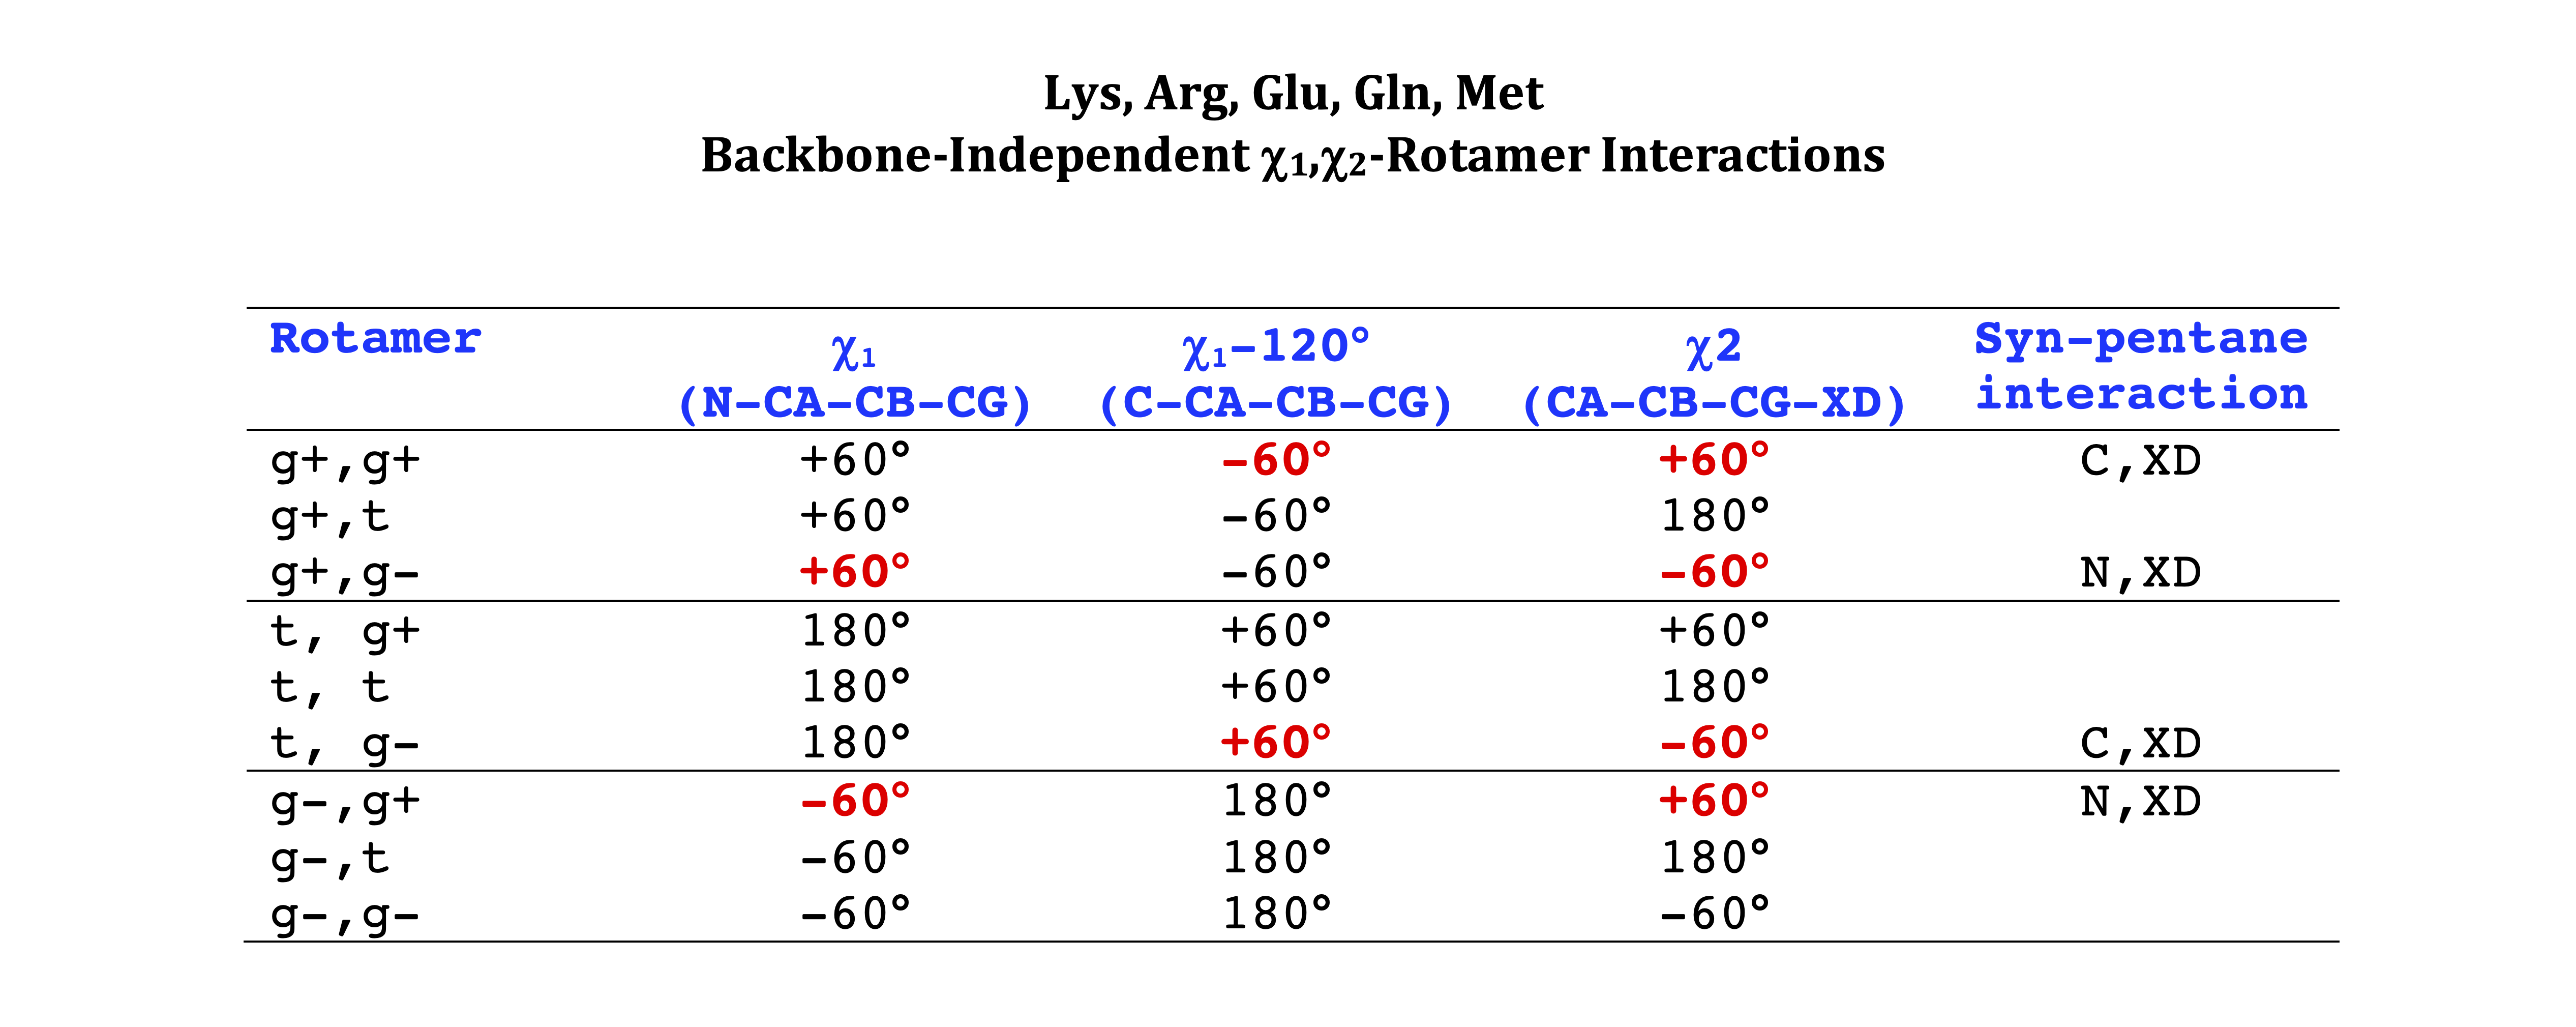
Arg, Lys, Met, Gln, Glu, Ile
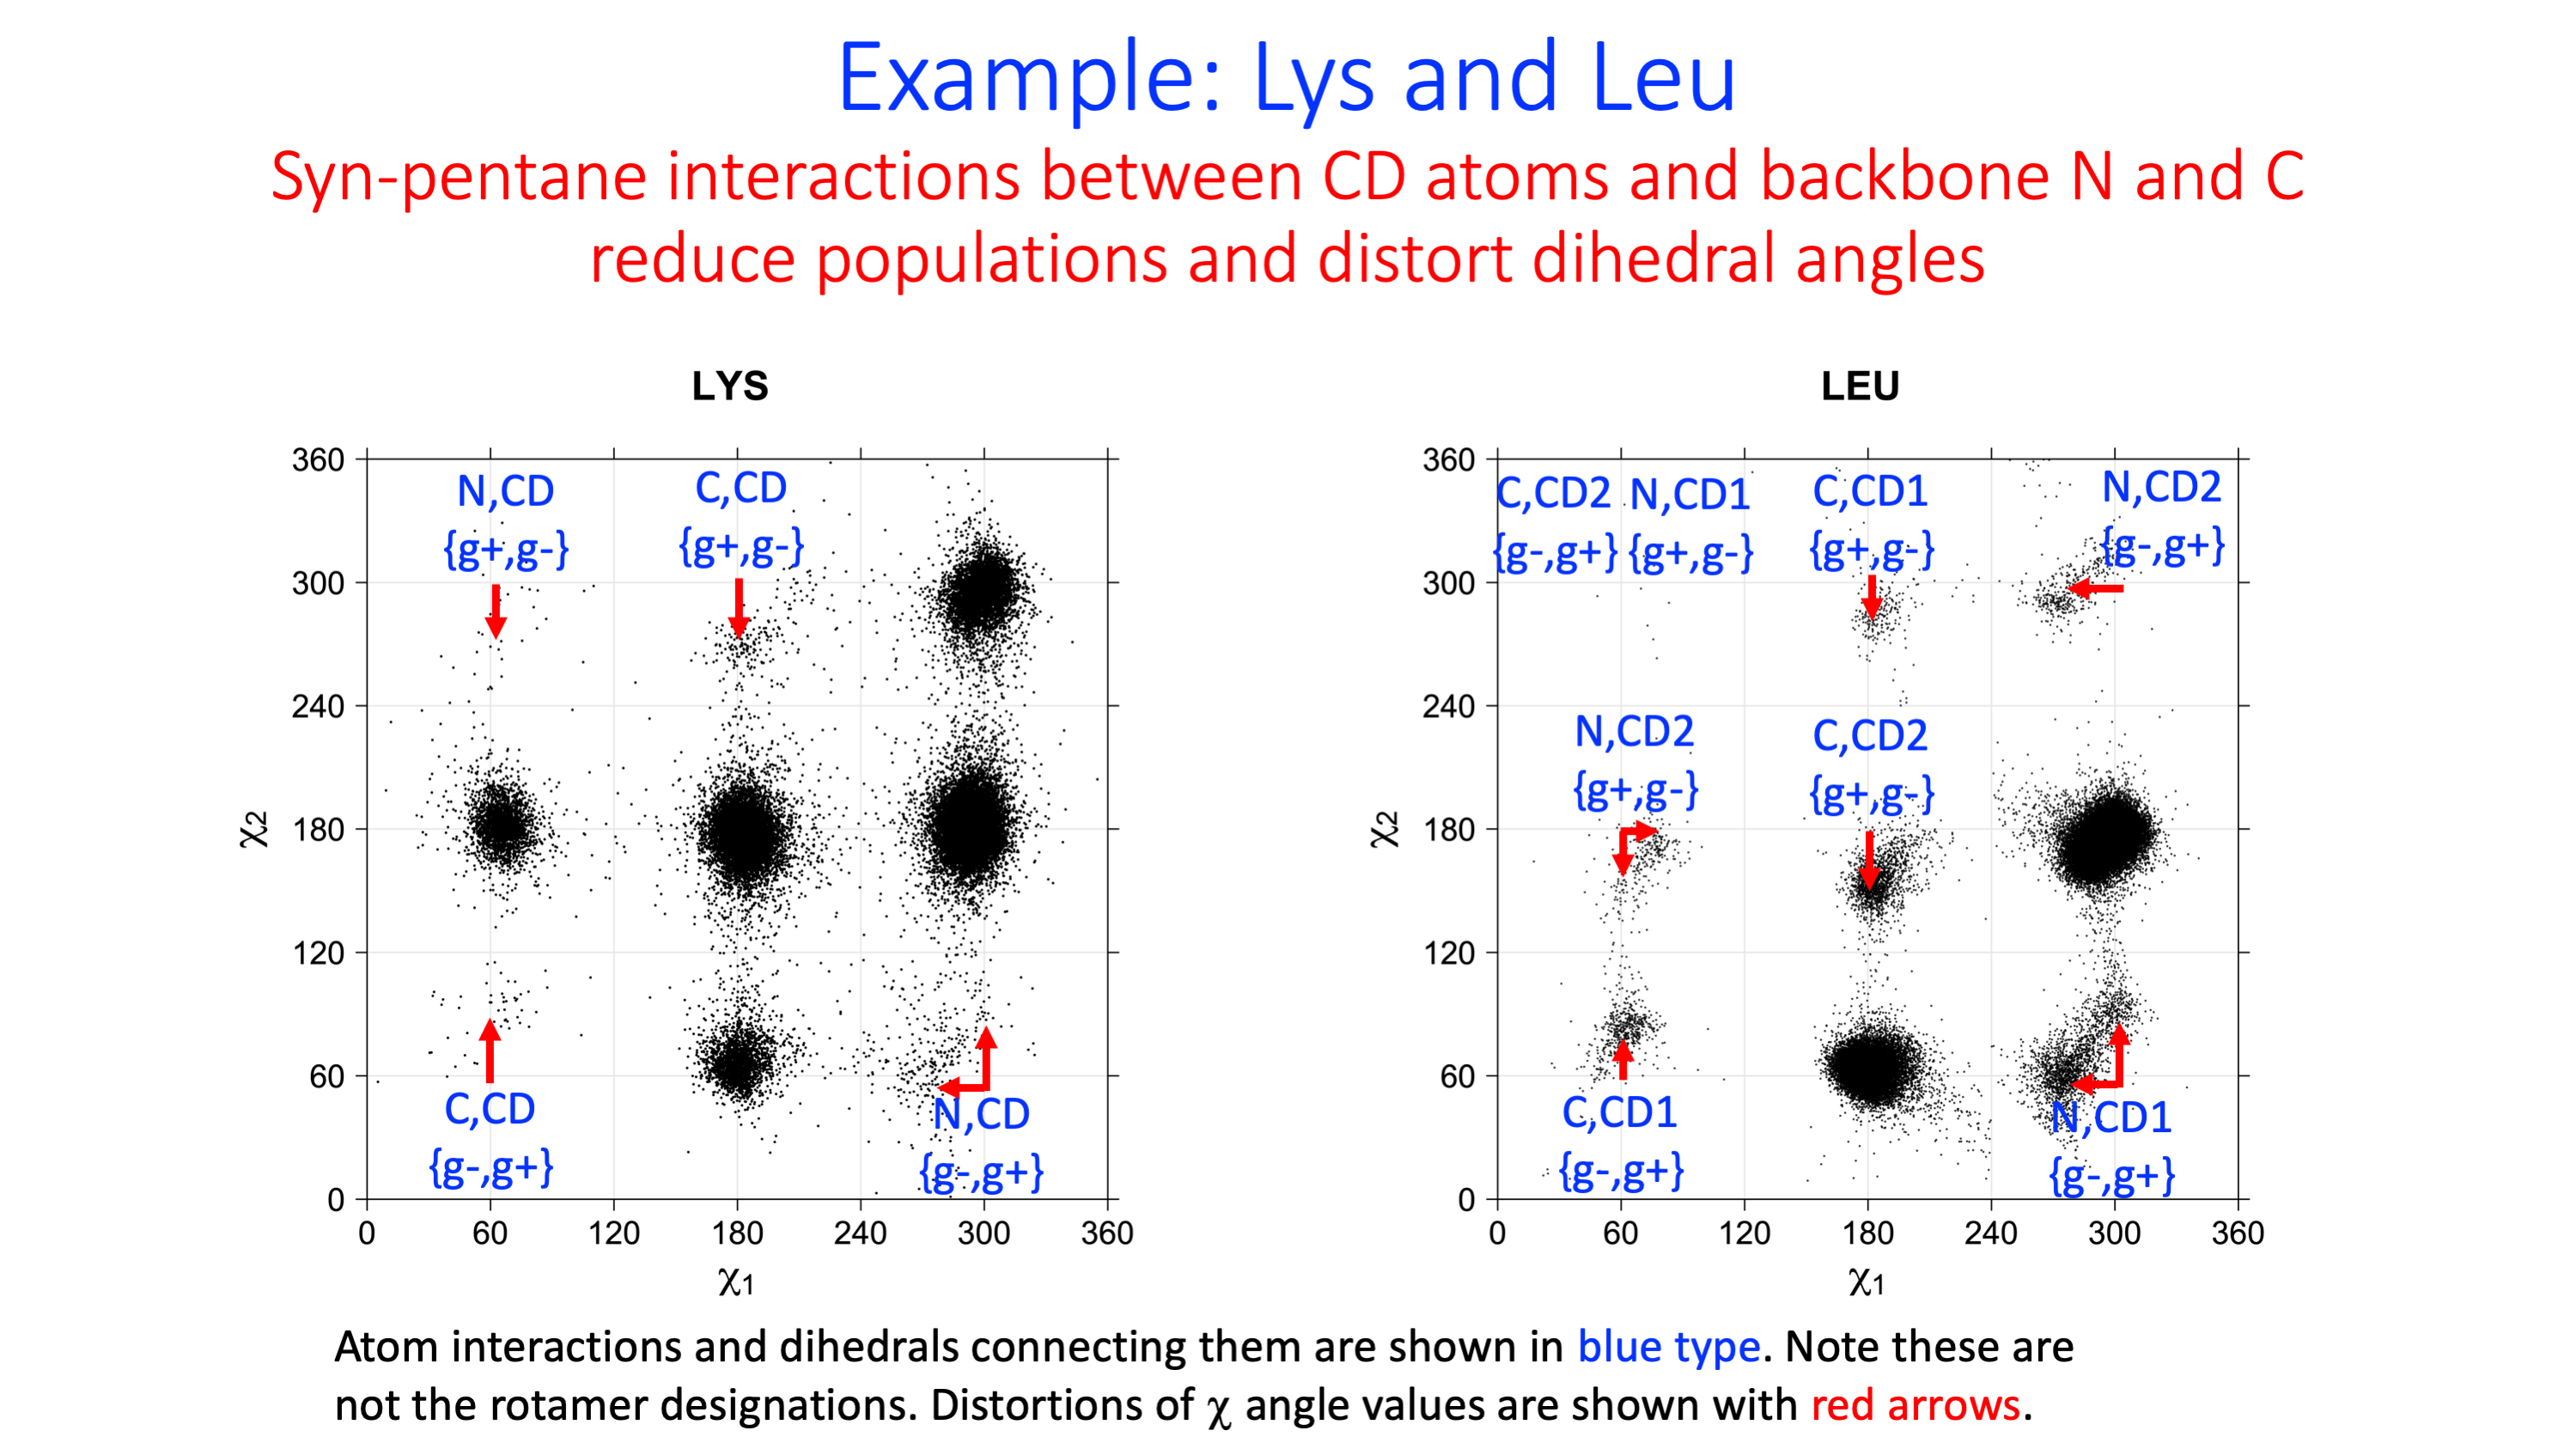
We expect low percentages and large deviations from standard rotamer values (χ=+60°,180°,-60°) for rotamers with χ1,χ2 syn-pentane interactions with the backbone N and C. These are marked in bold red type in the following tables
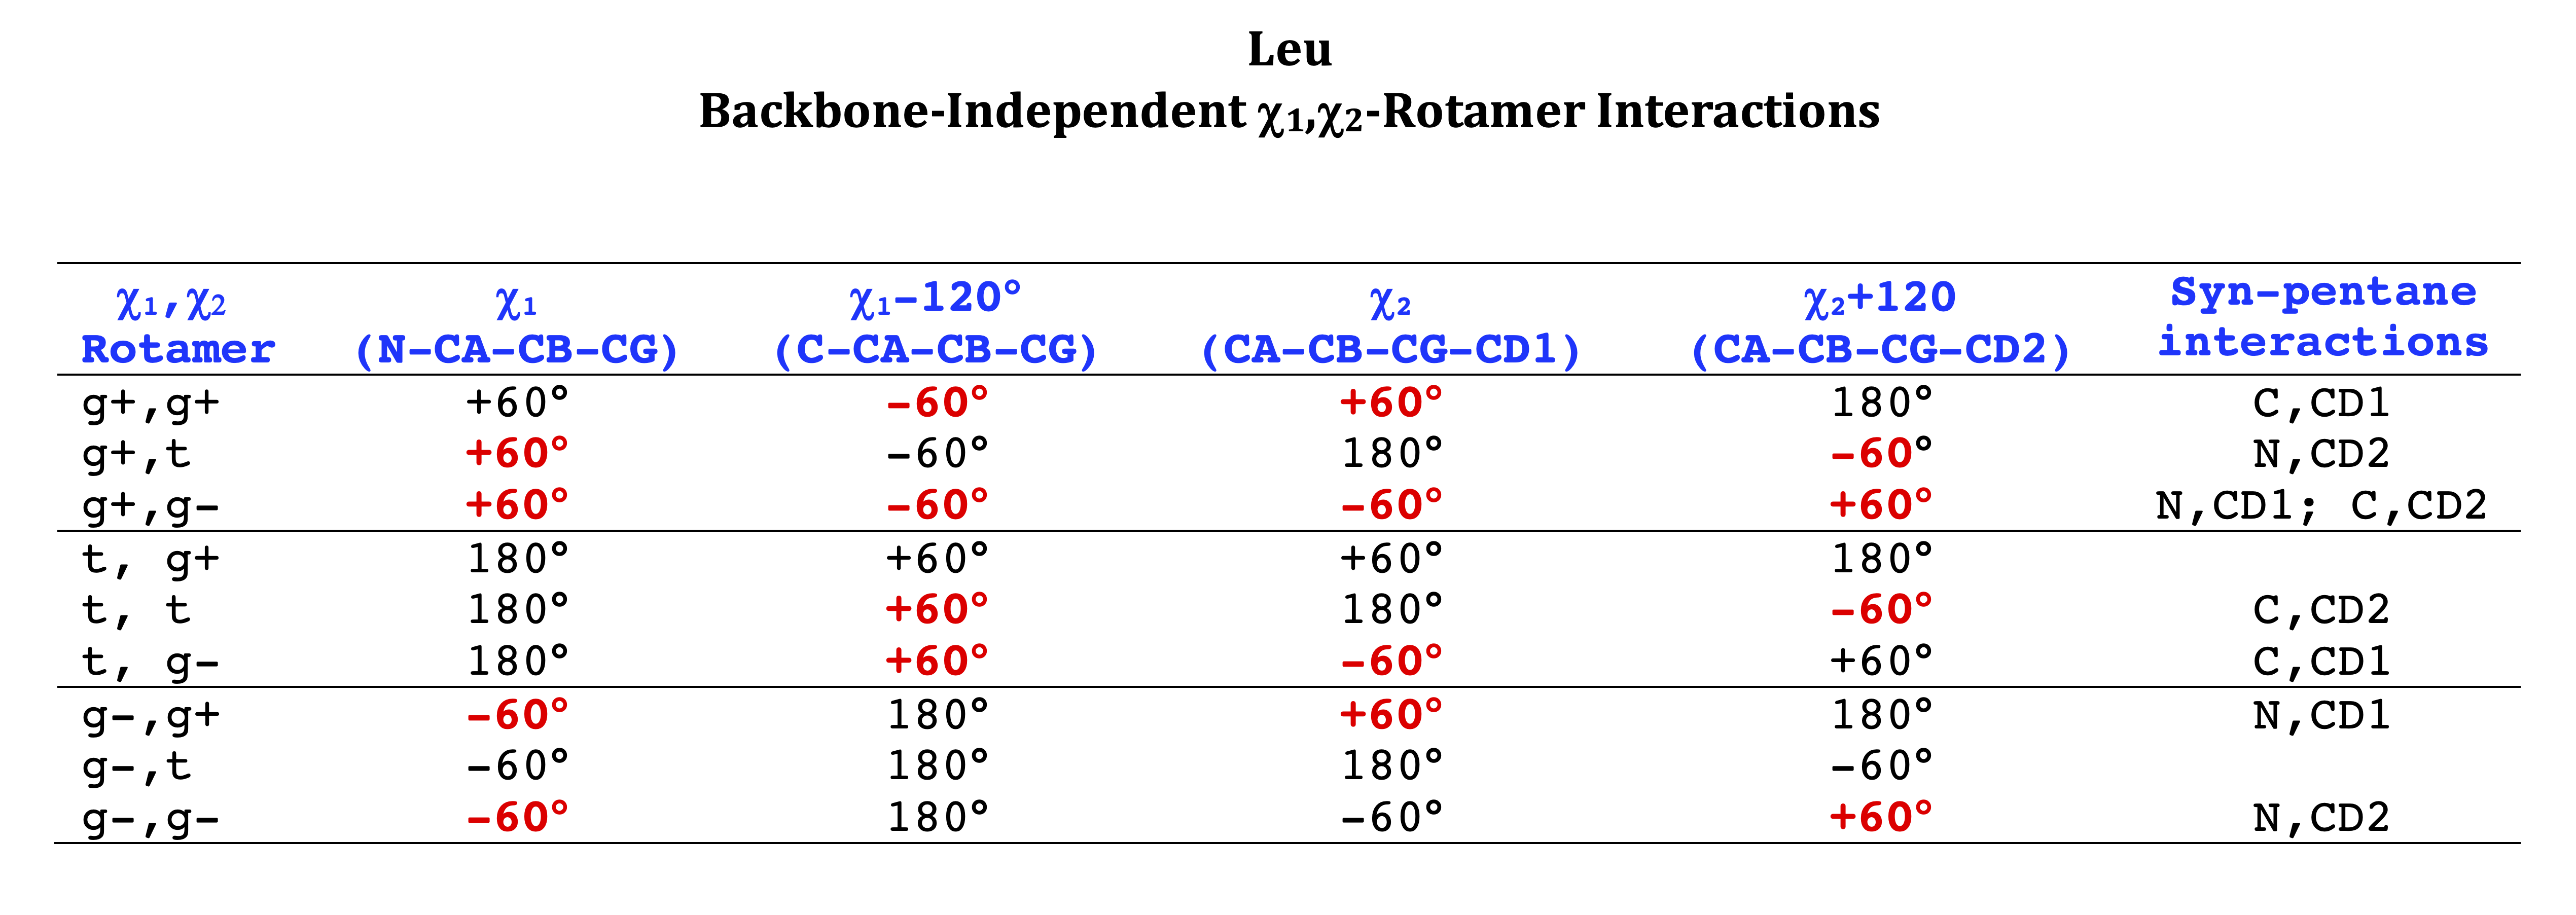
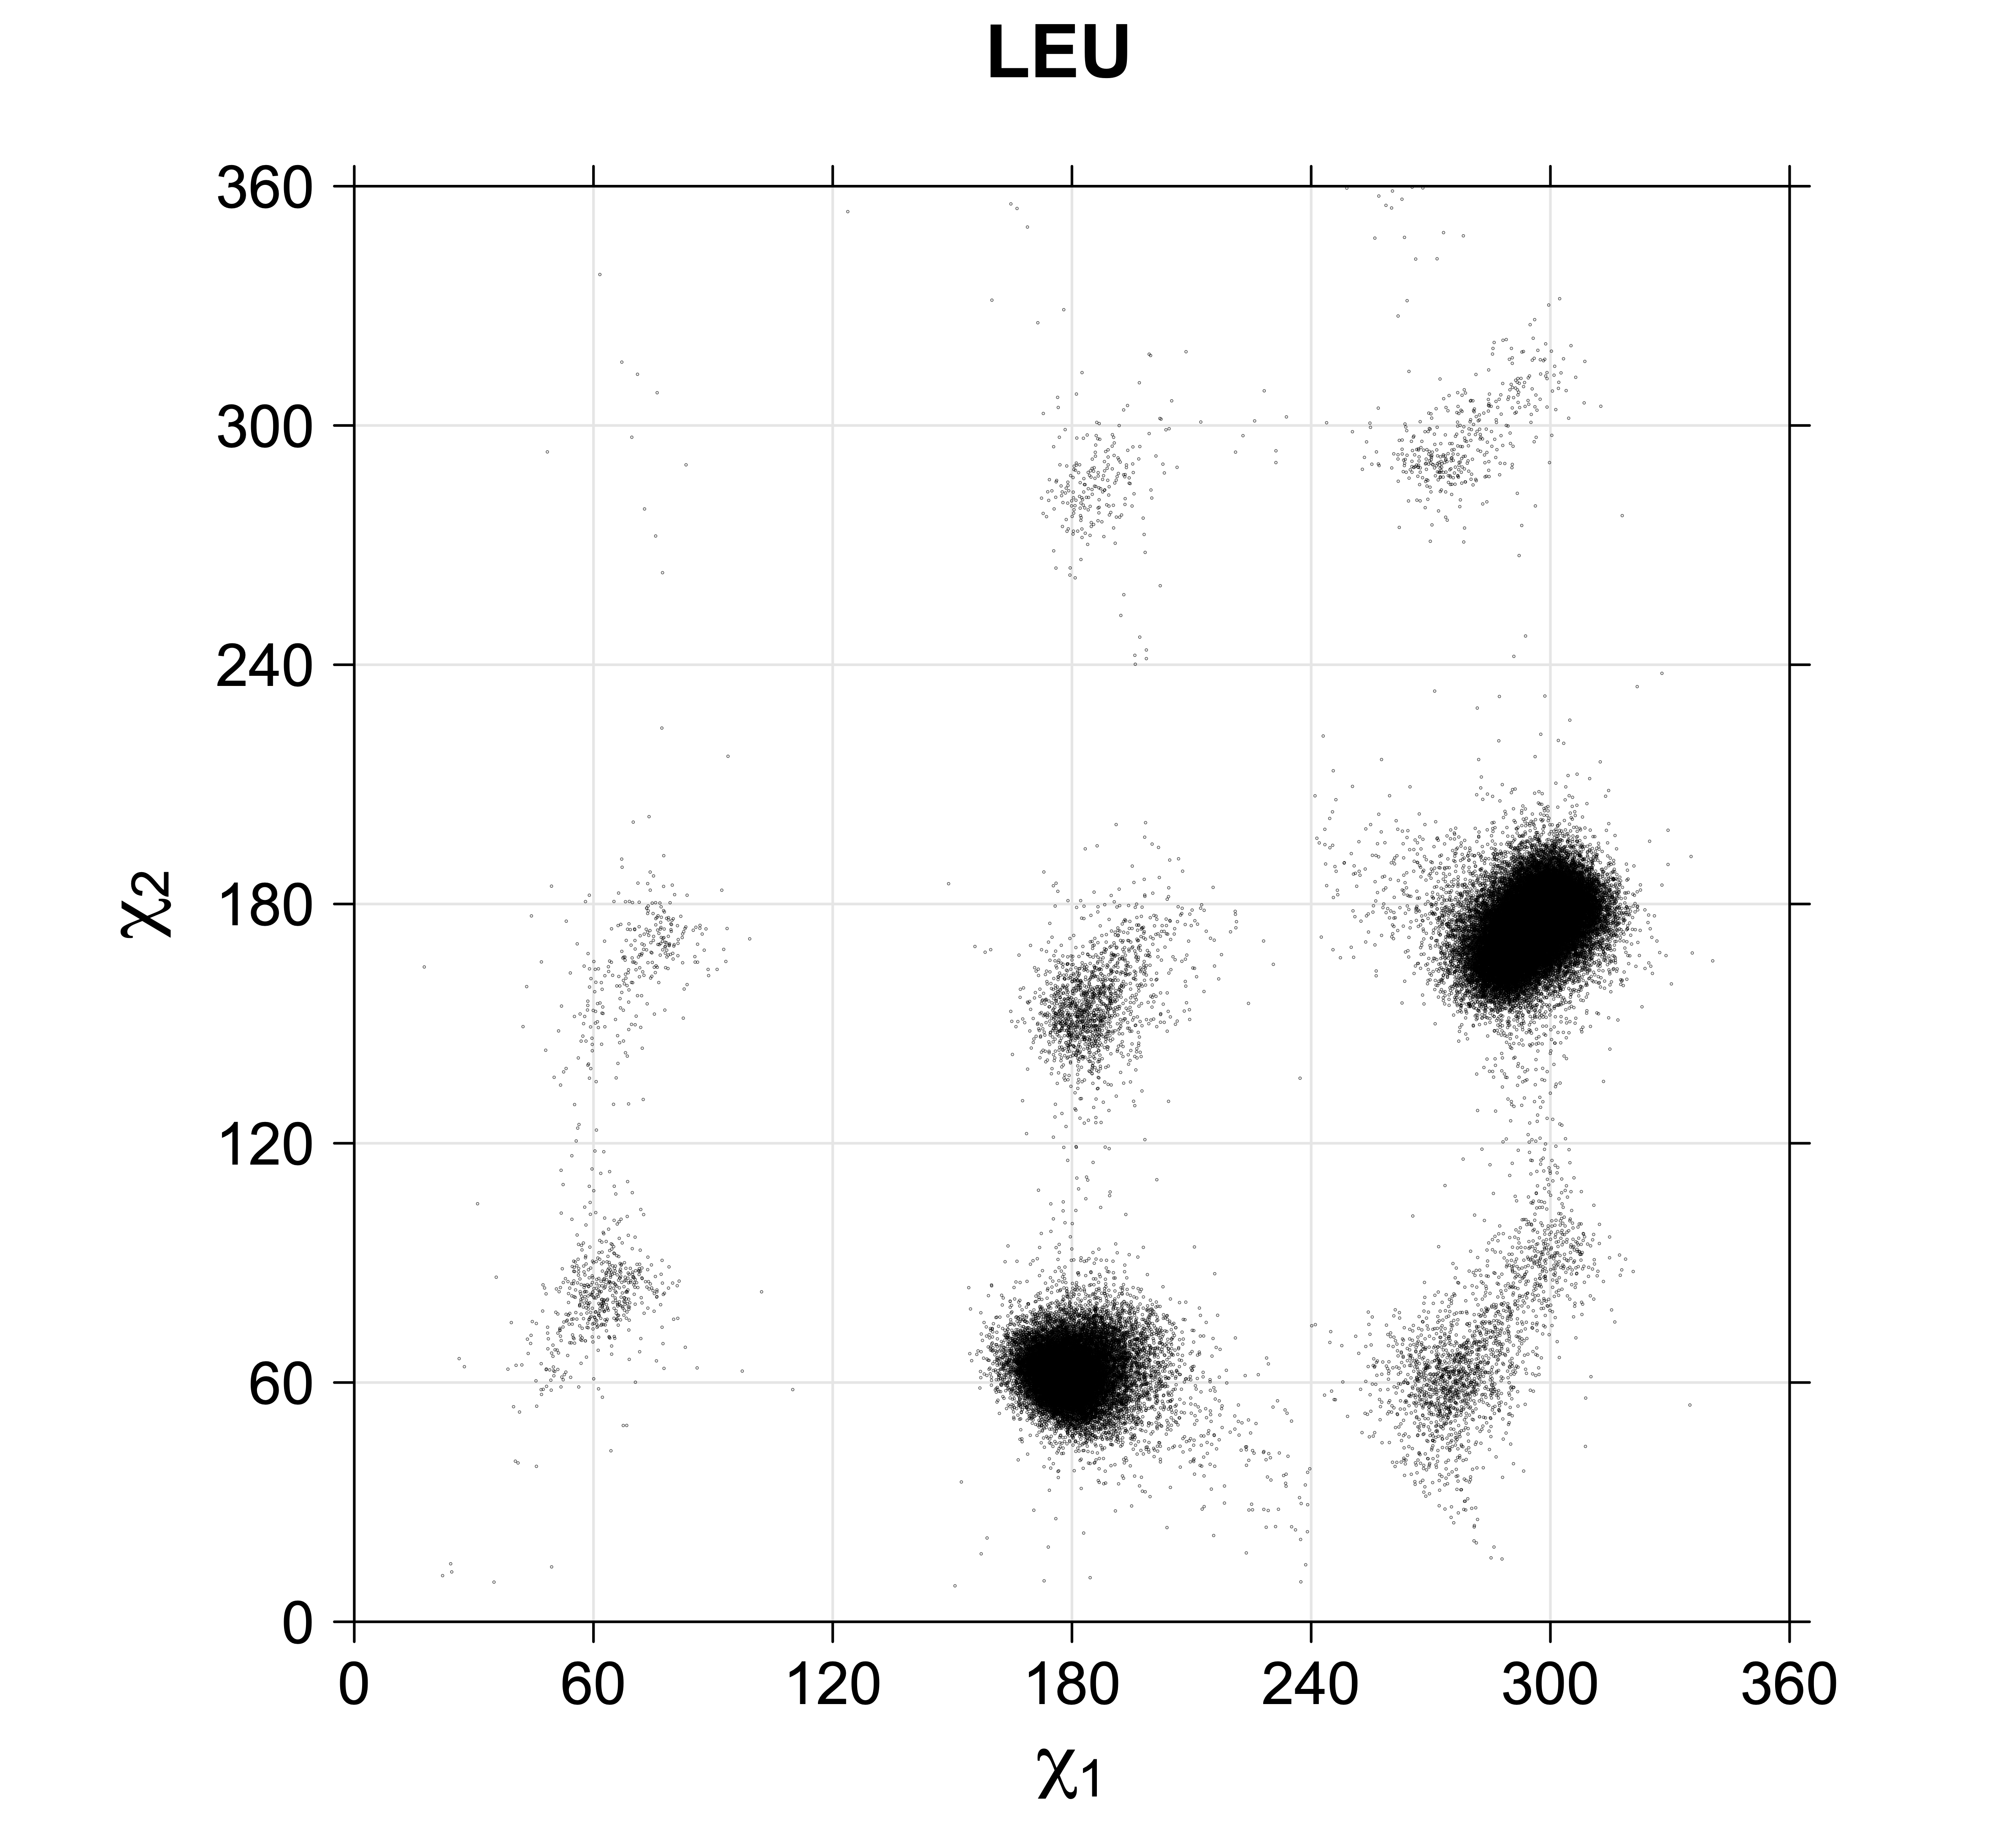
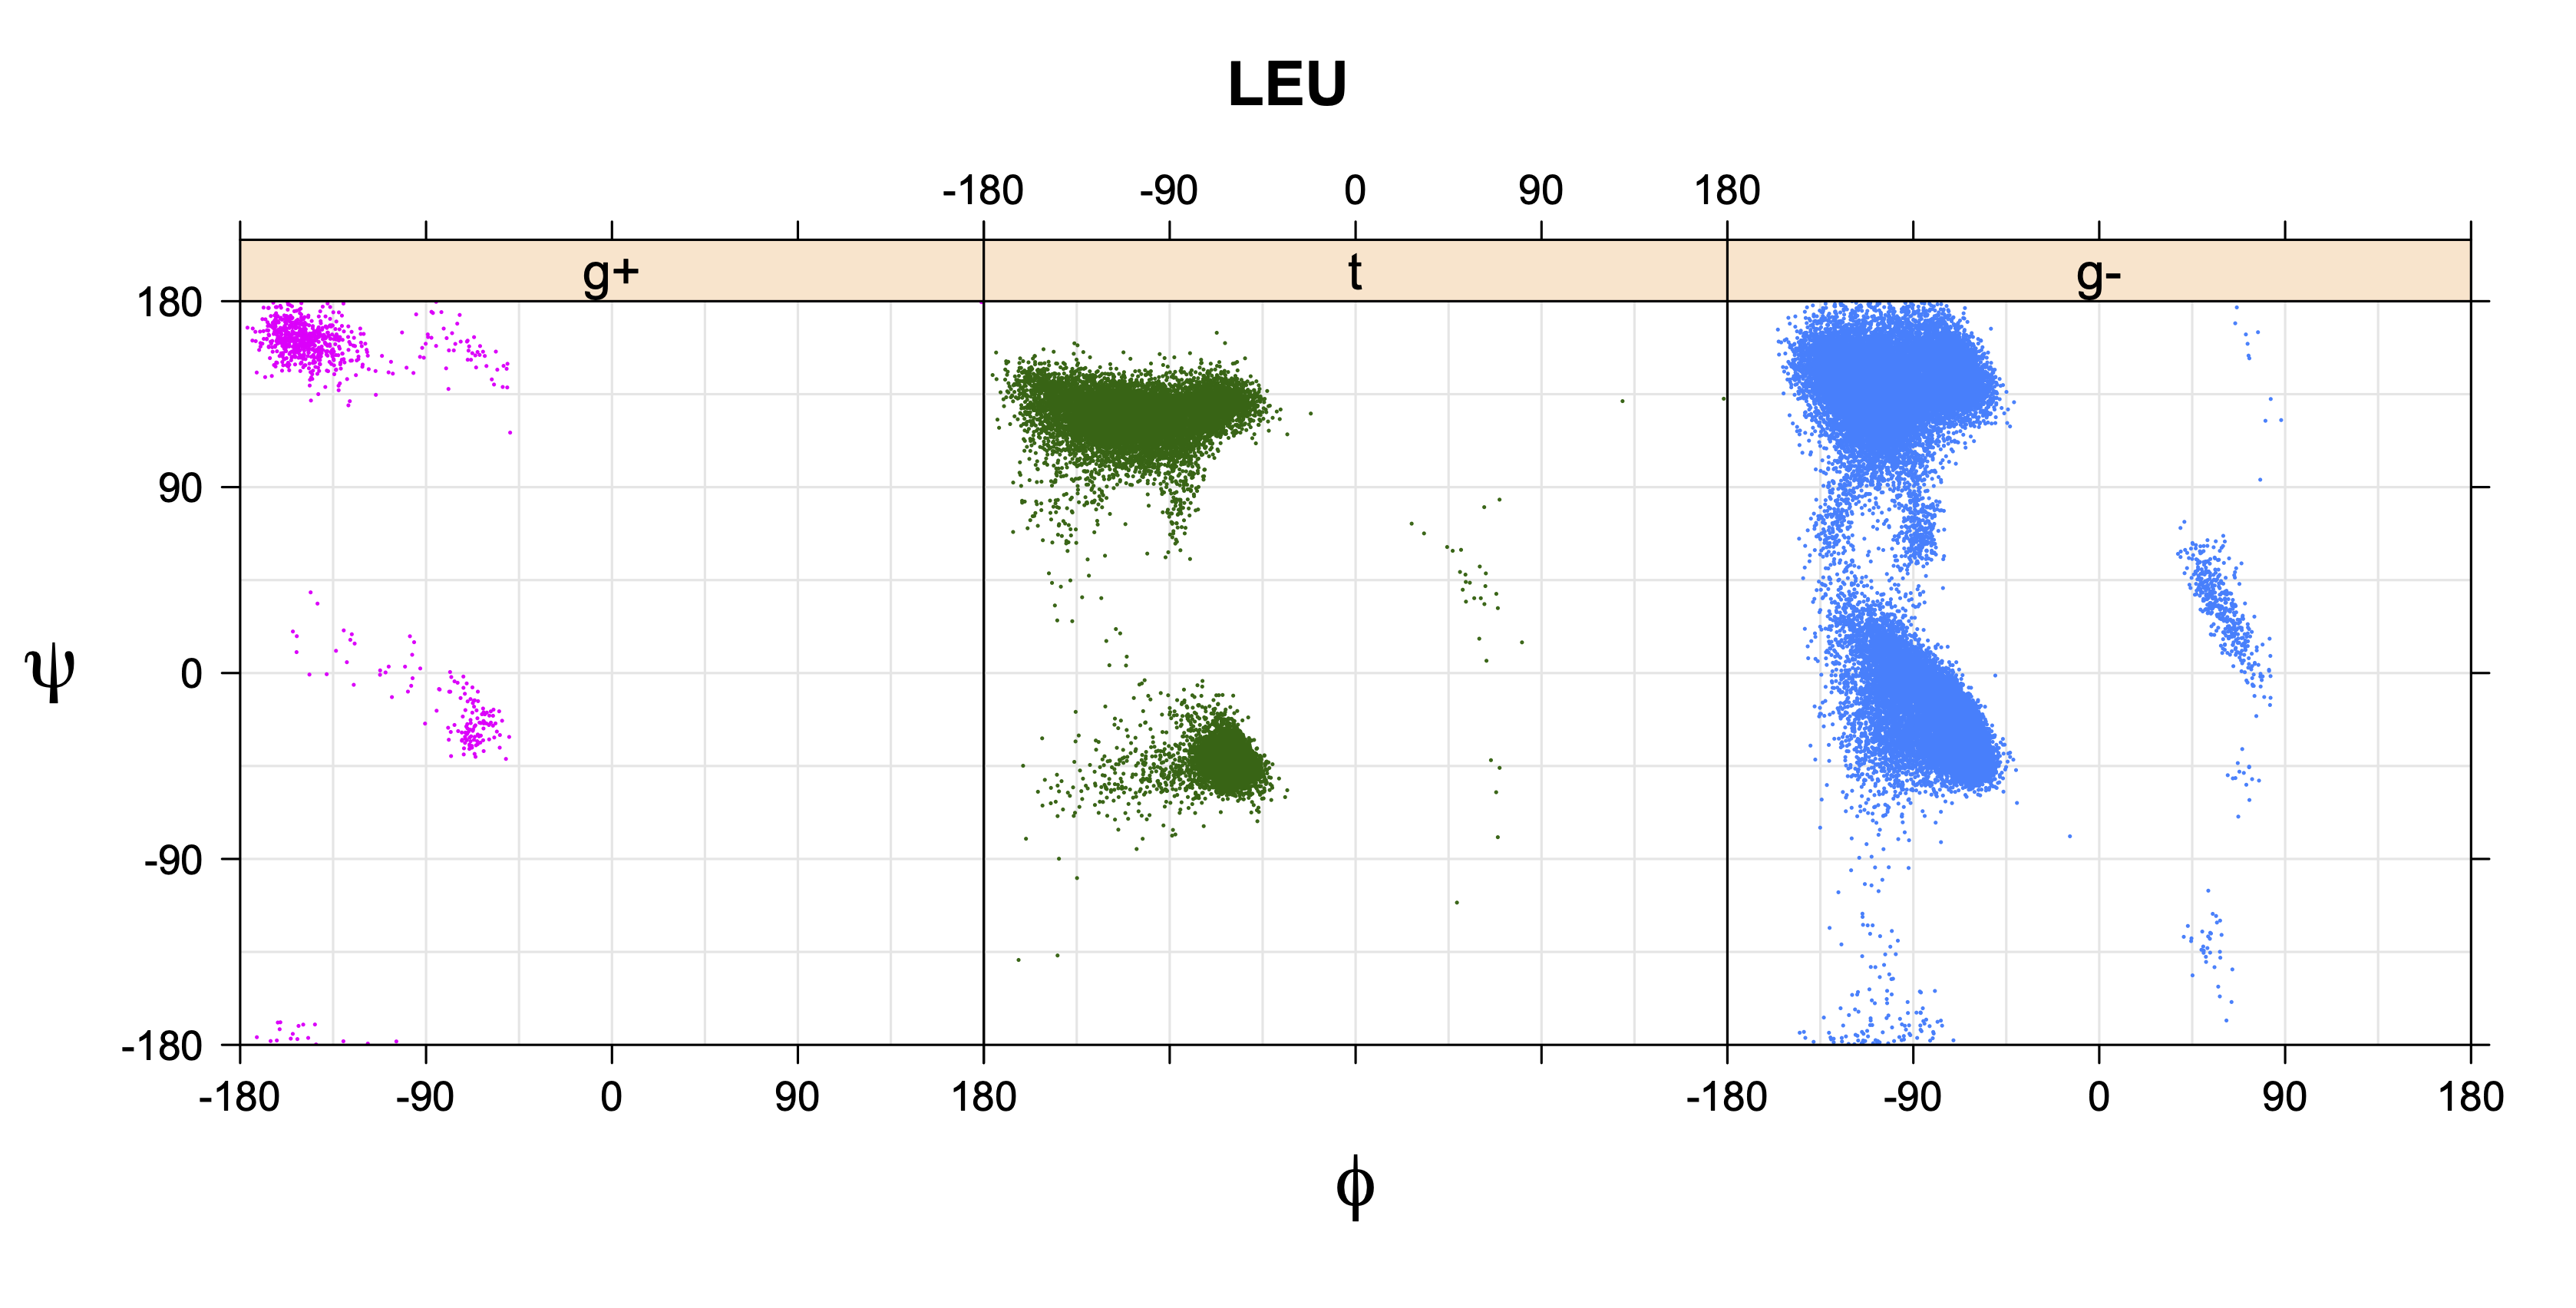
Leu
We expect 8 backbone/CD1 (or CD2) interactions for Leu ( (CD1+CD2) x (N and C) x 2 syn-pentane interactions (+60°,-60° or -60°,+60°) ). Two of these occur for the g+,g- rotamer.
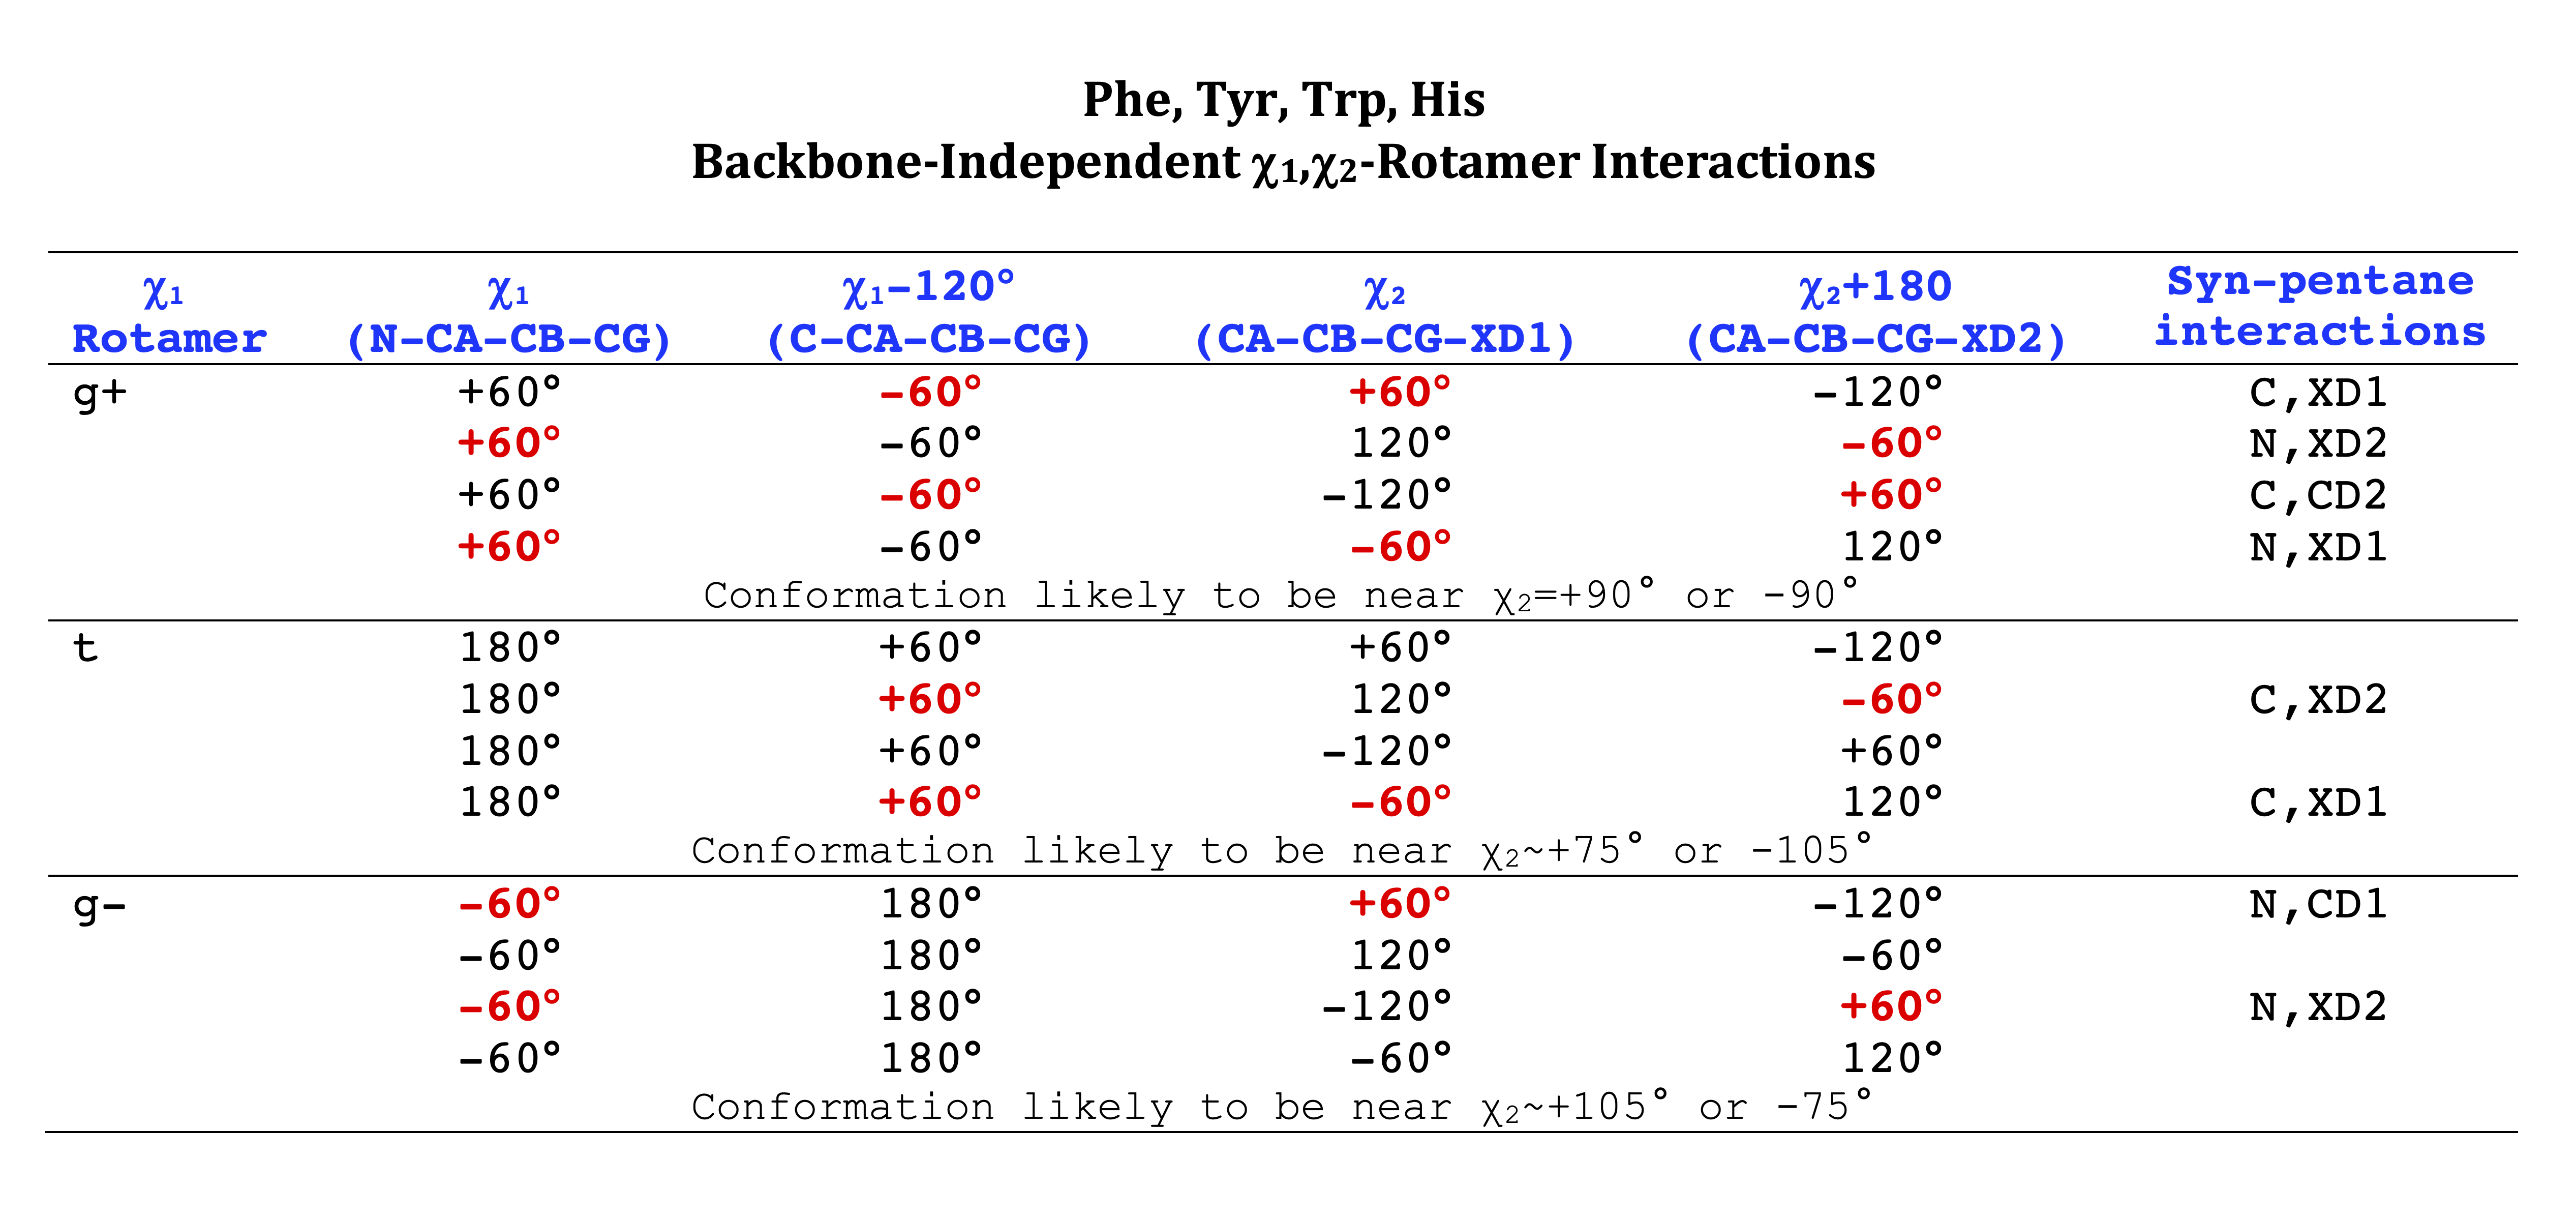
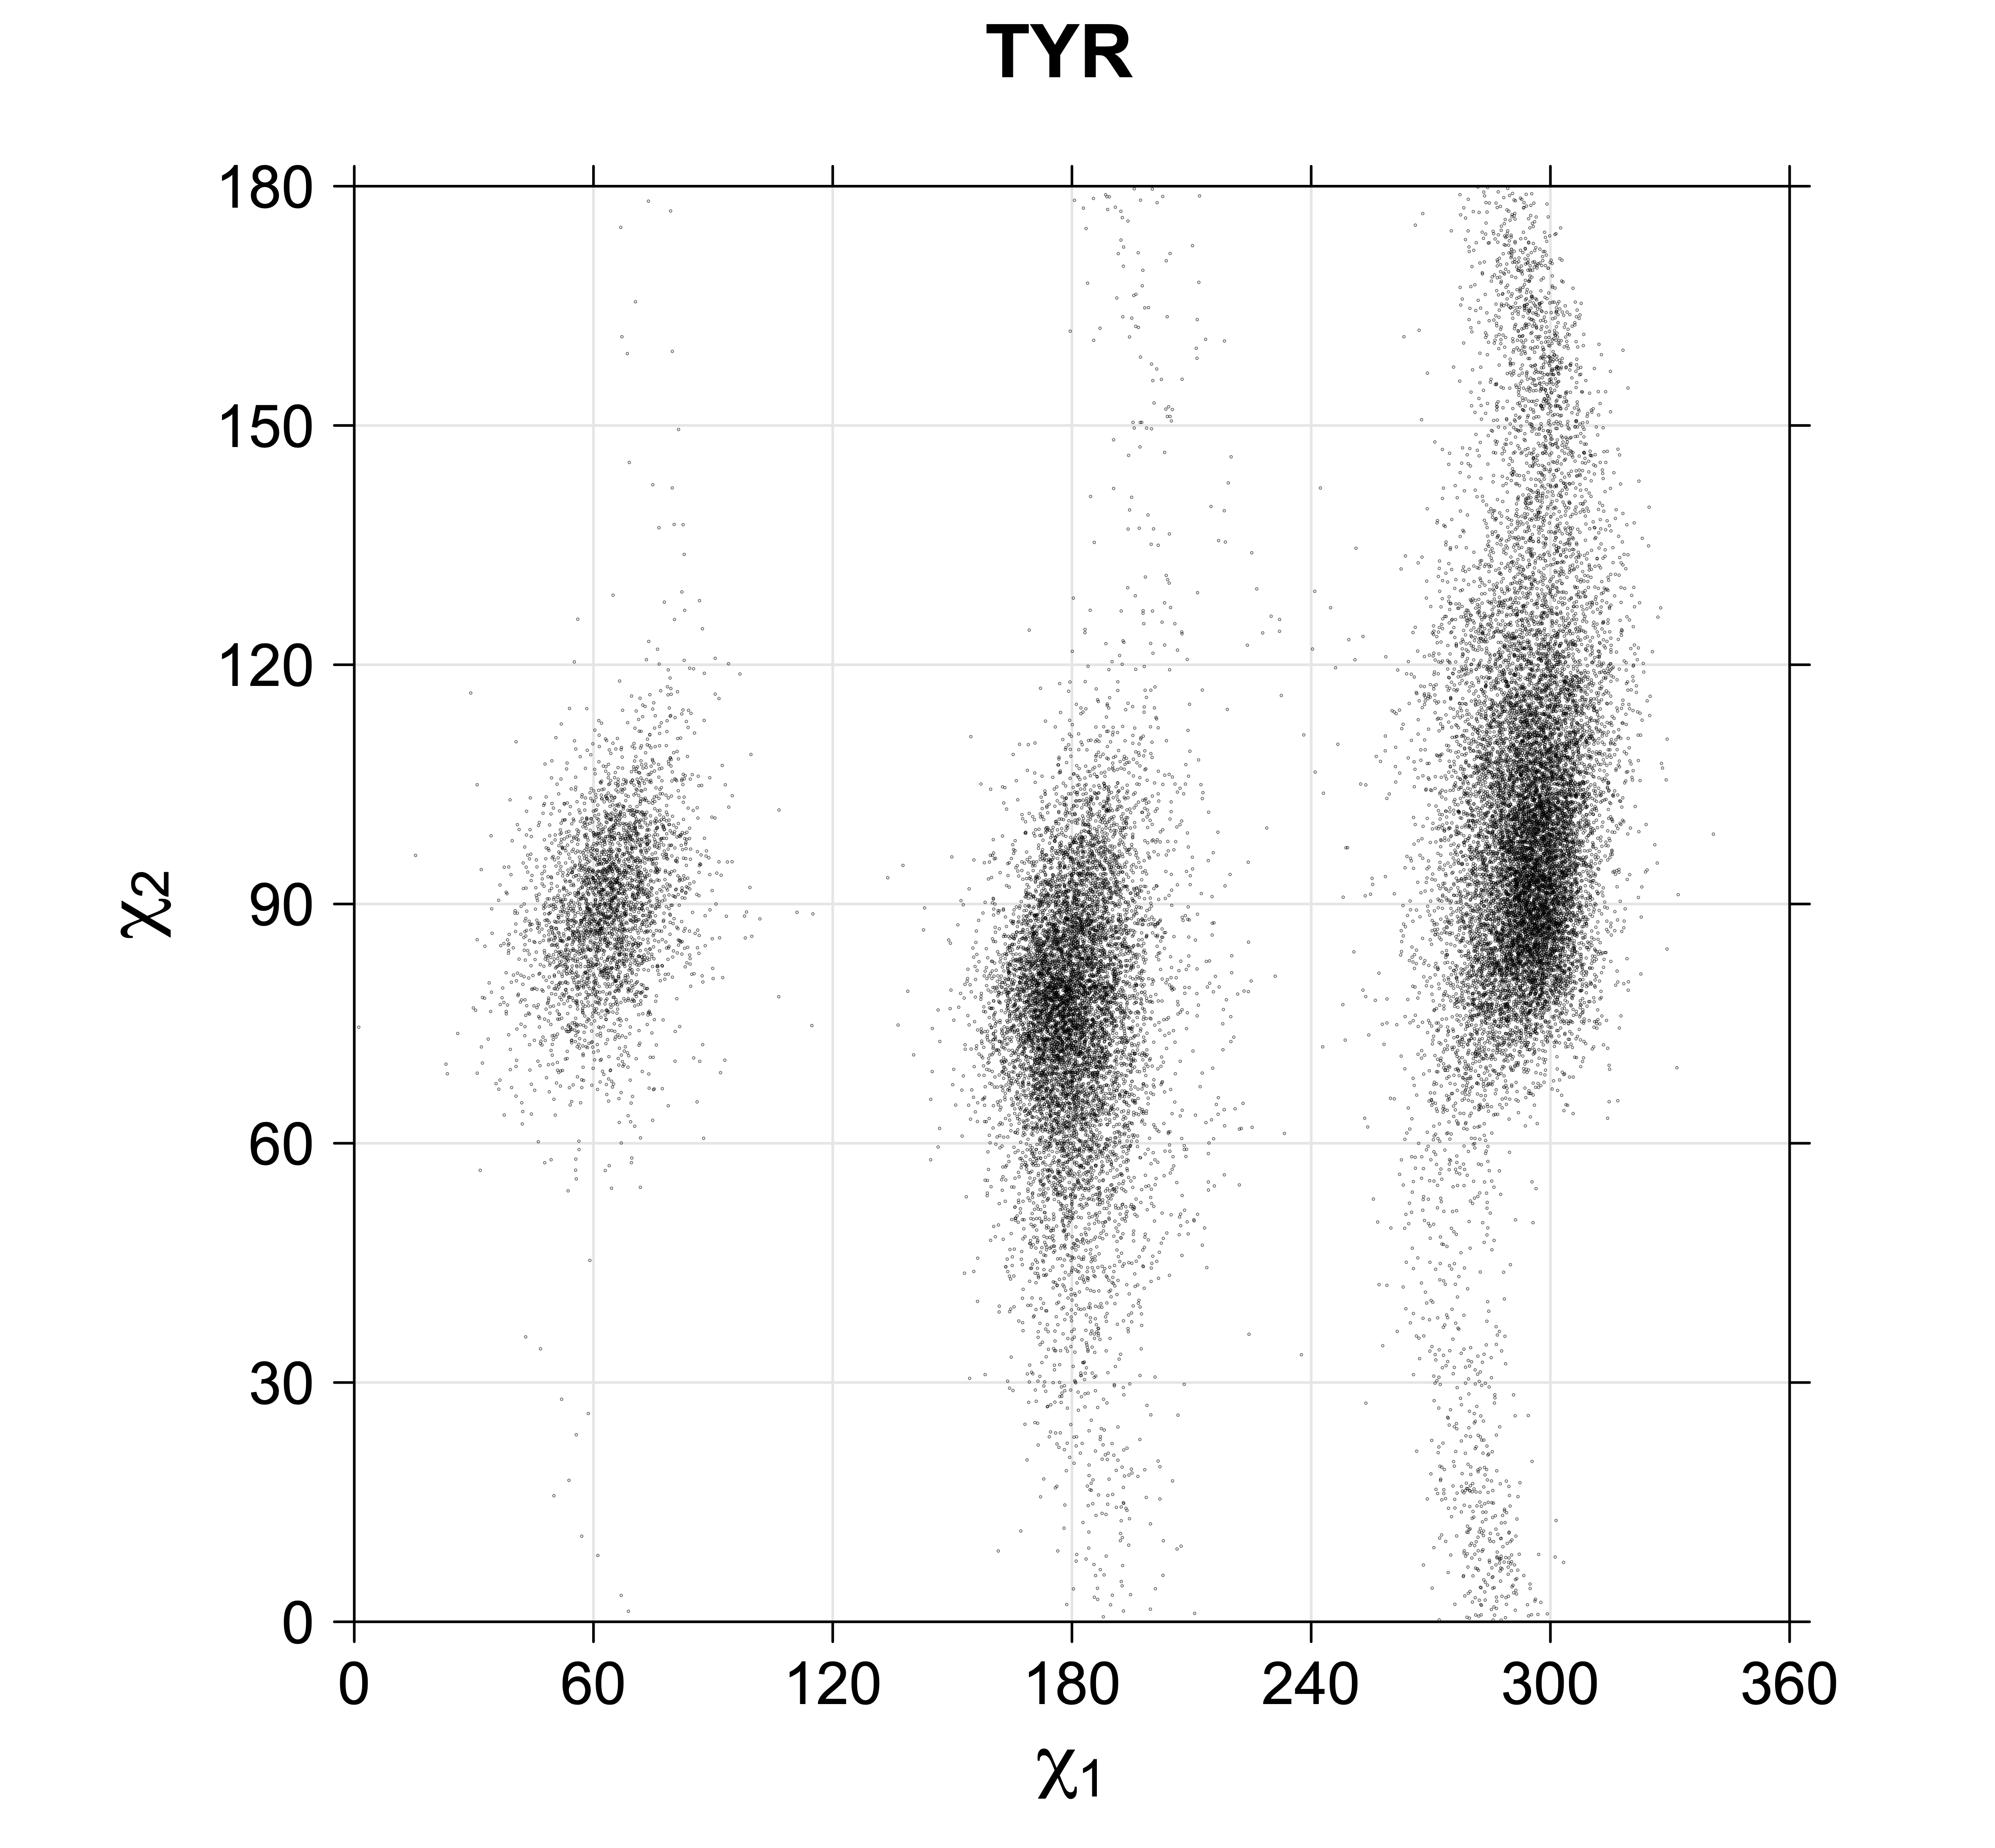
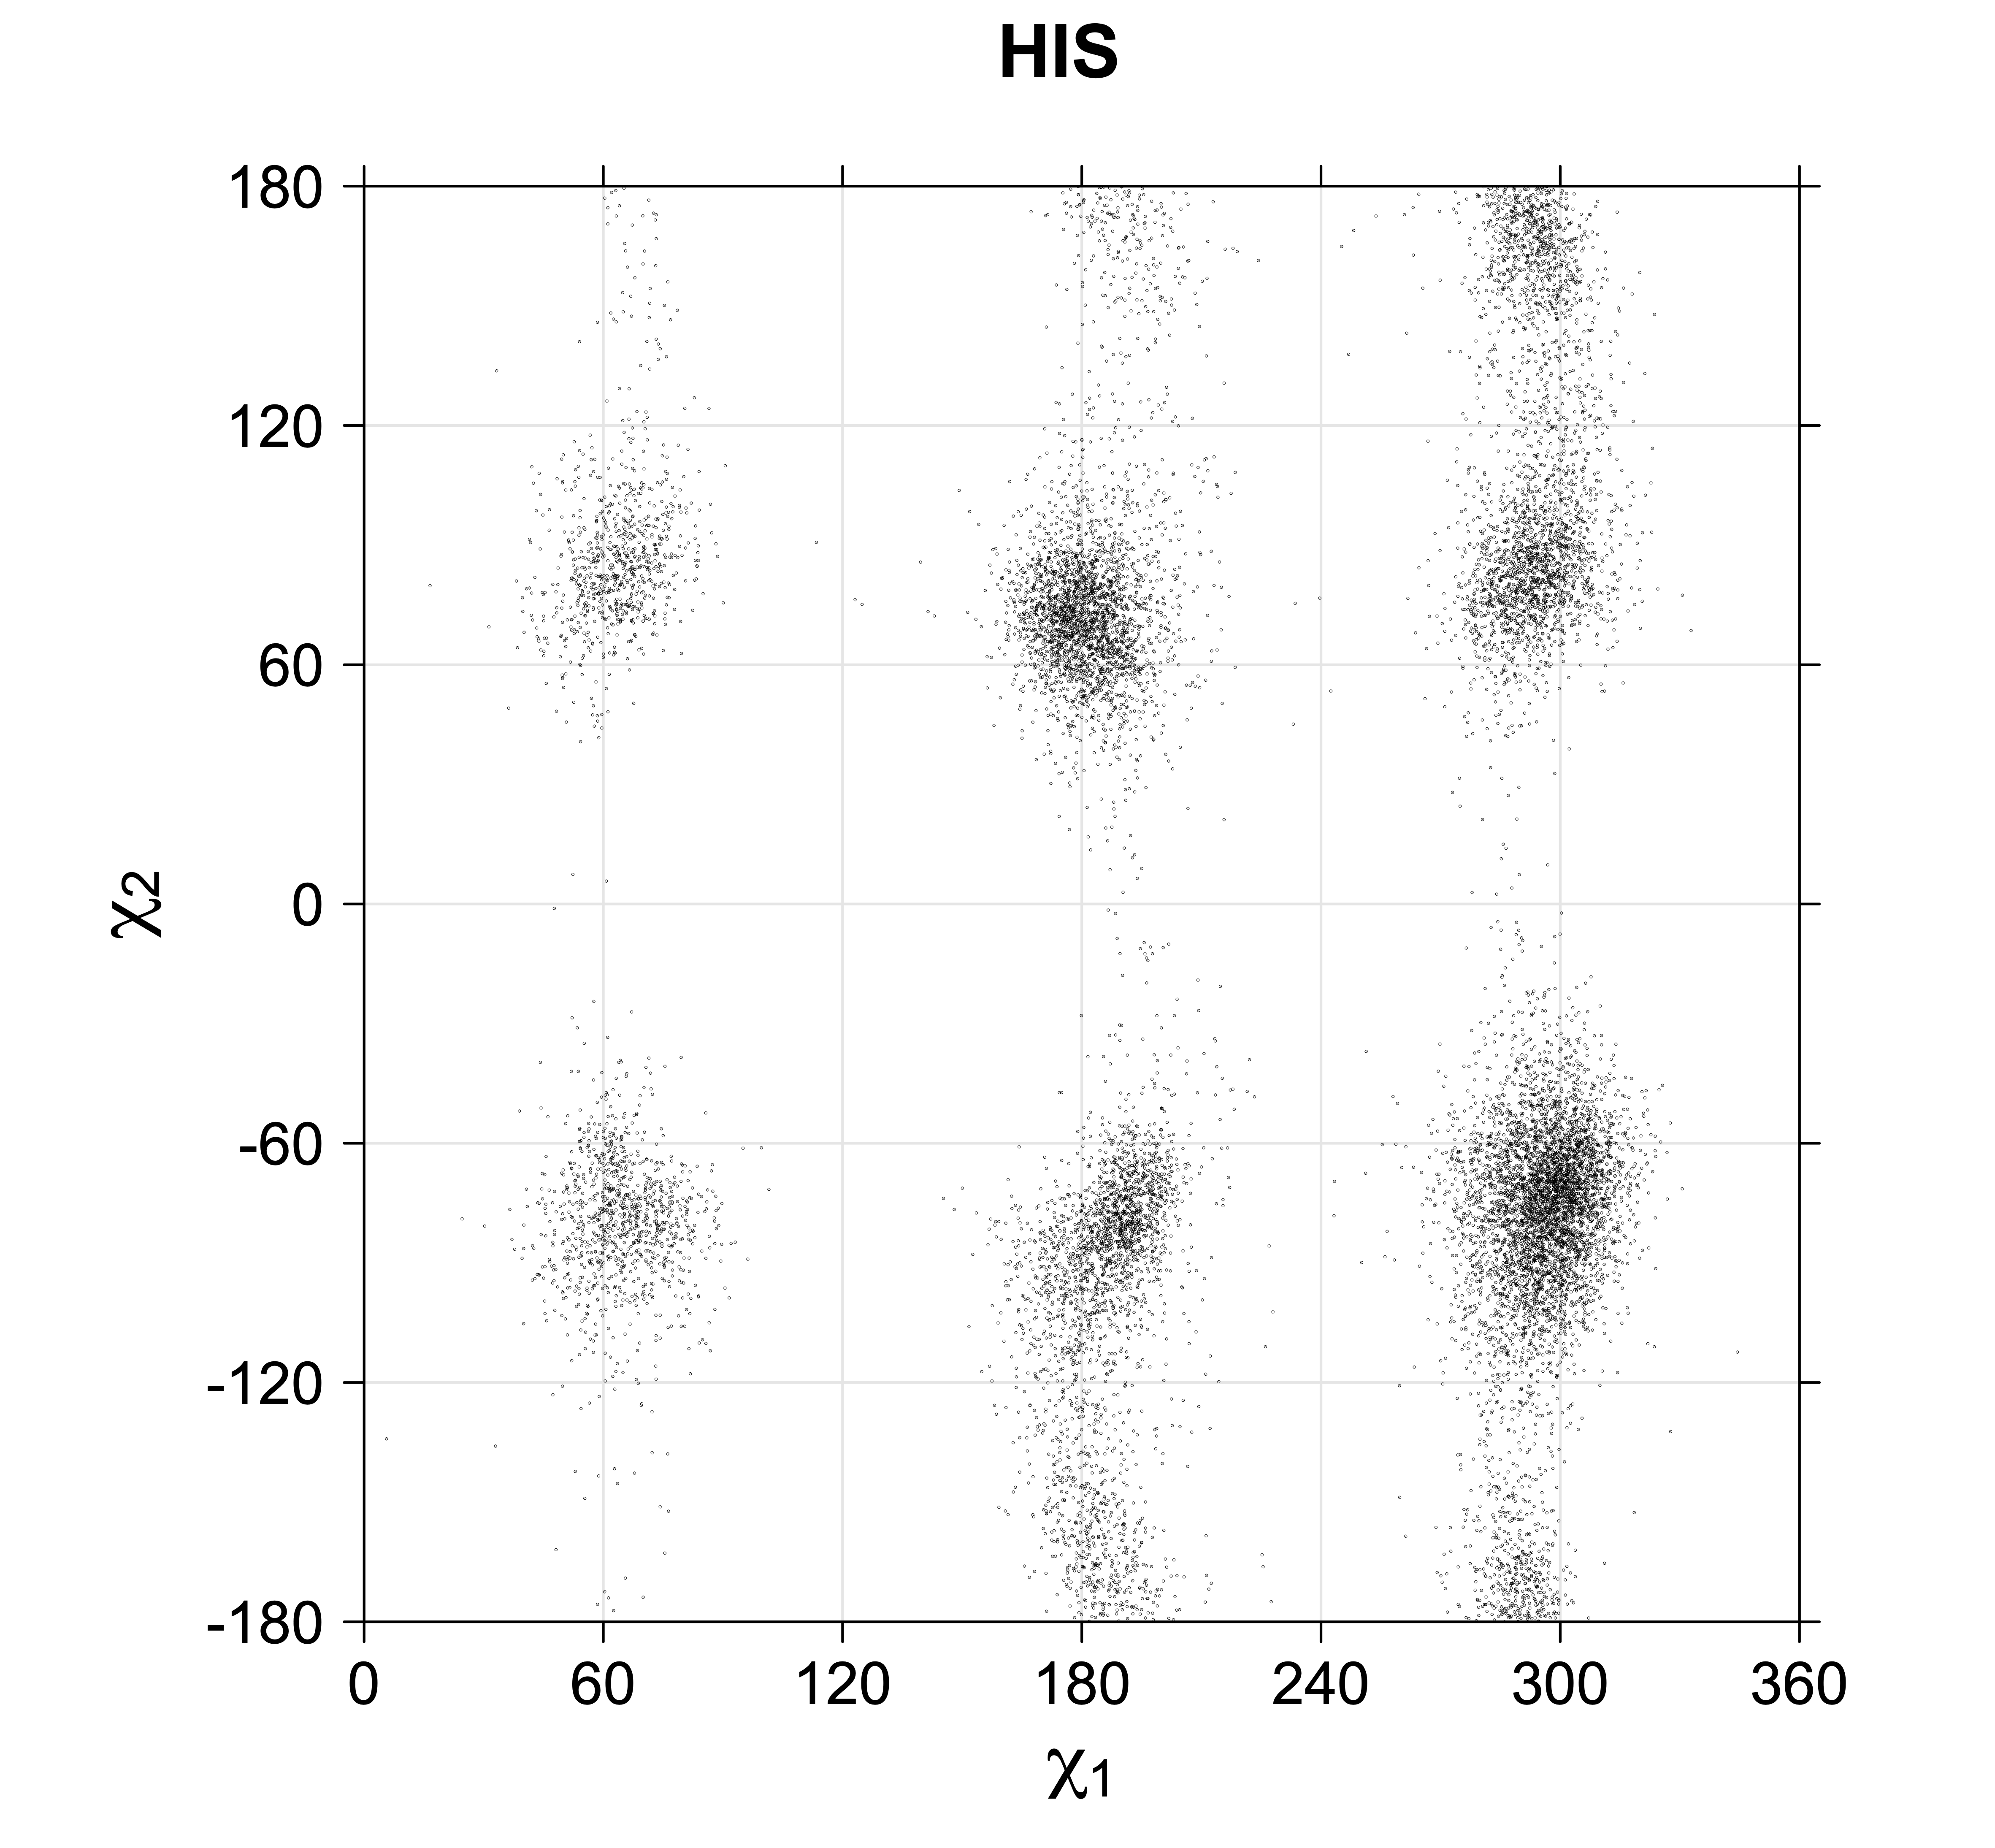
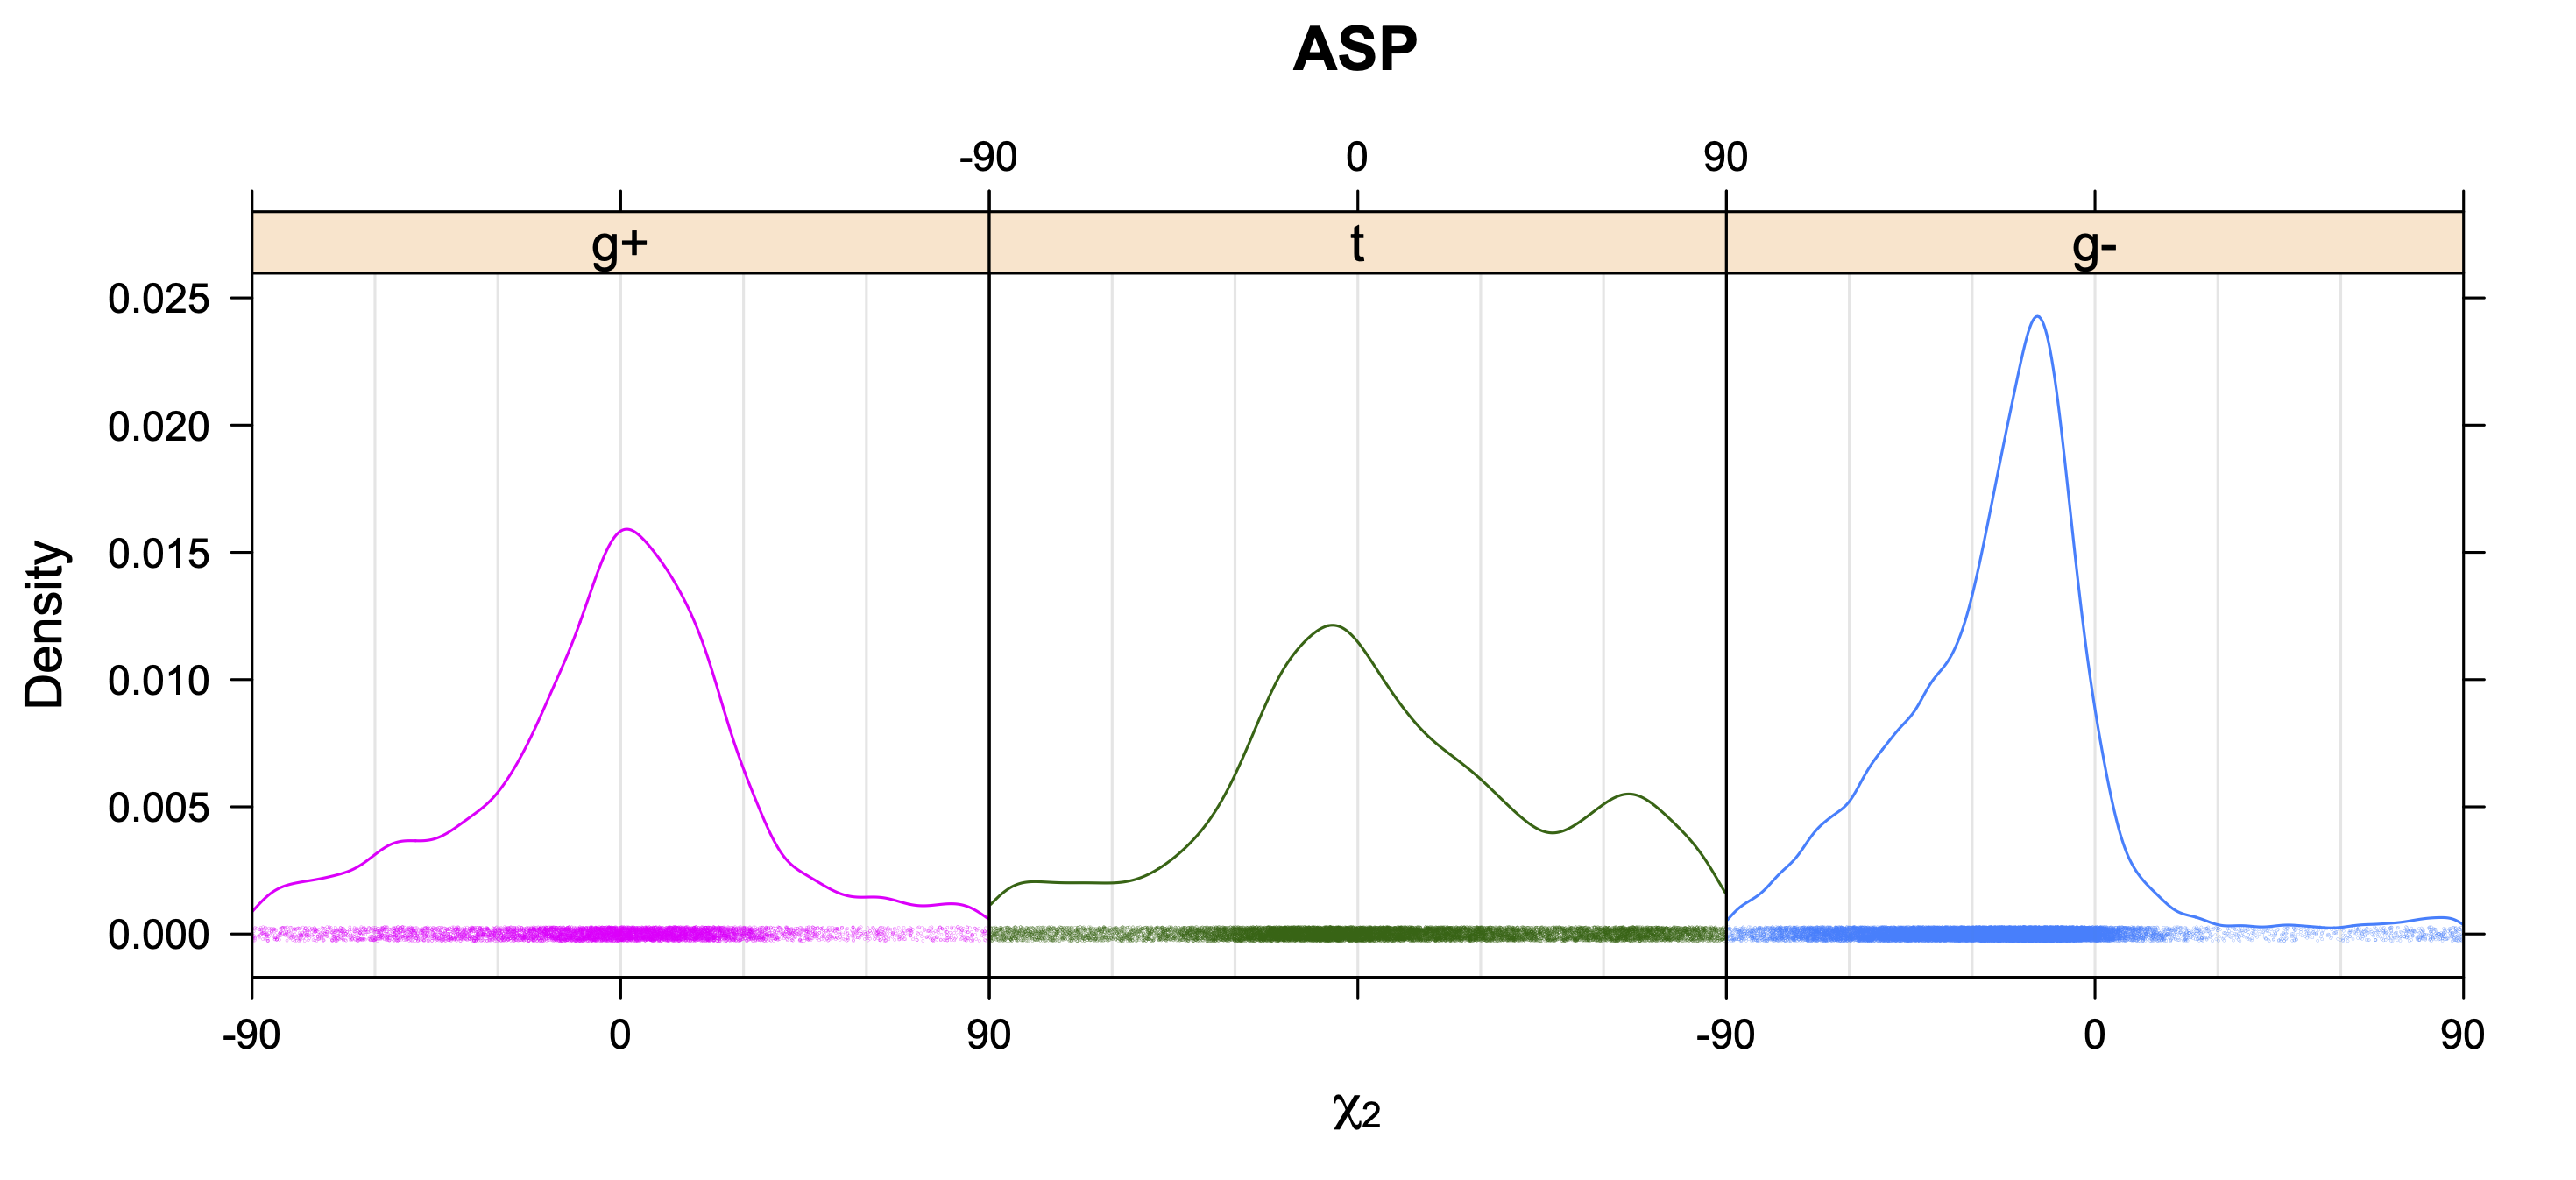
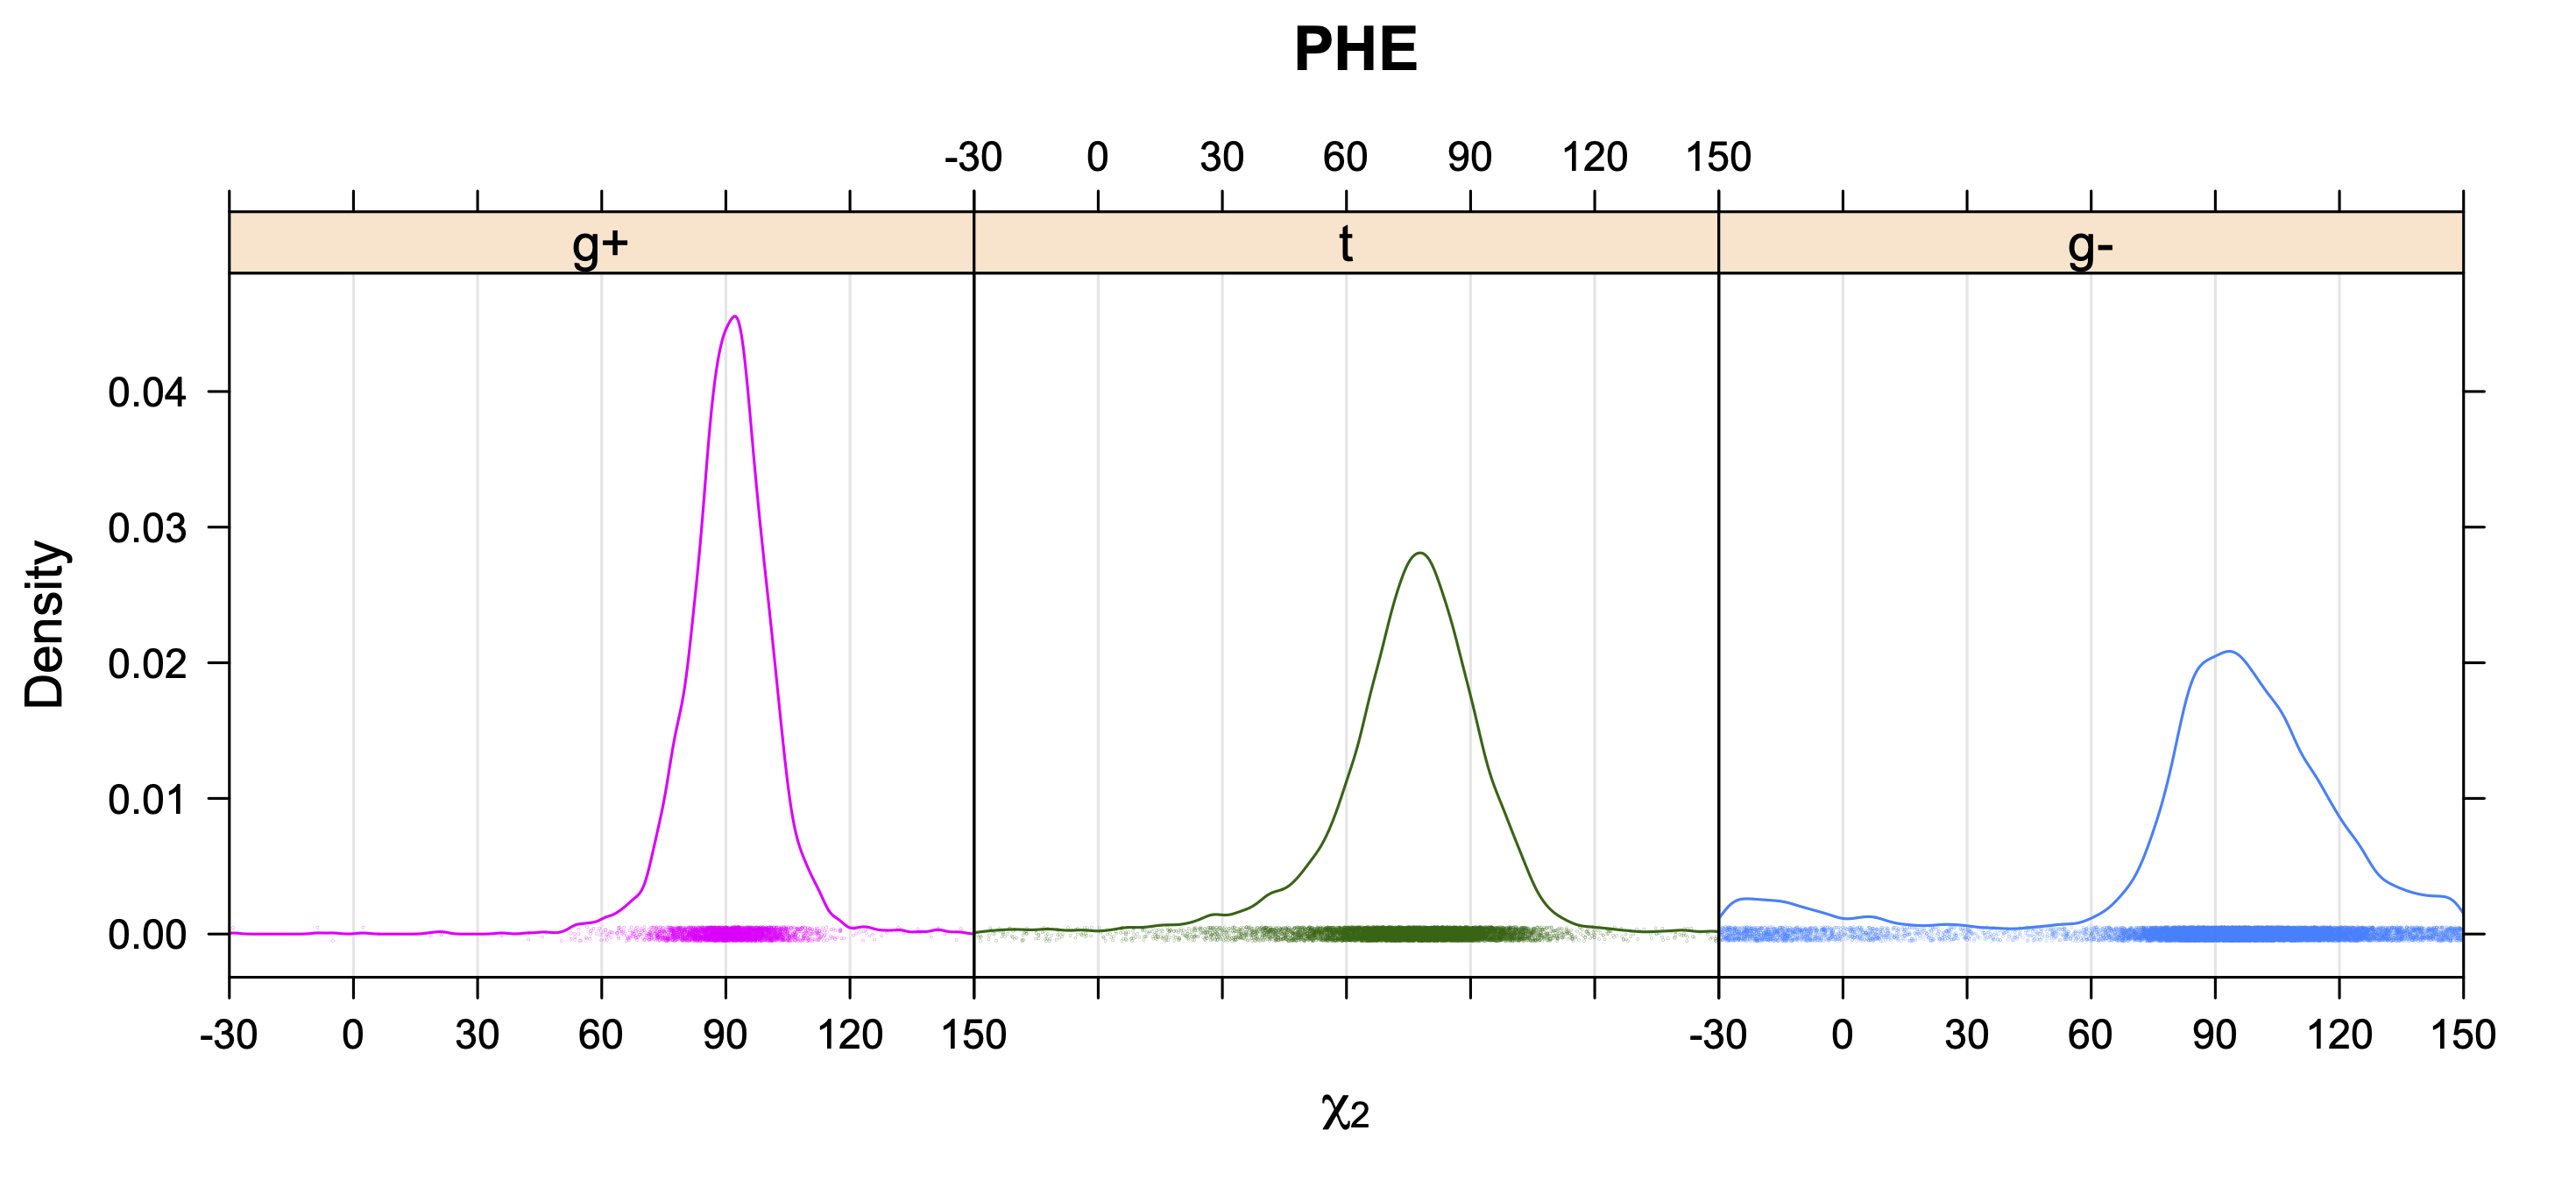
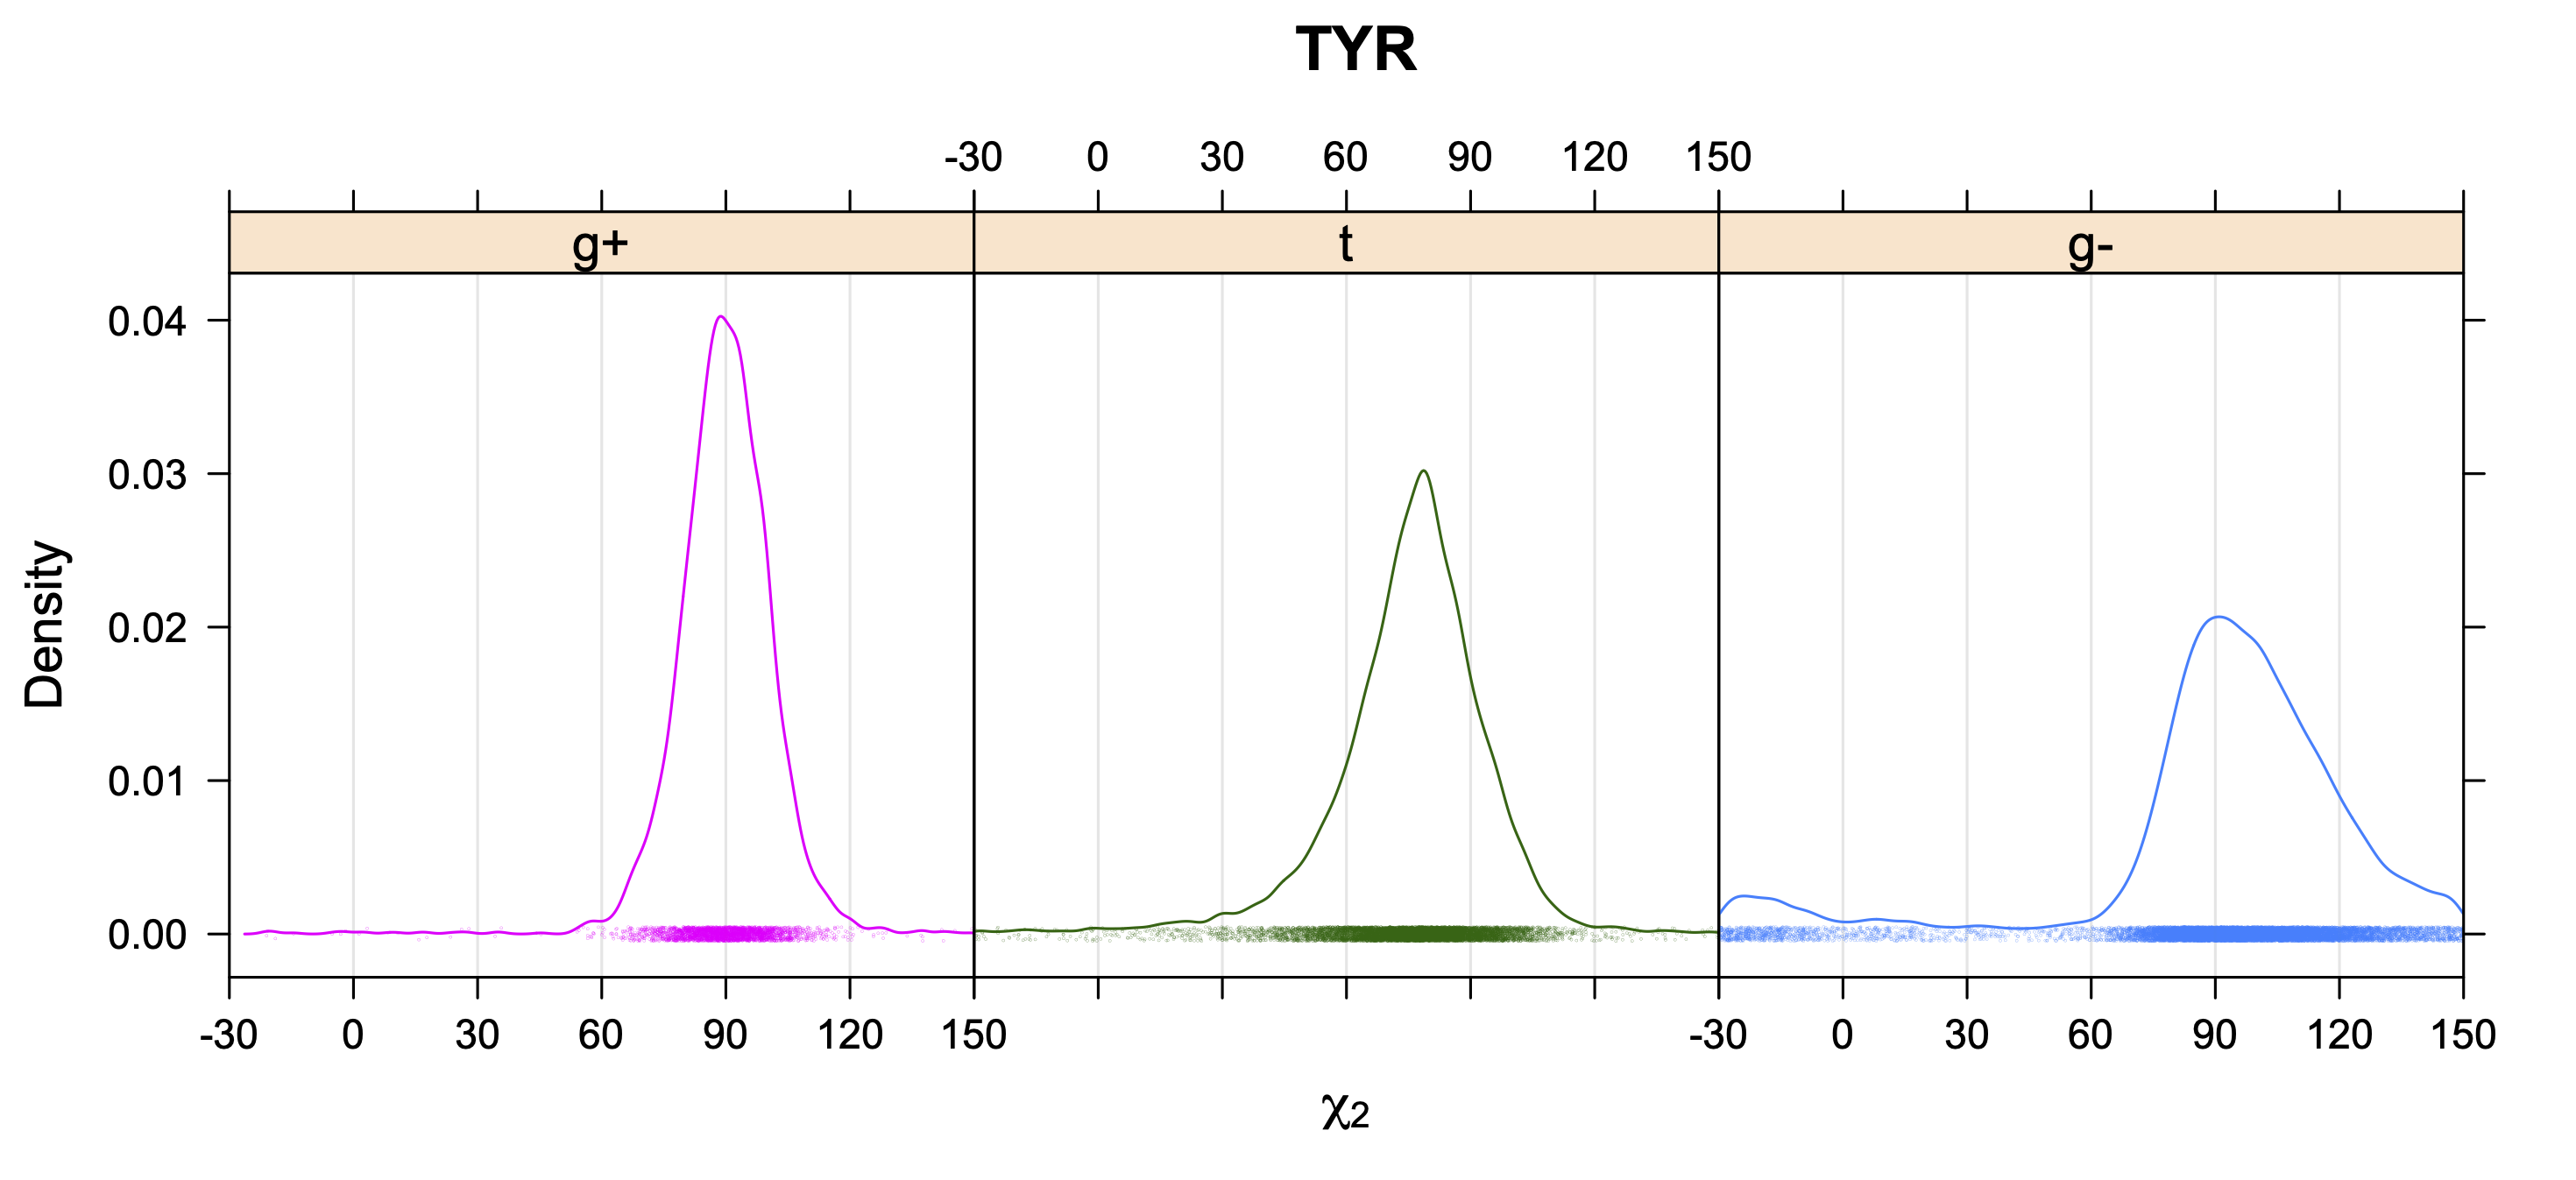
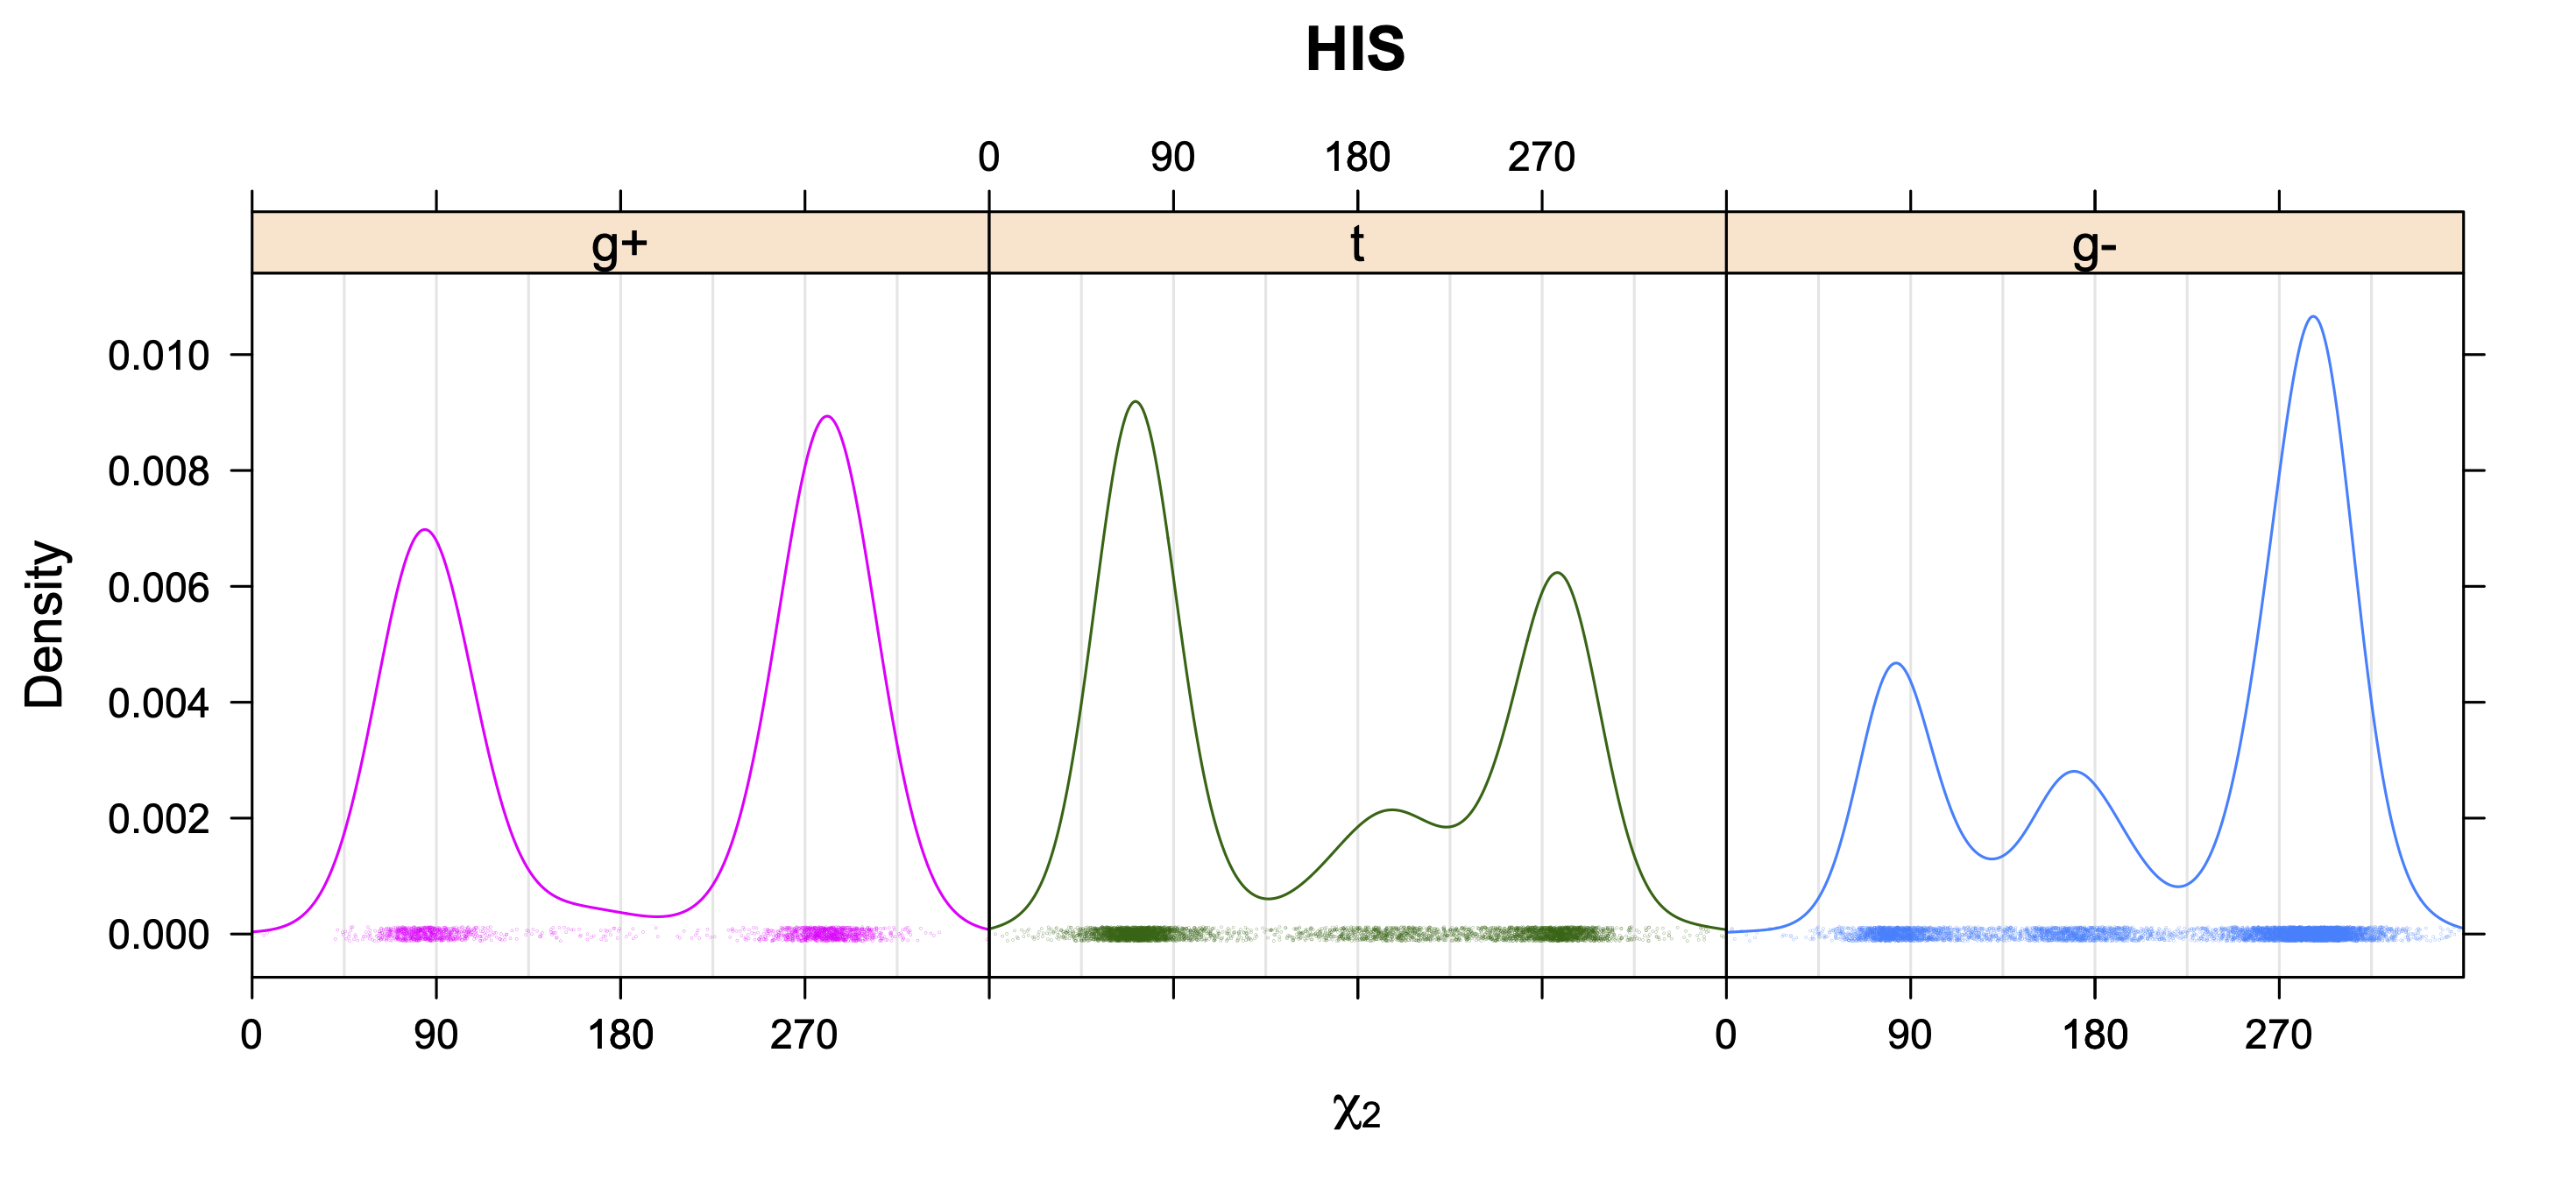
Phe, Tyr, His, Trp
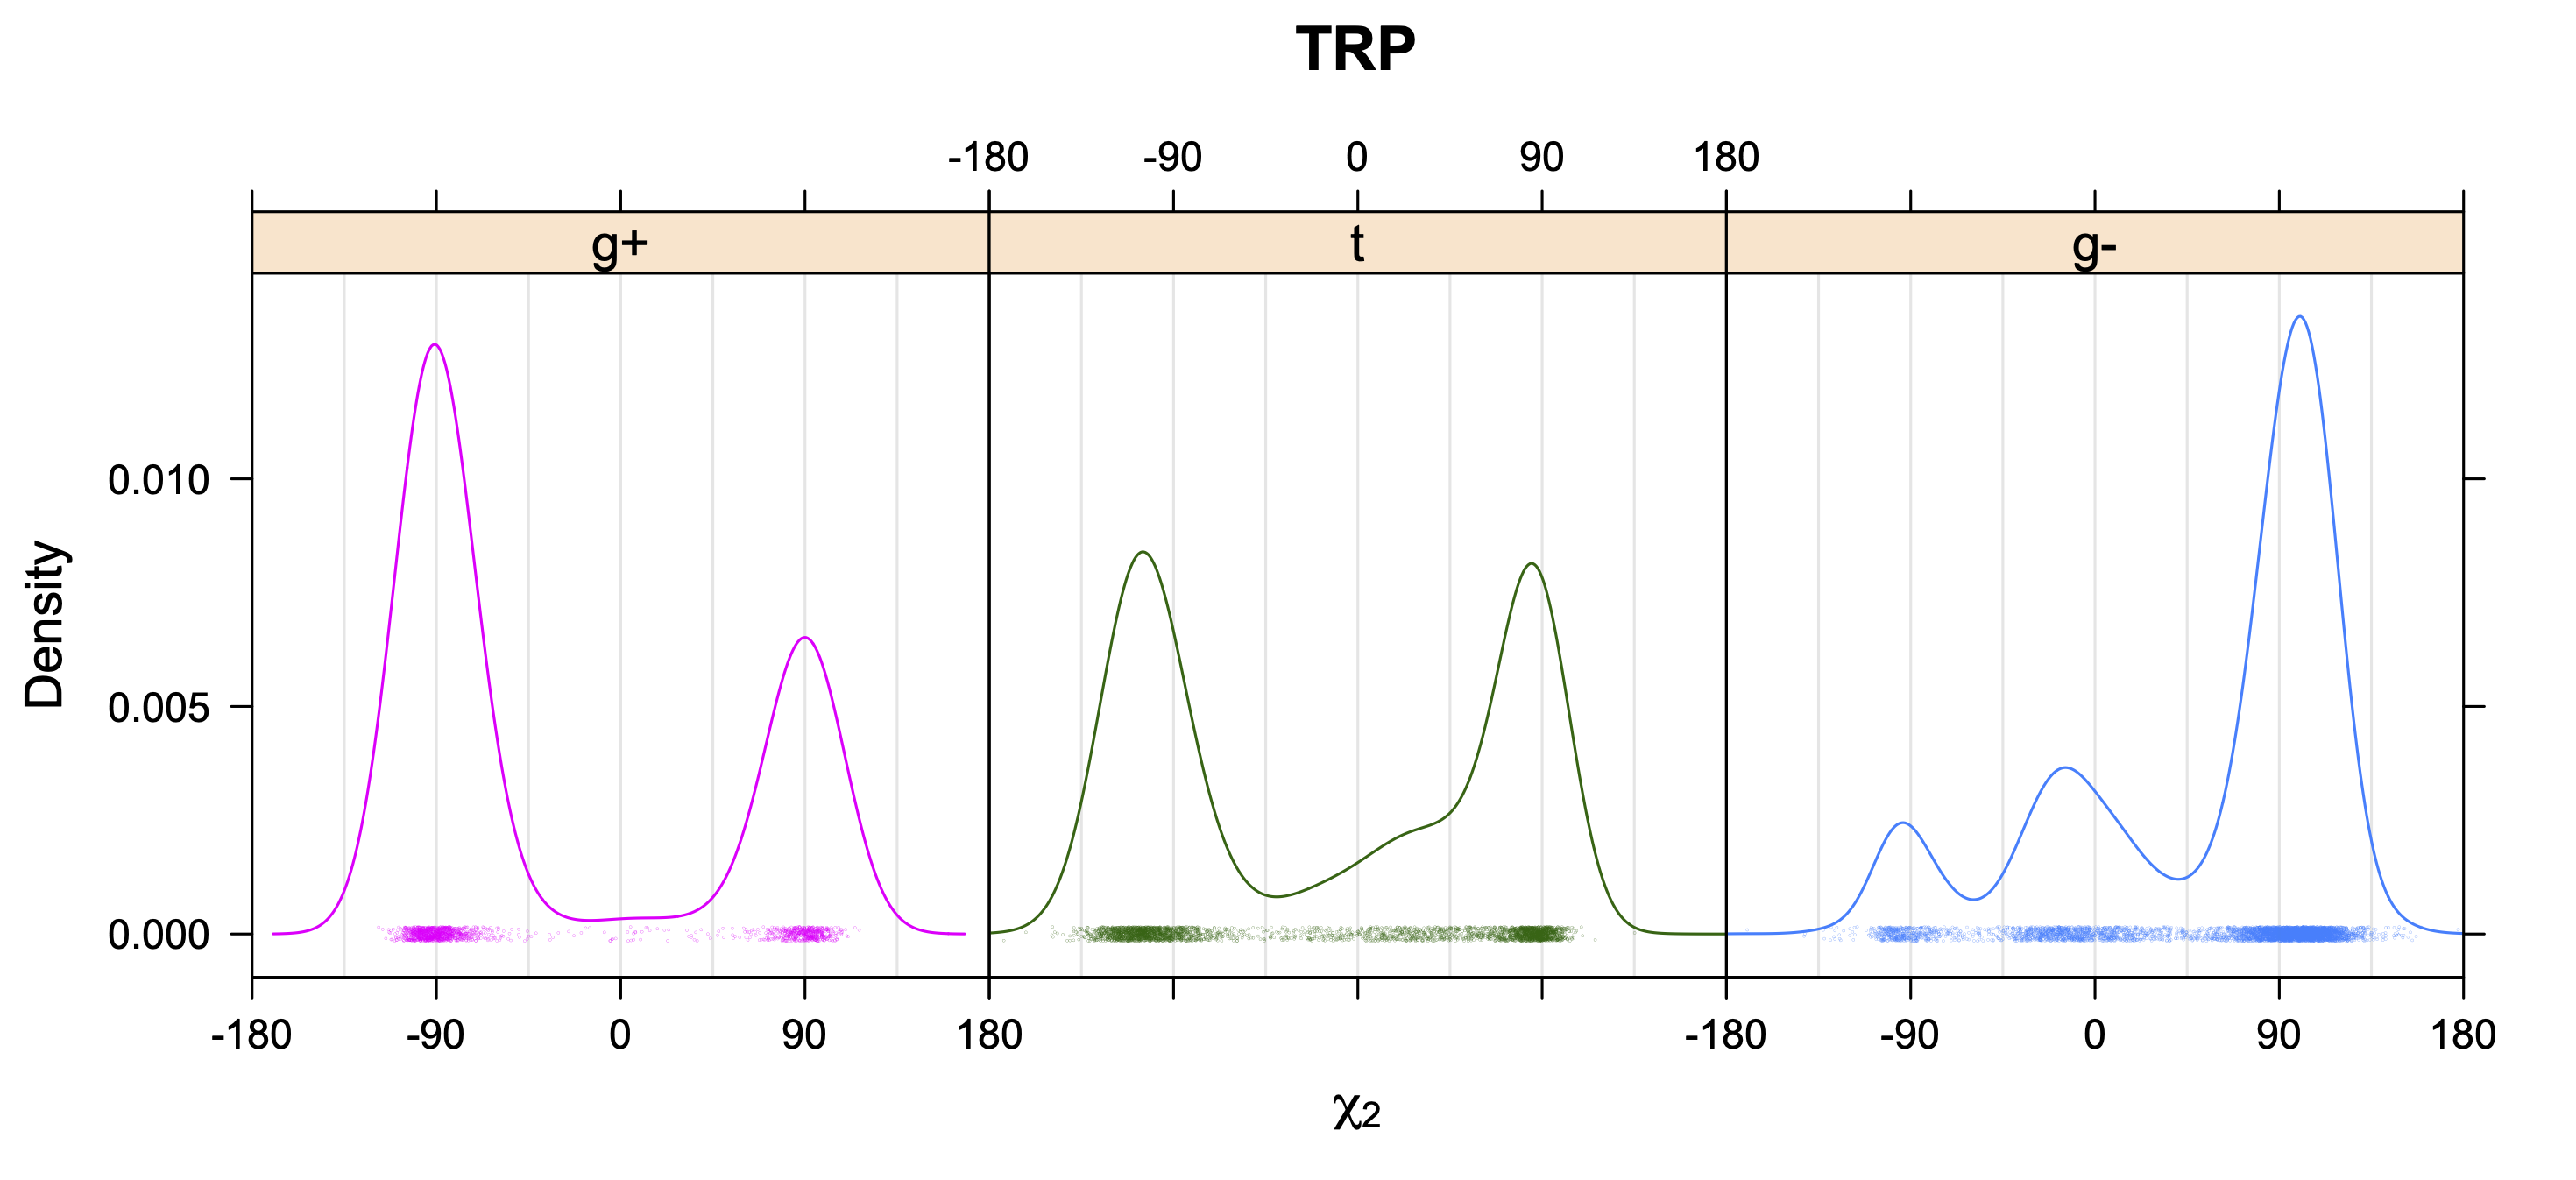
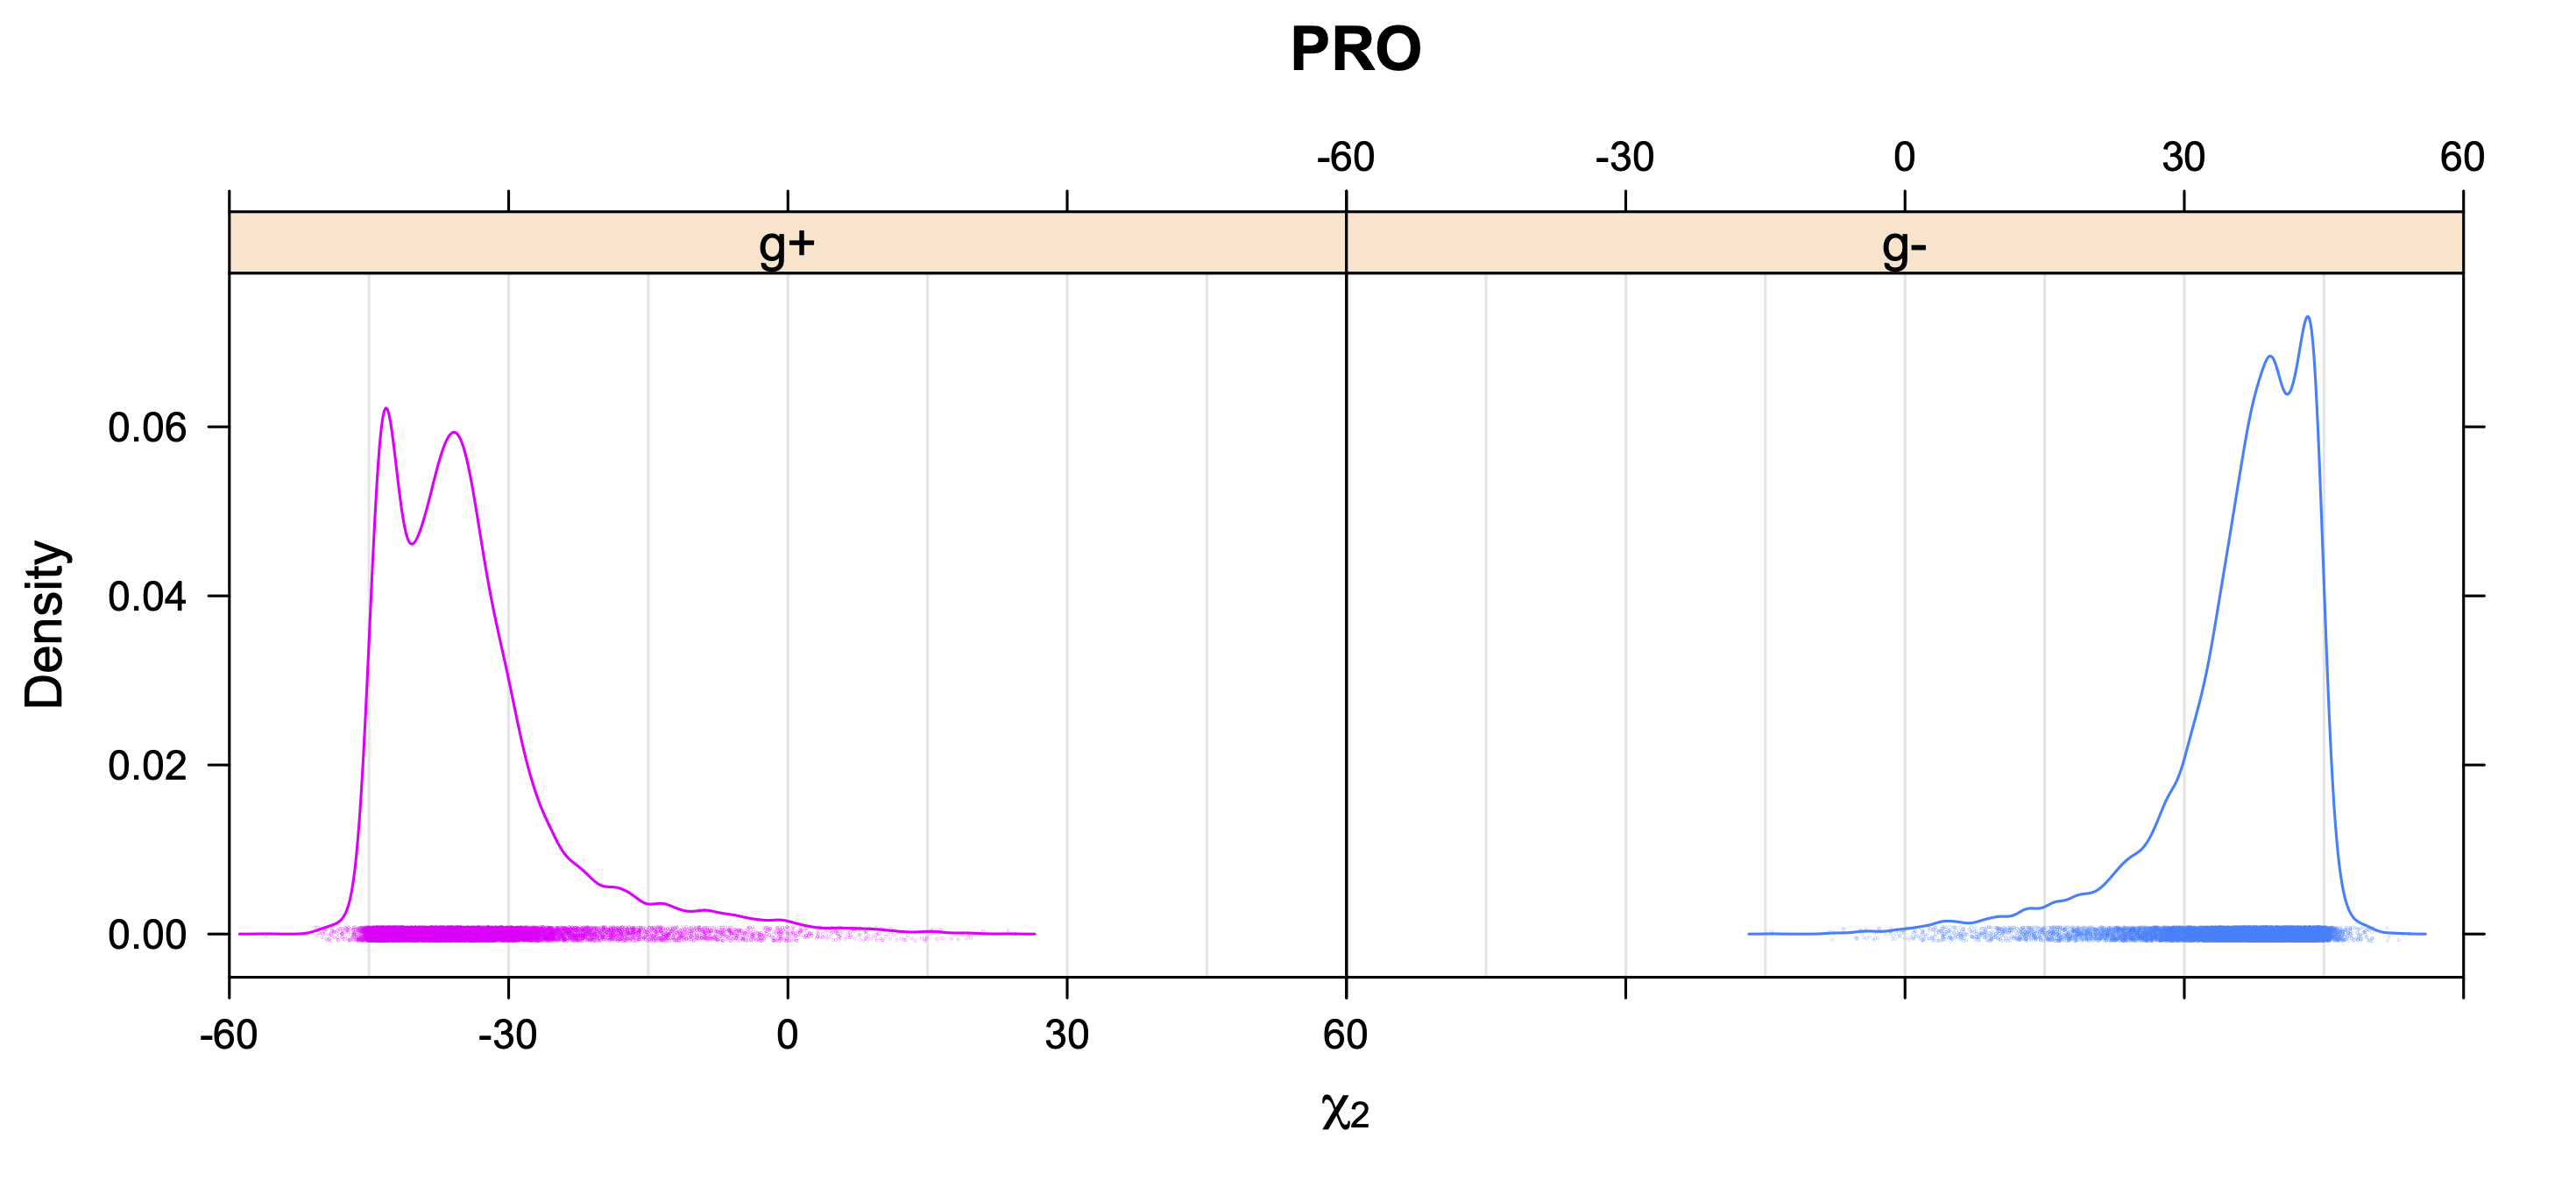
Aromatic side-chain χ2's are perturbed by interaction between XD1 and XD2 and backbone N and C. Without perturbation, χ2 would be near +90° or -90°. When r1 is trans, interaction between backbone N and XD2 and XD1 at χ2=120° or -60° pushes the average for χ2 to values below 90° or below -90° respectively. Similarly, for r1 of g-, the averages are pushed to values above χ2=90° and χ2=-90° by interactions of N and XD1 and XD2 when χ2 is 60° or -120°. For g+ rotamers, interactions at χ2=60° and 120° exert steric conflict about equally, so that χ2 averages 90°.
Graphical Views of the Backbone-Independent Rotamer Library
The backbone-independent library can be visualized graphically in a number of ways. These images are all contained in the tar file bbdep_figures.tar.gz.
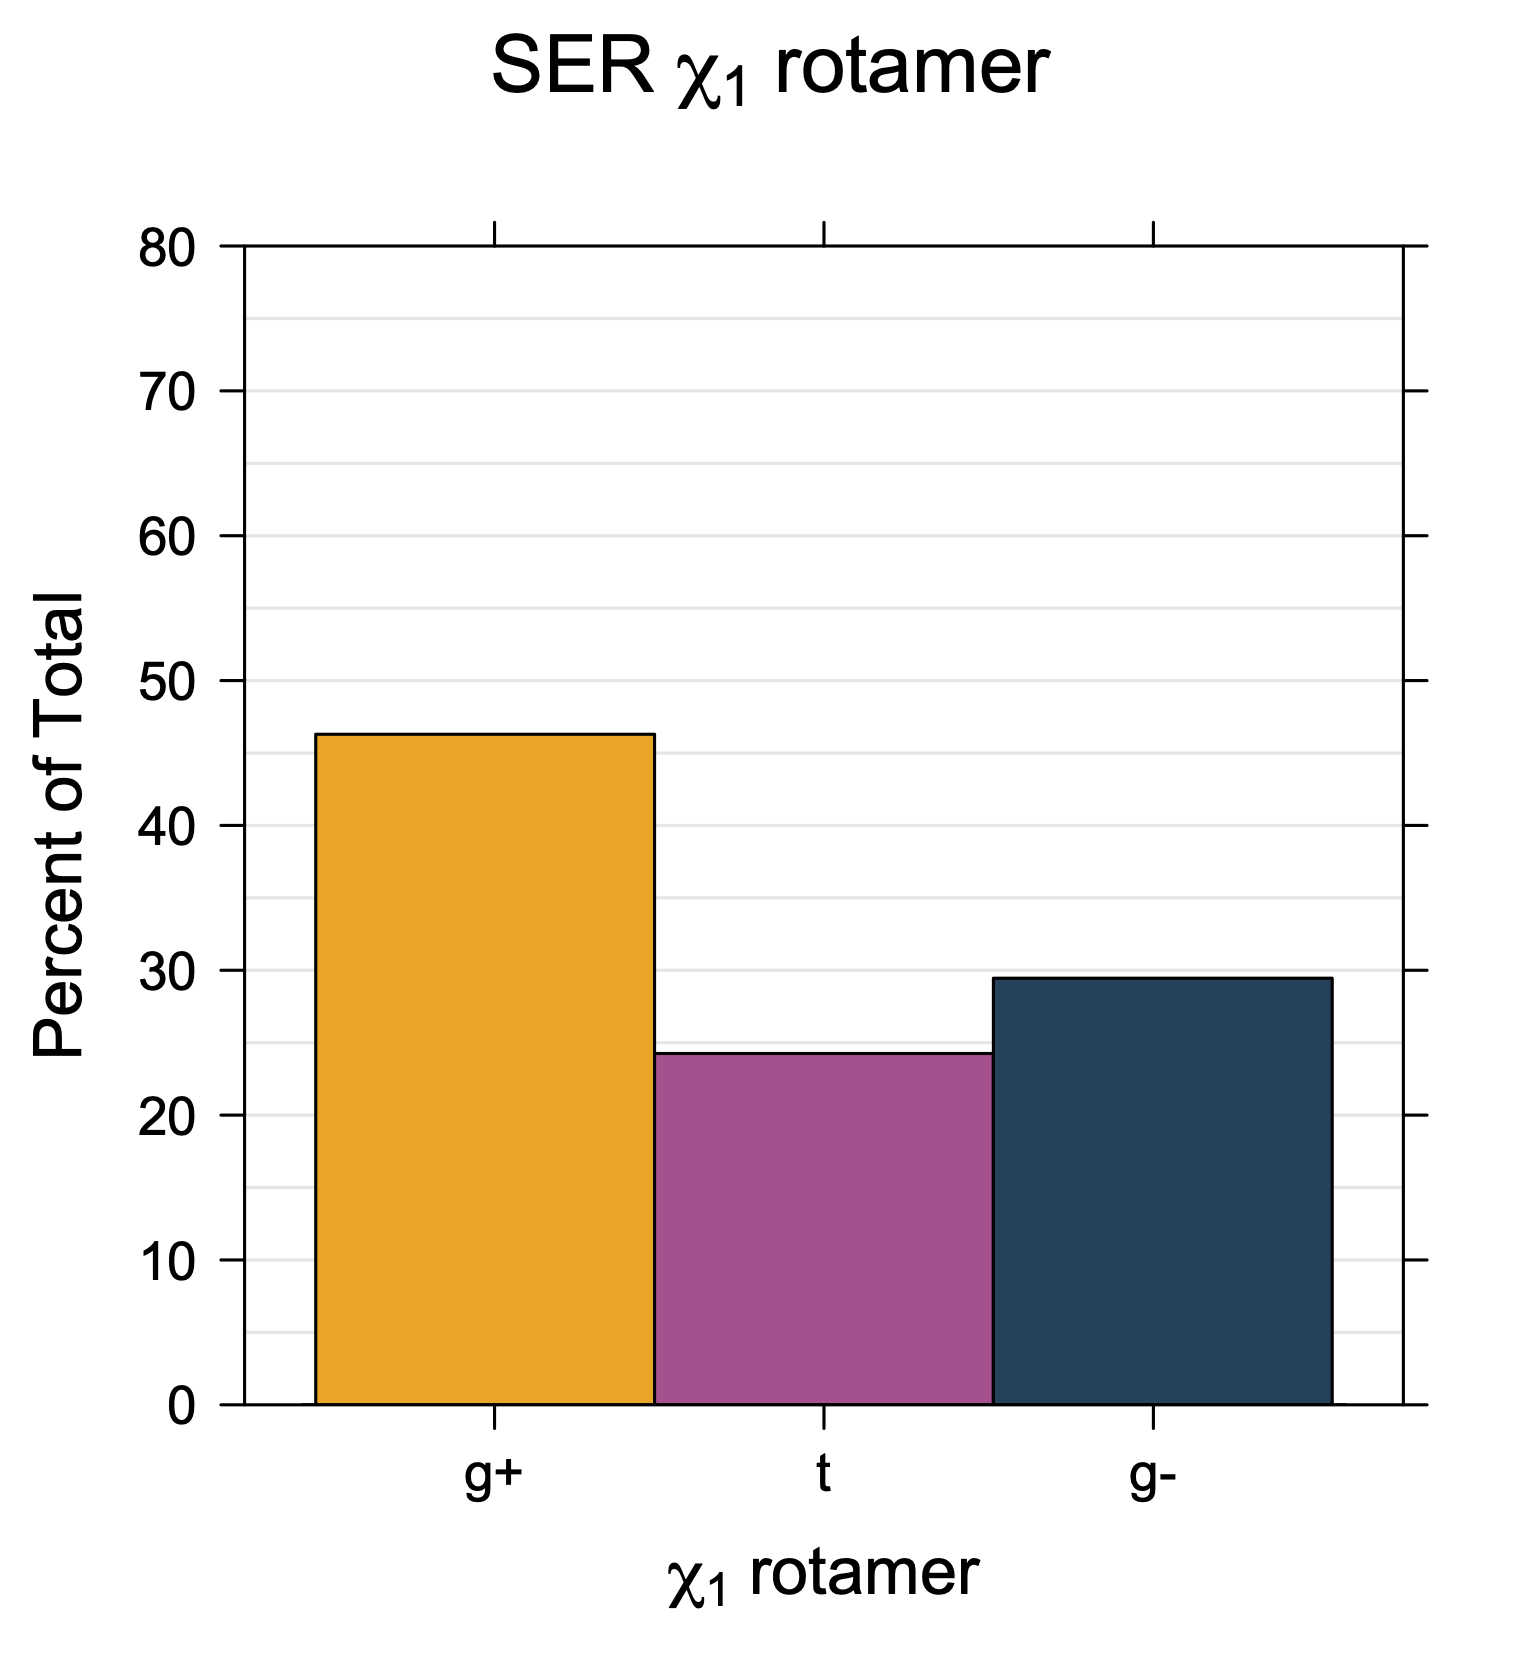
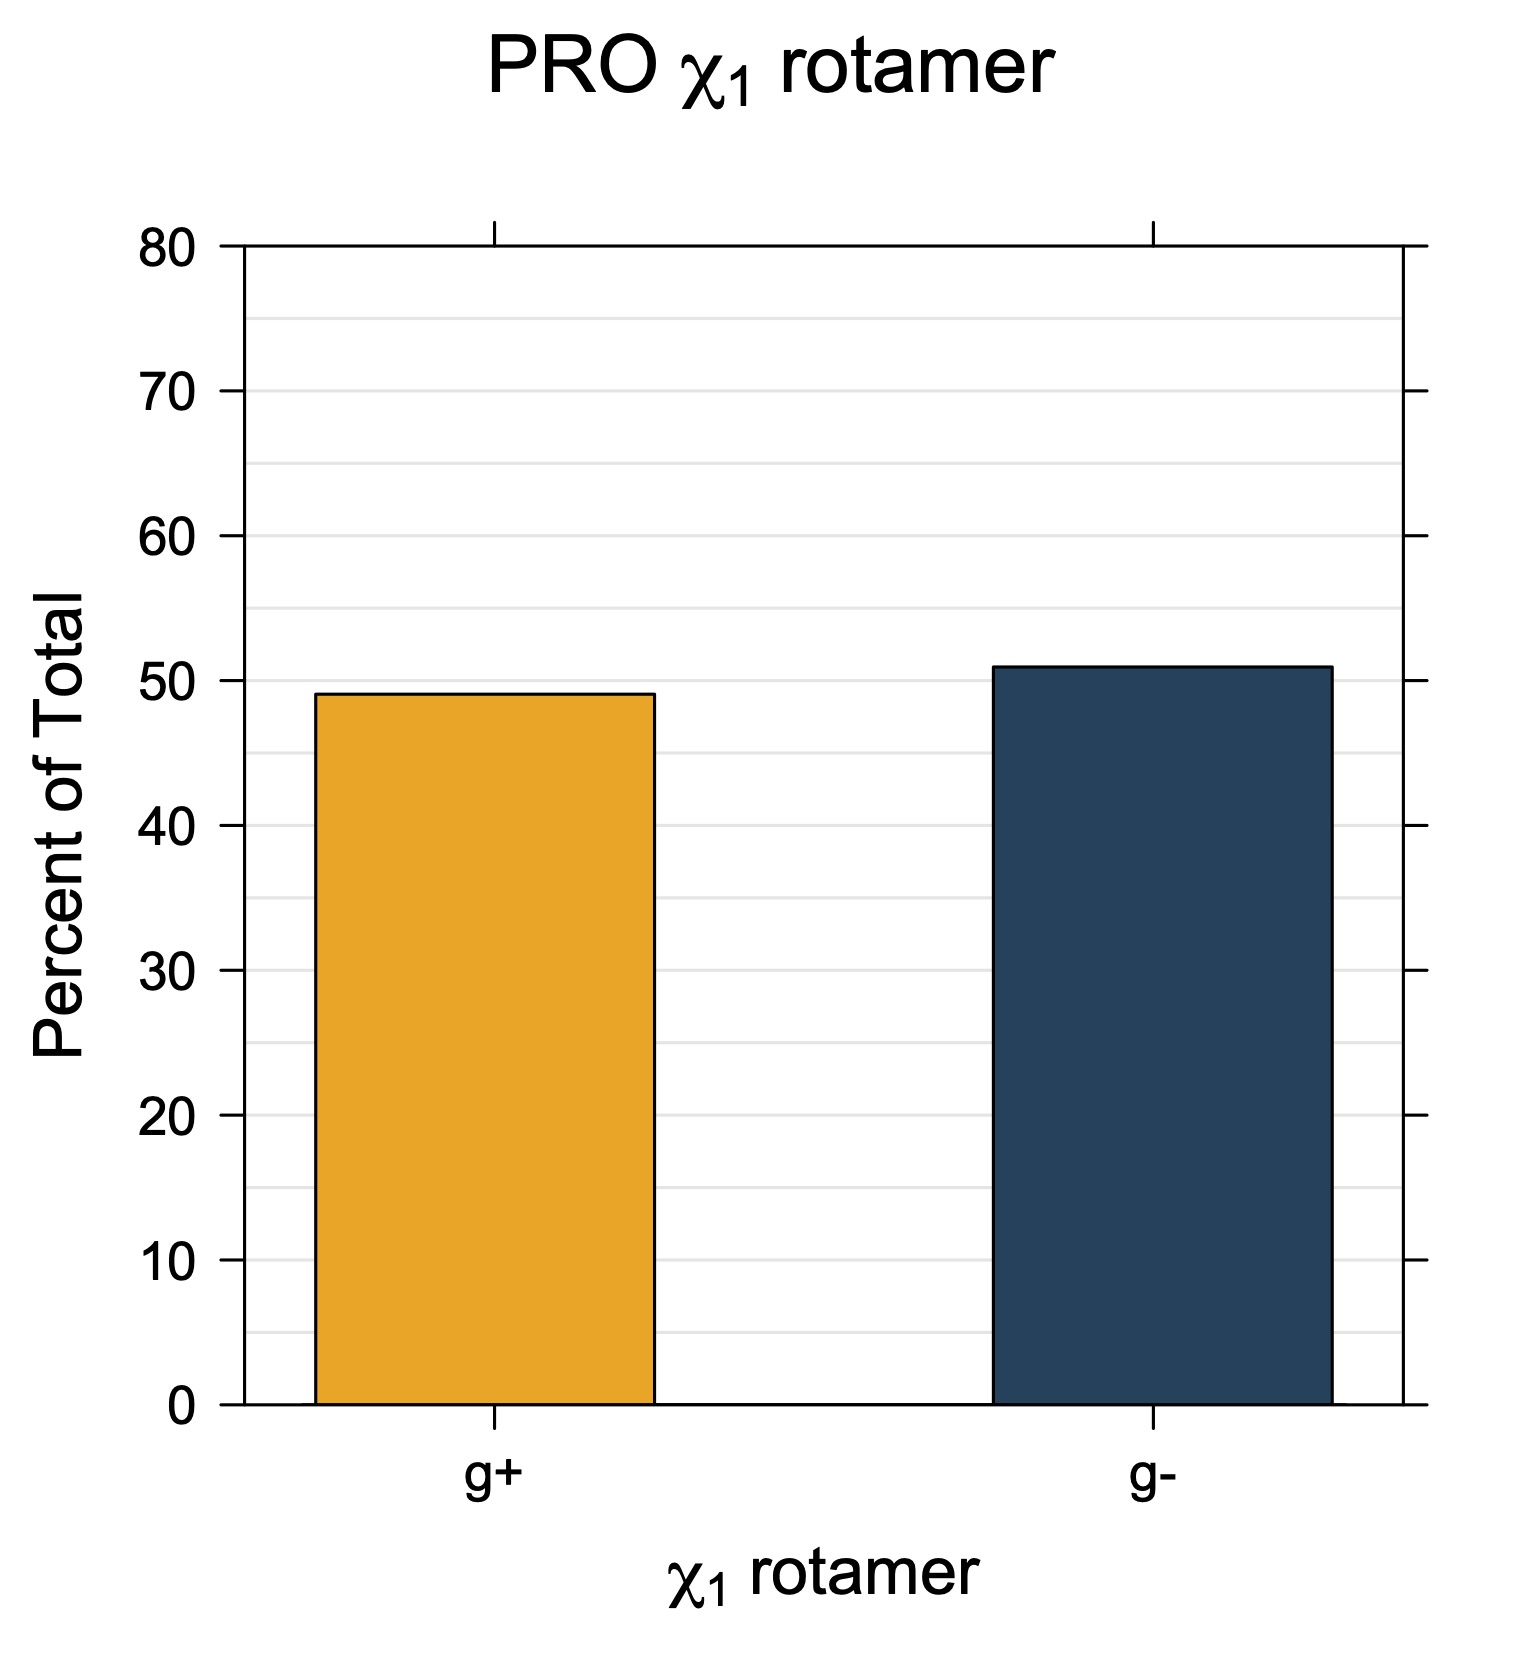
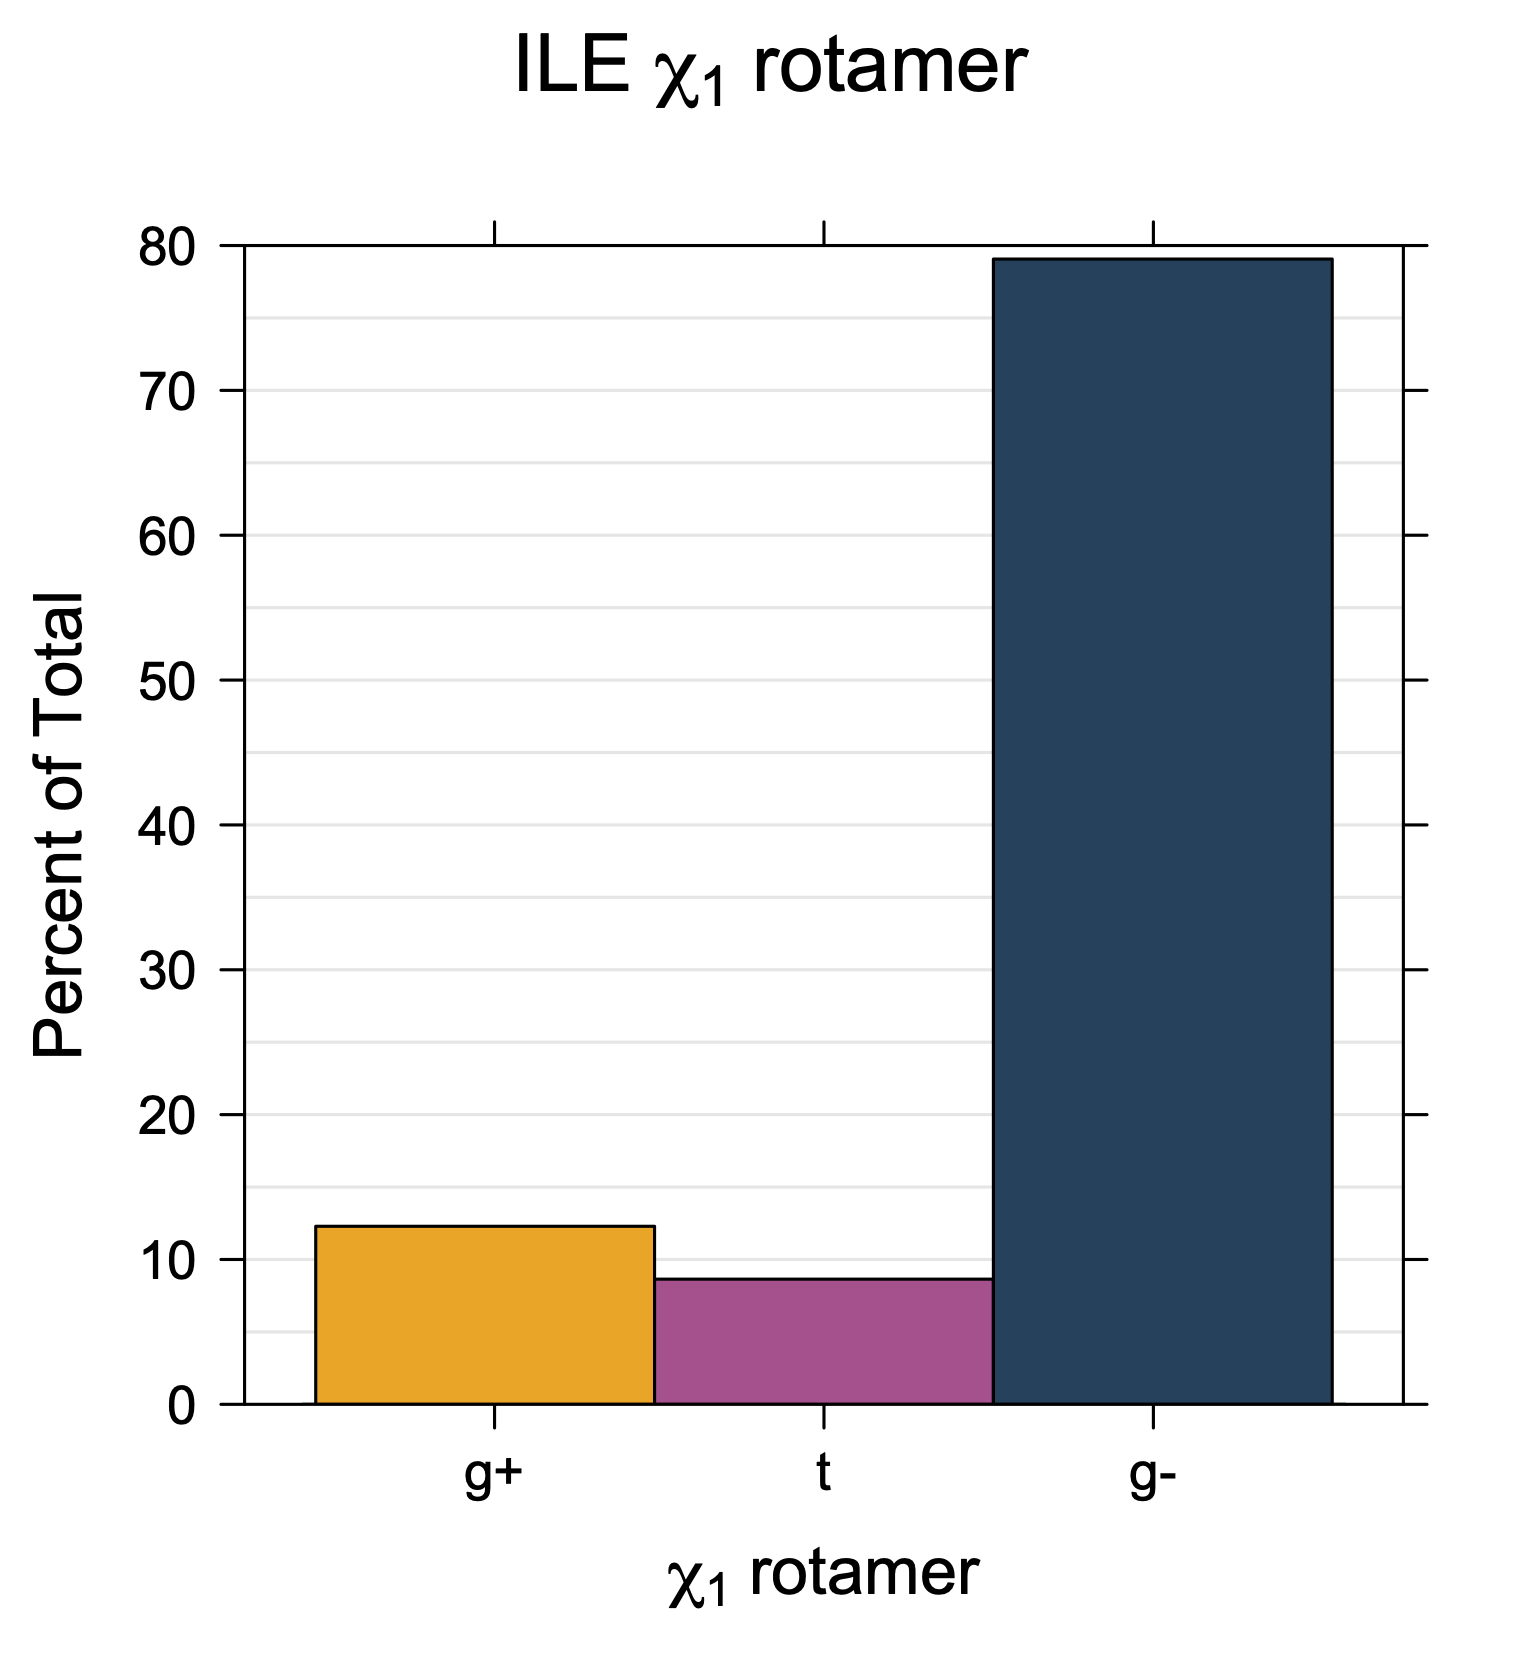
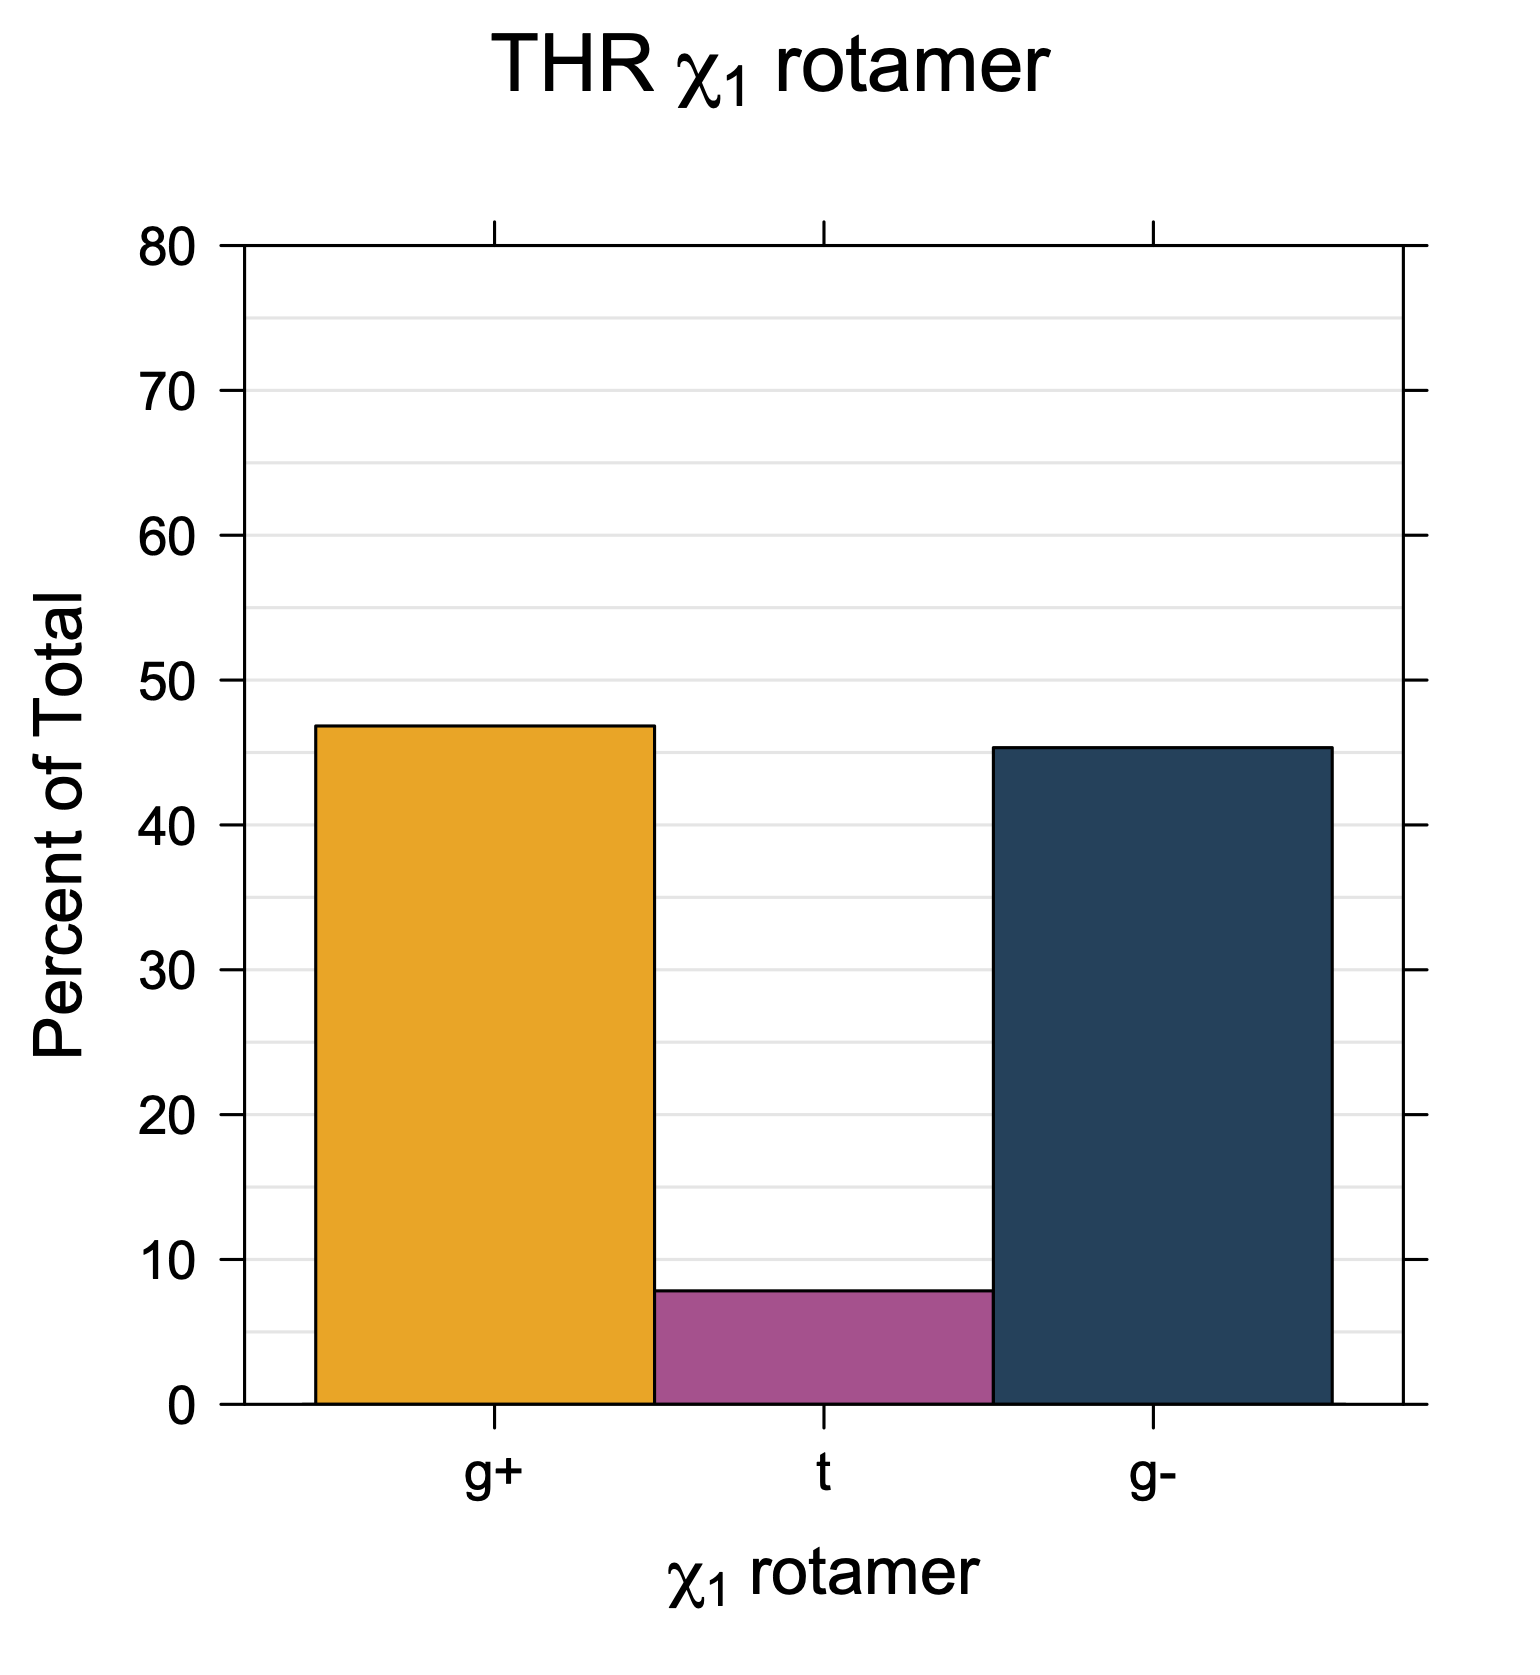
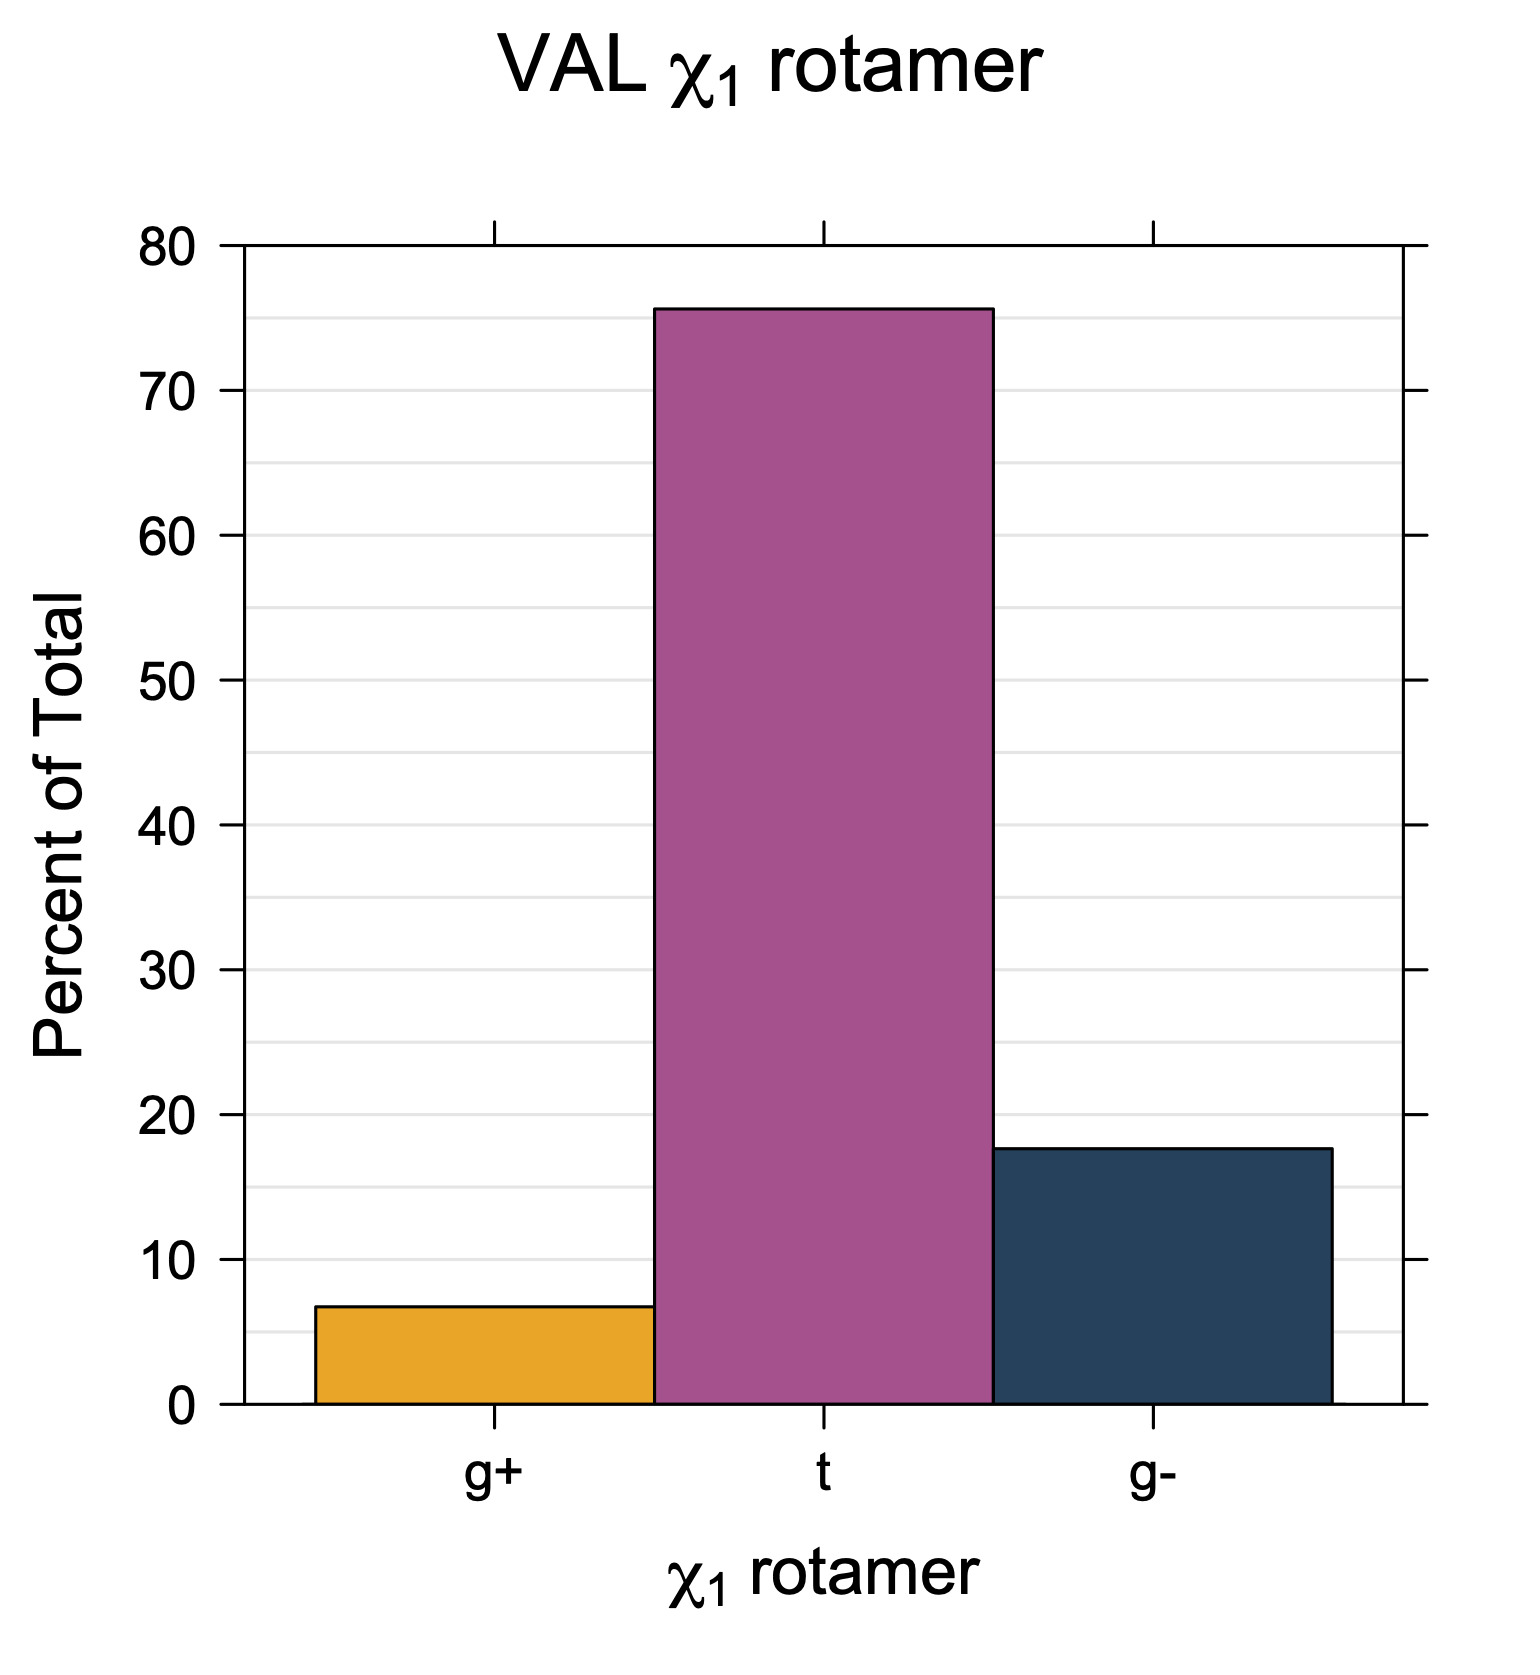
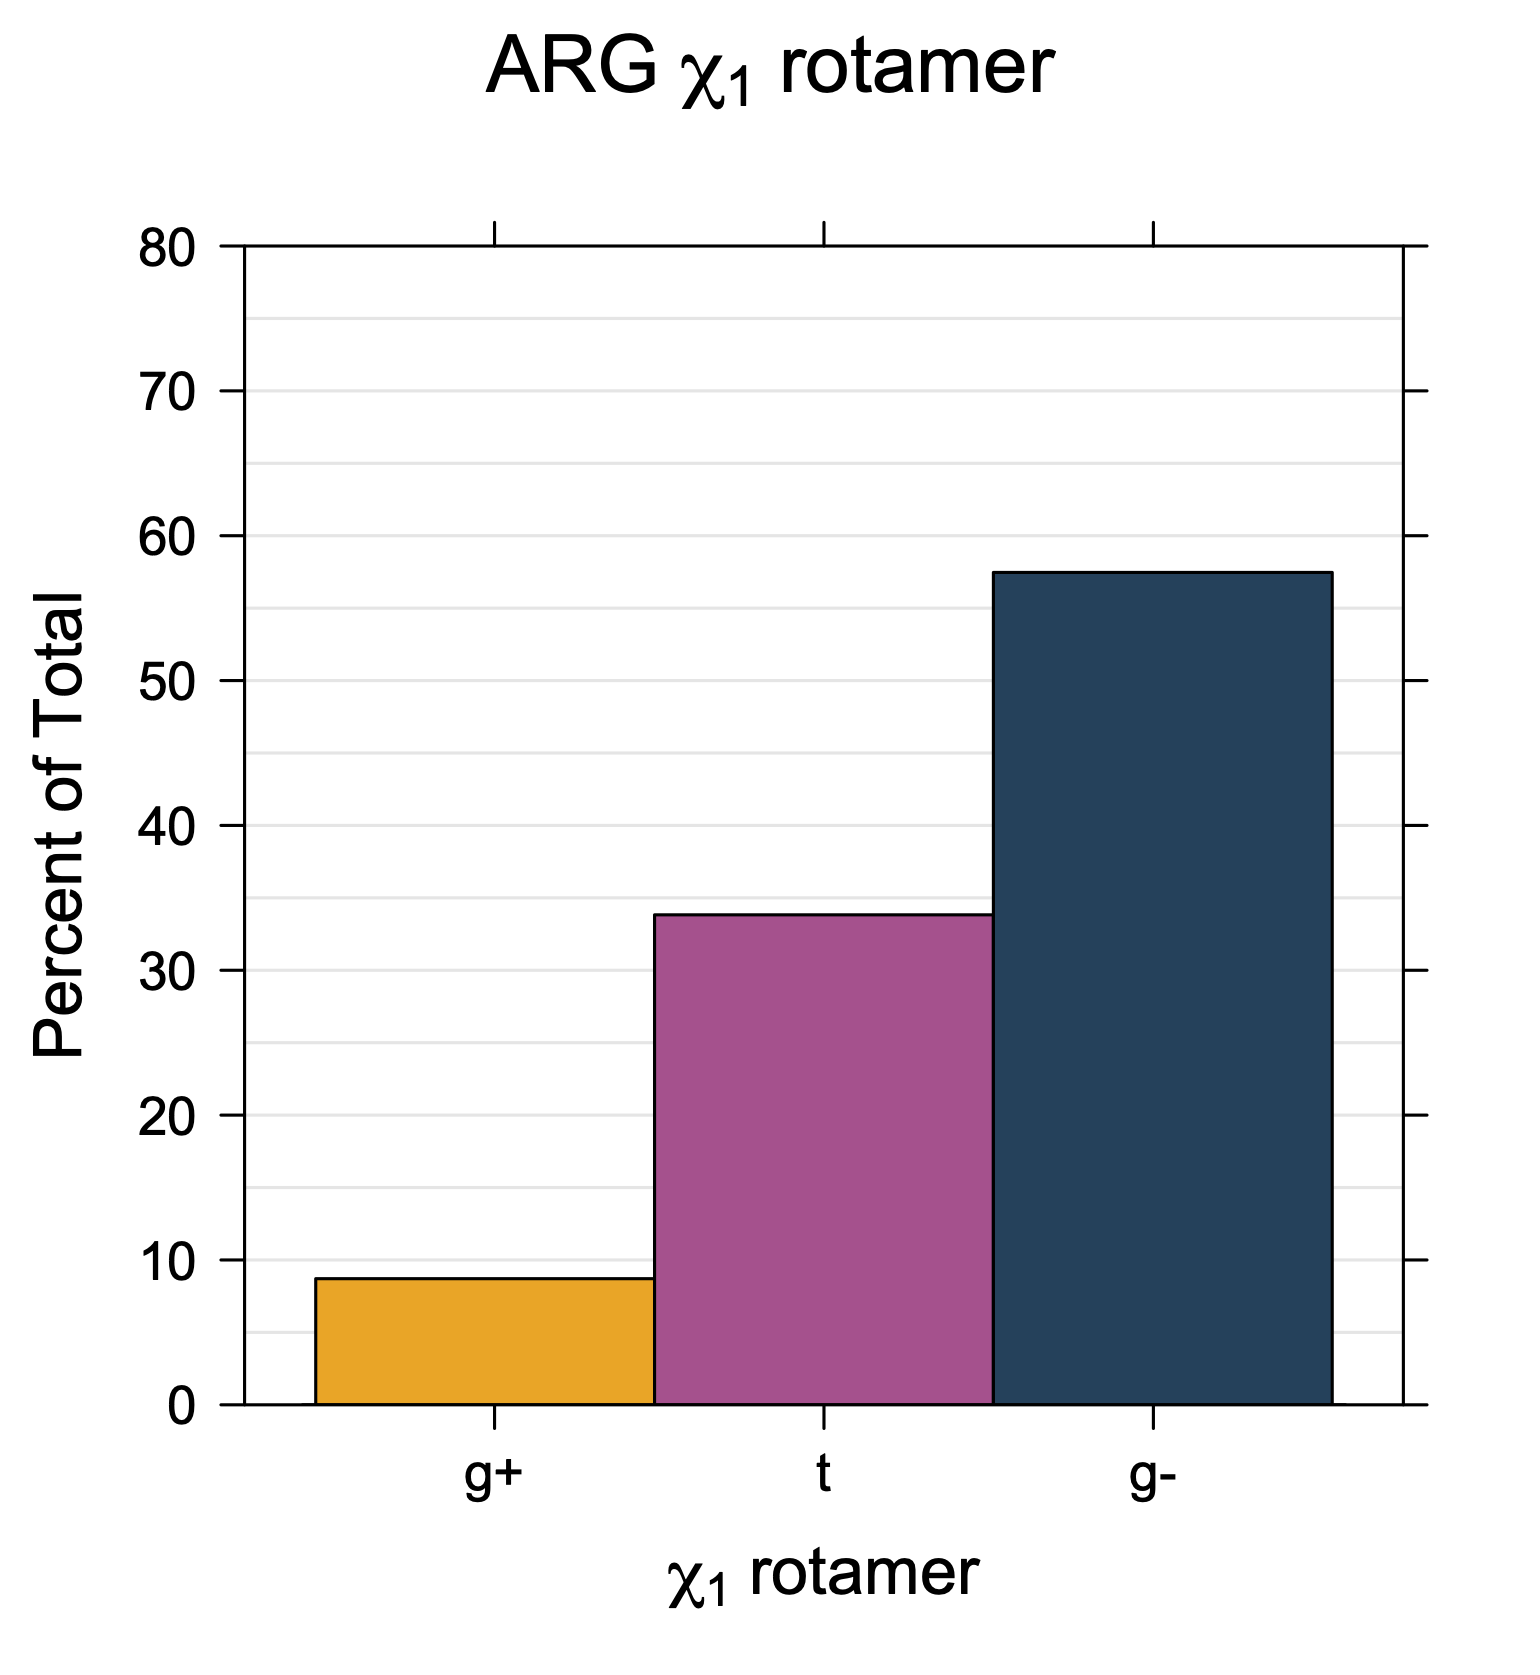
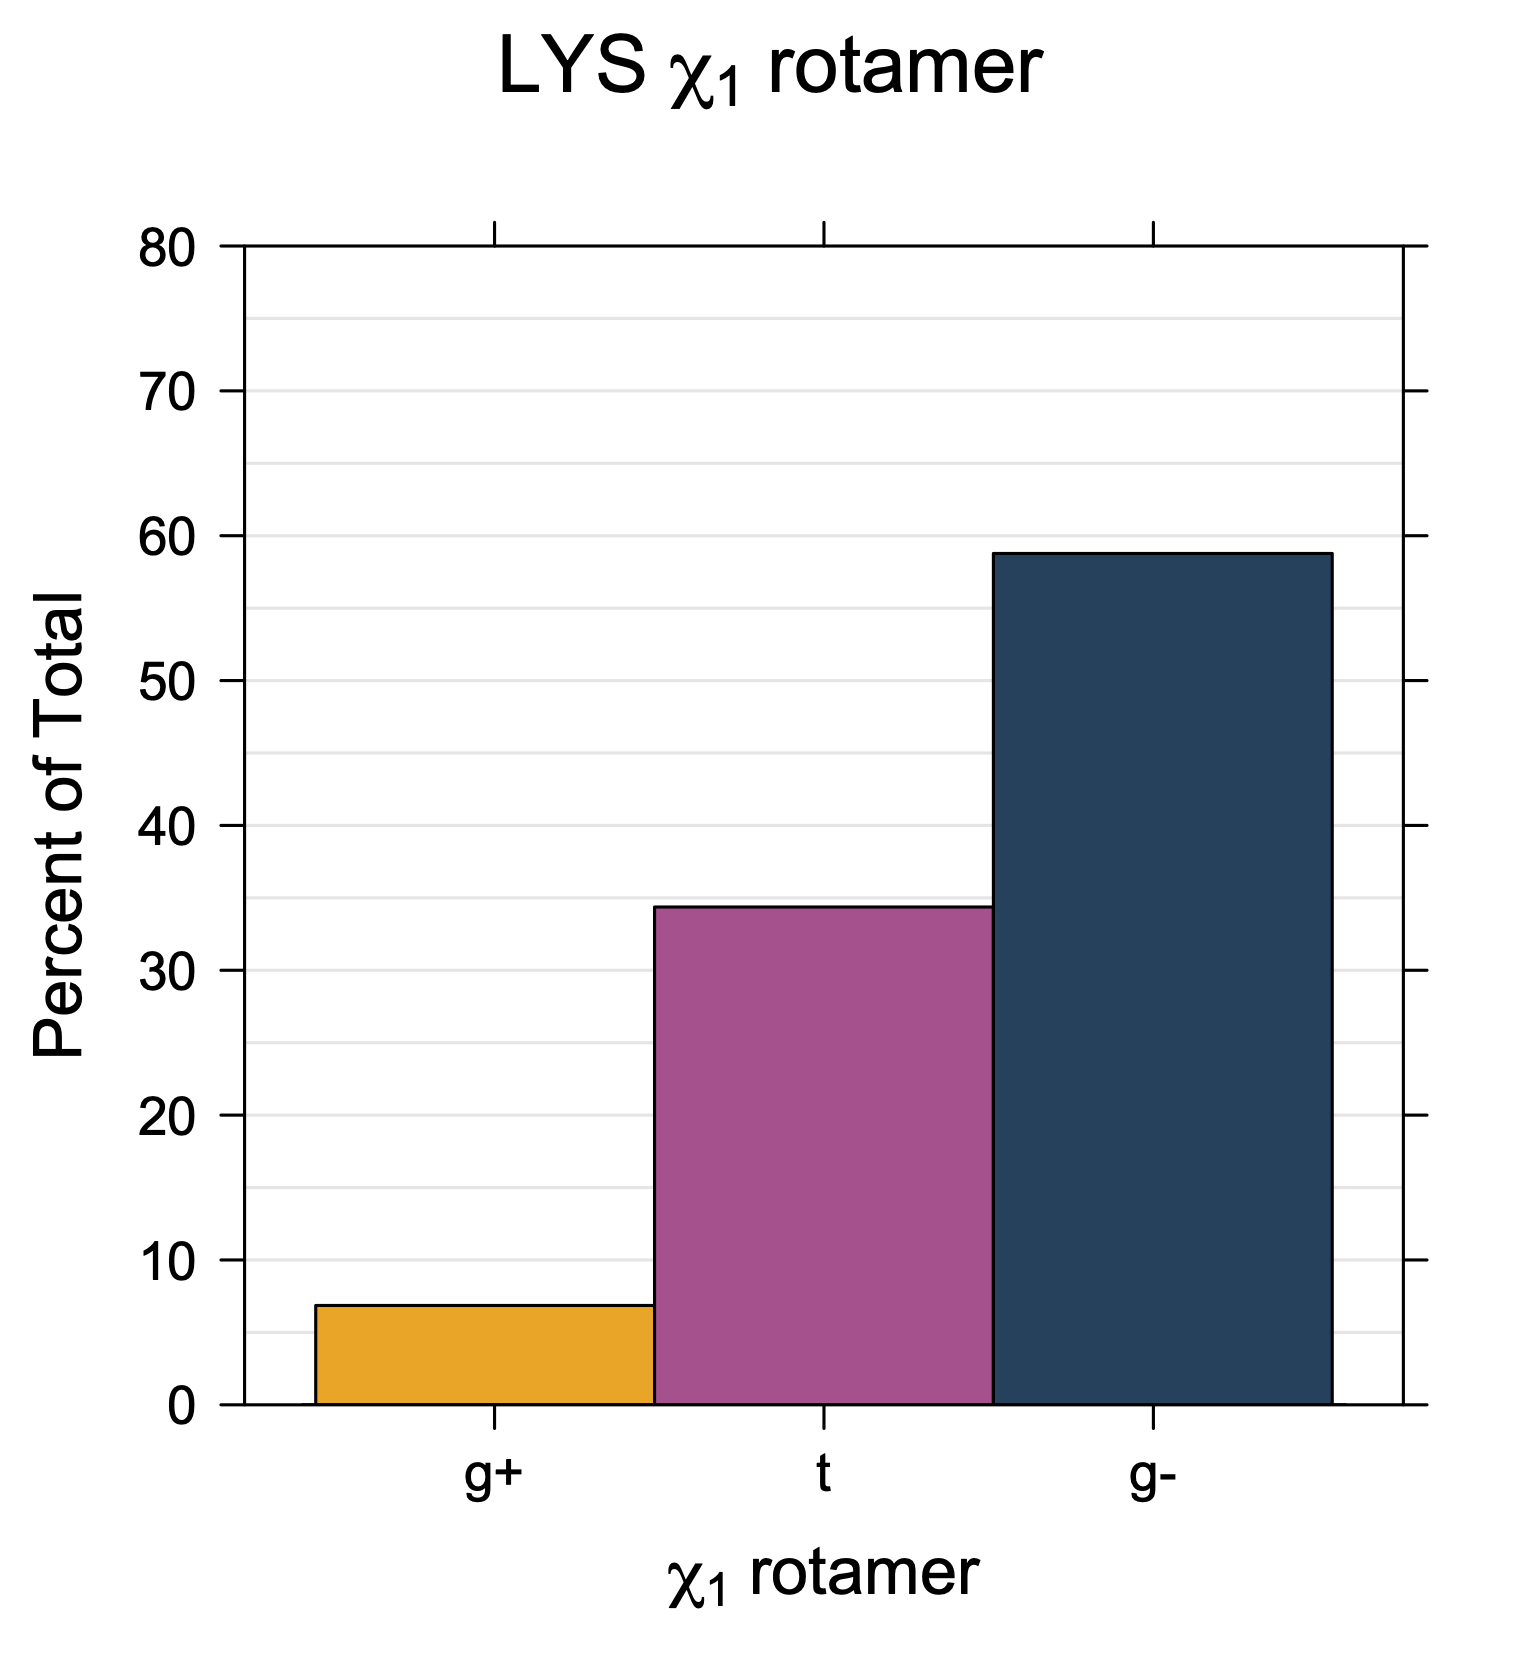
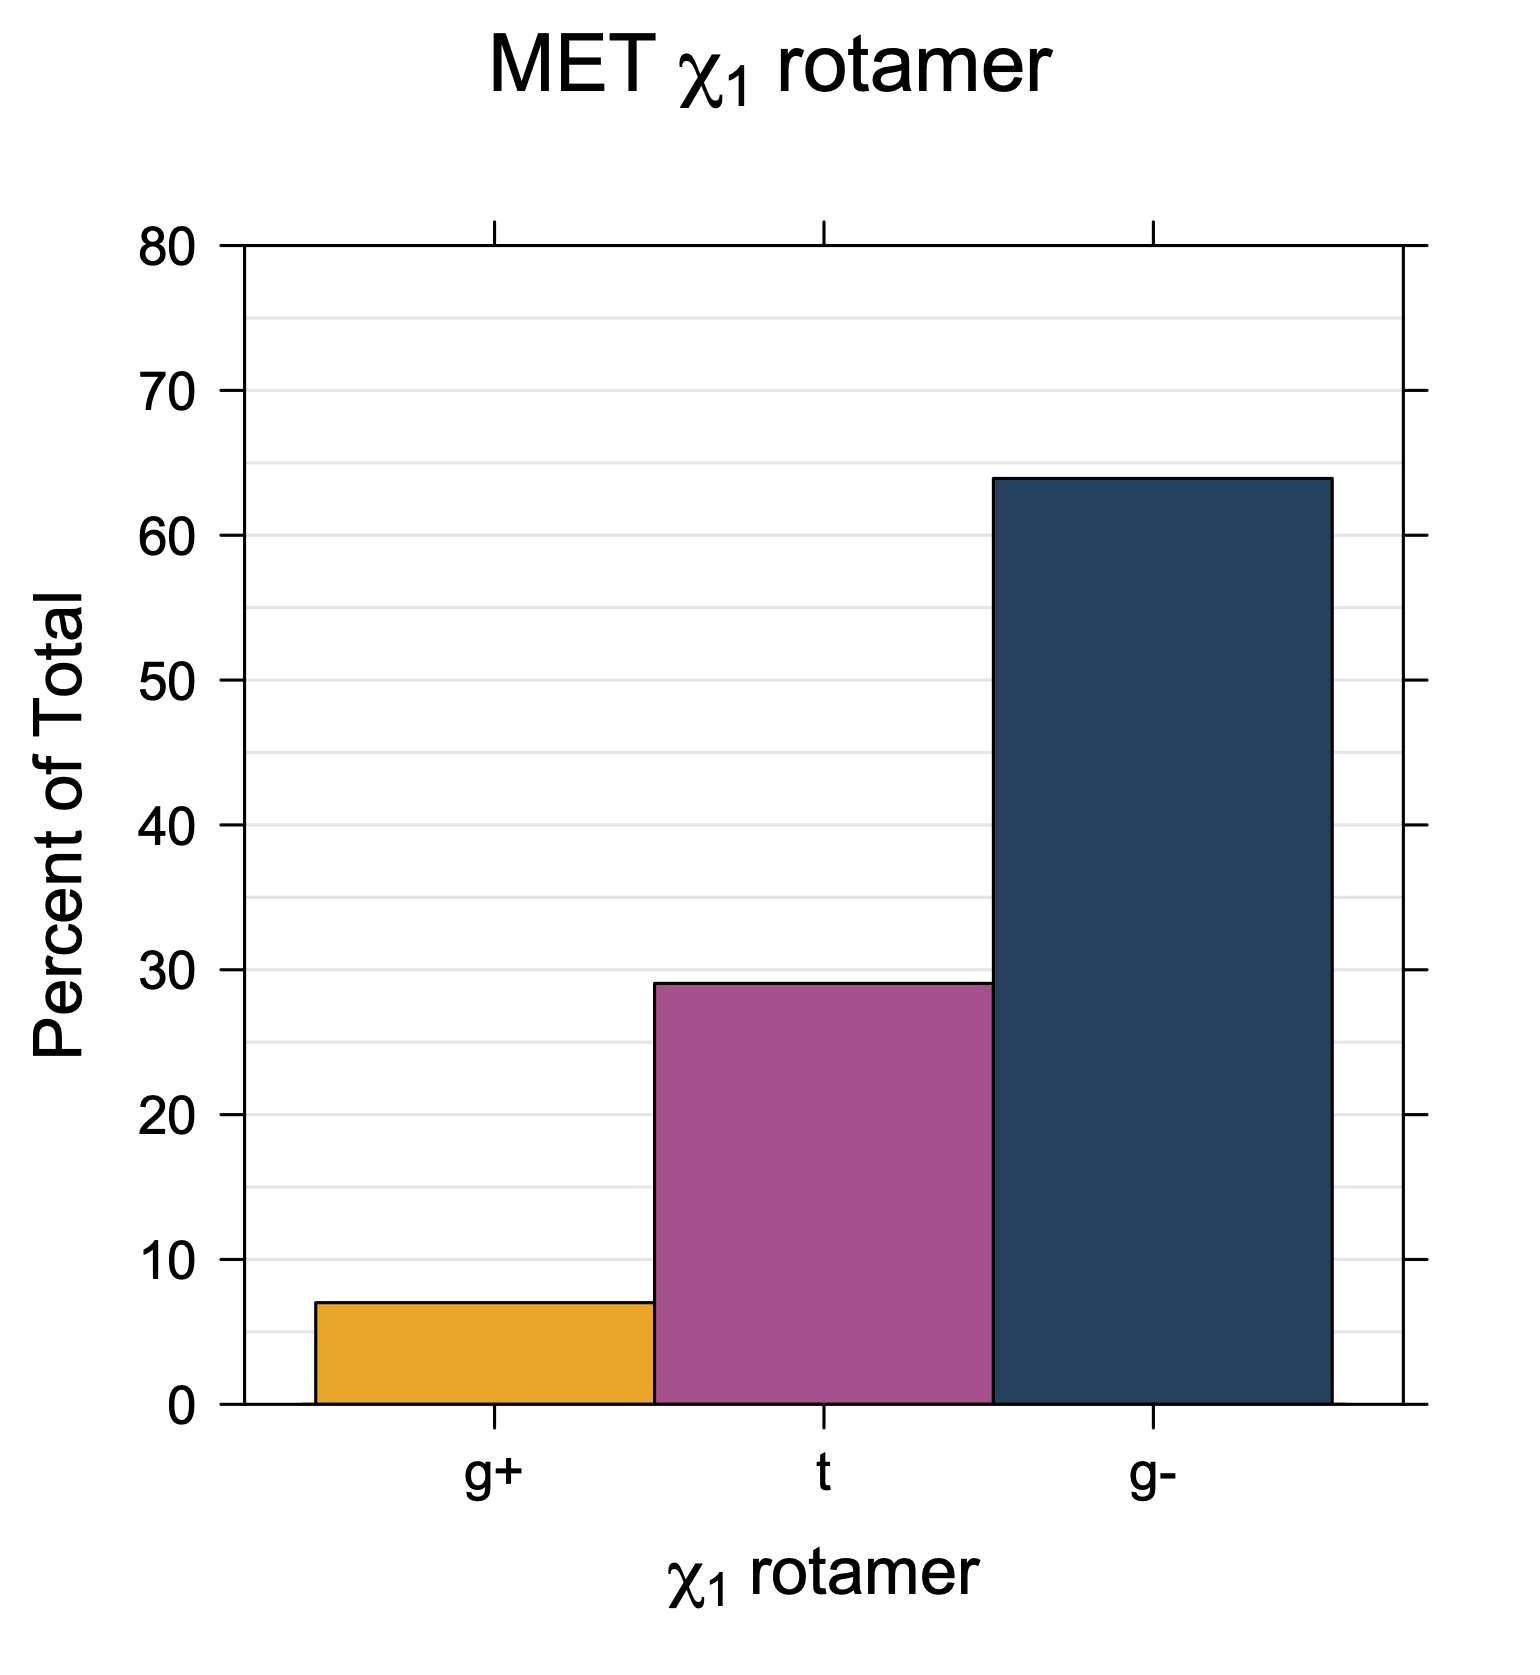
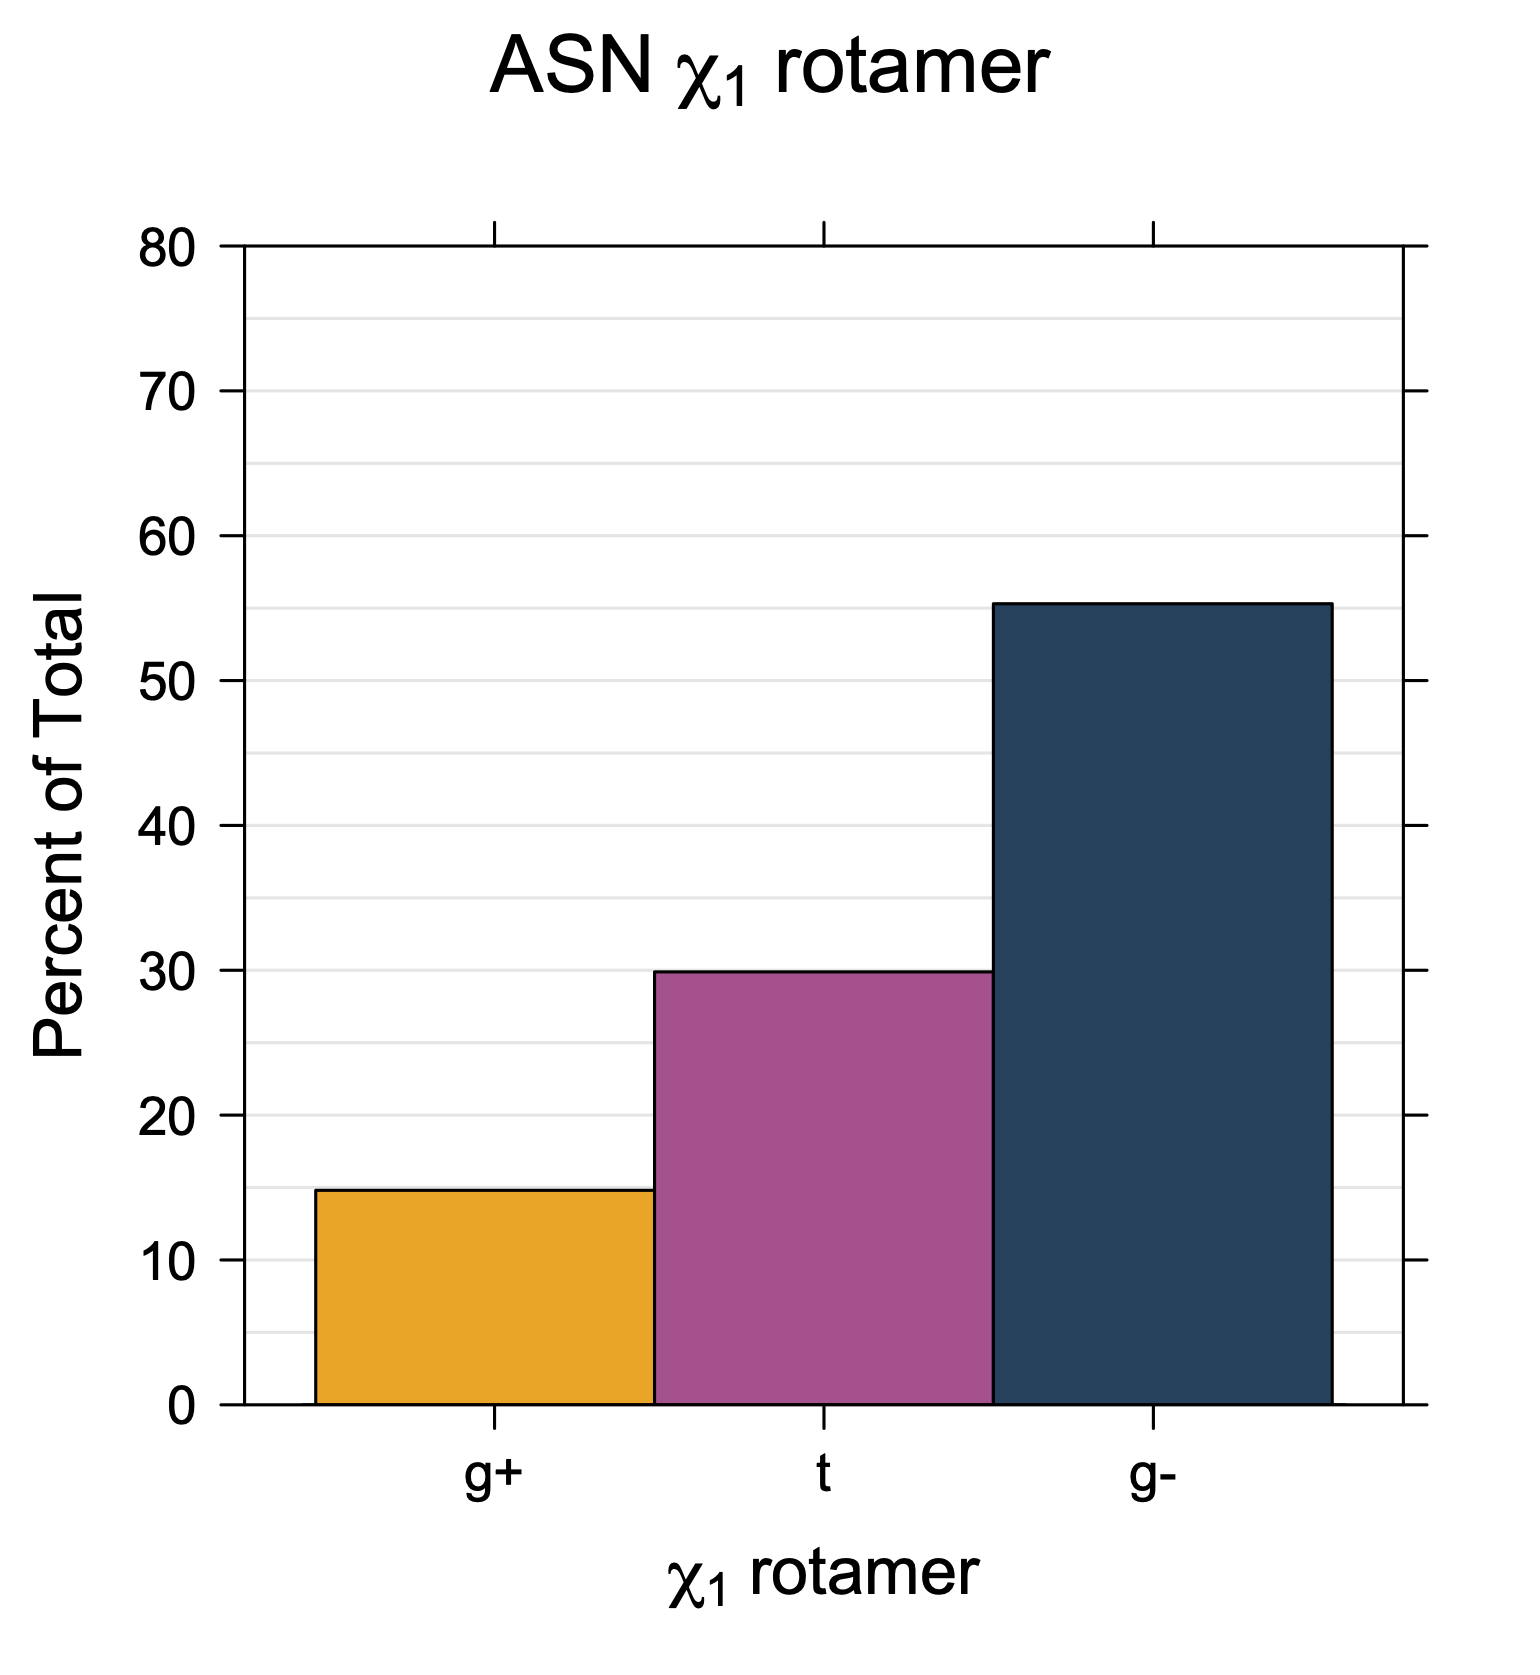
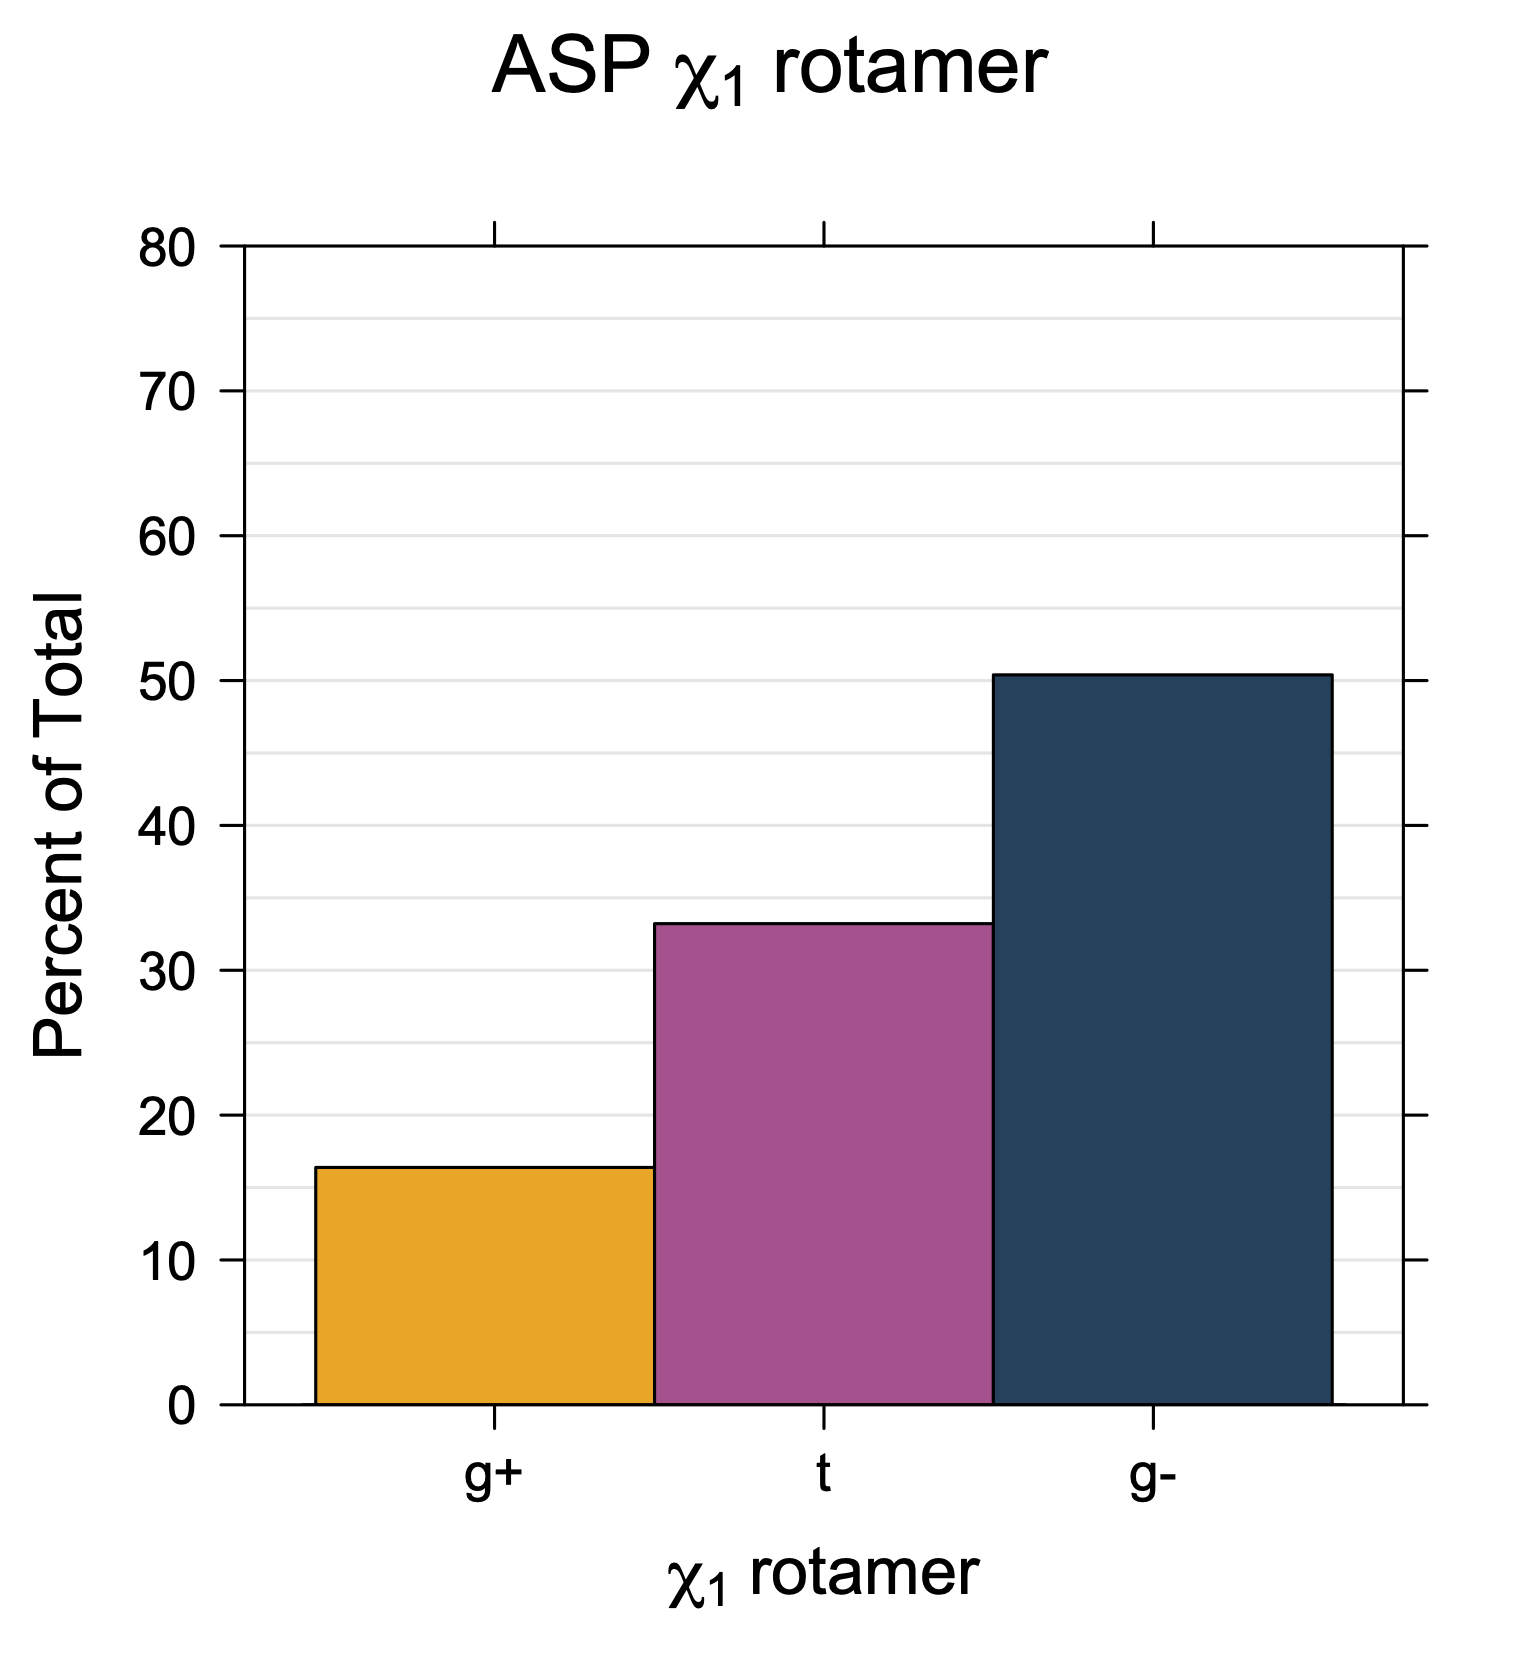
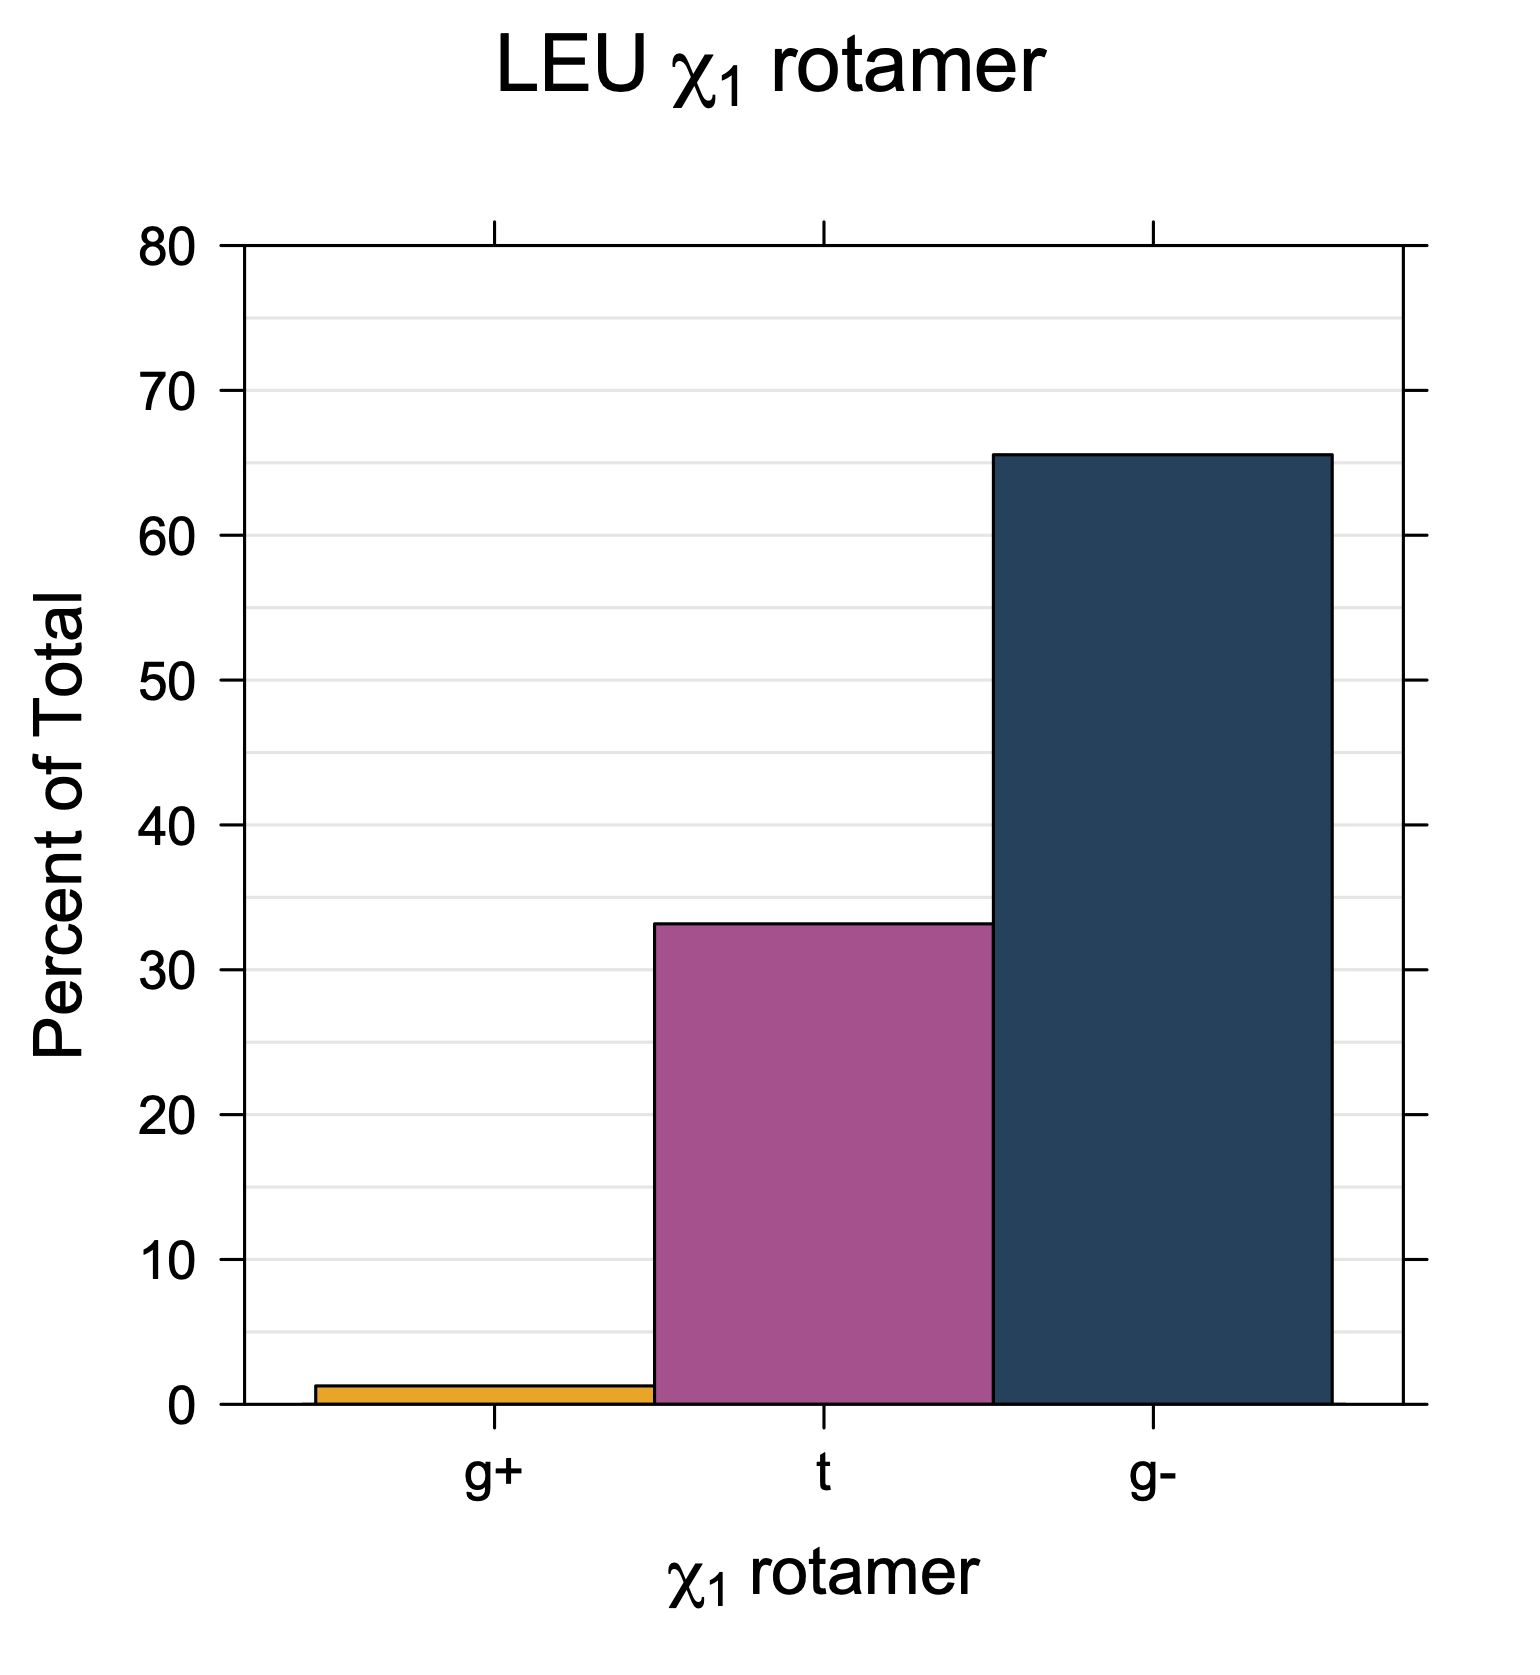
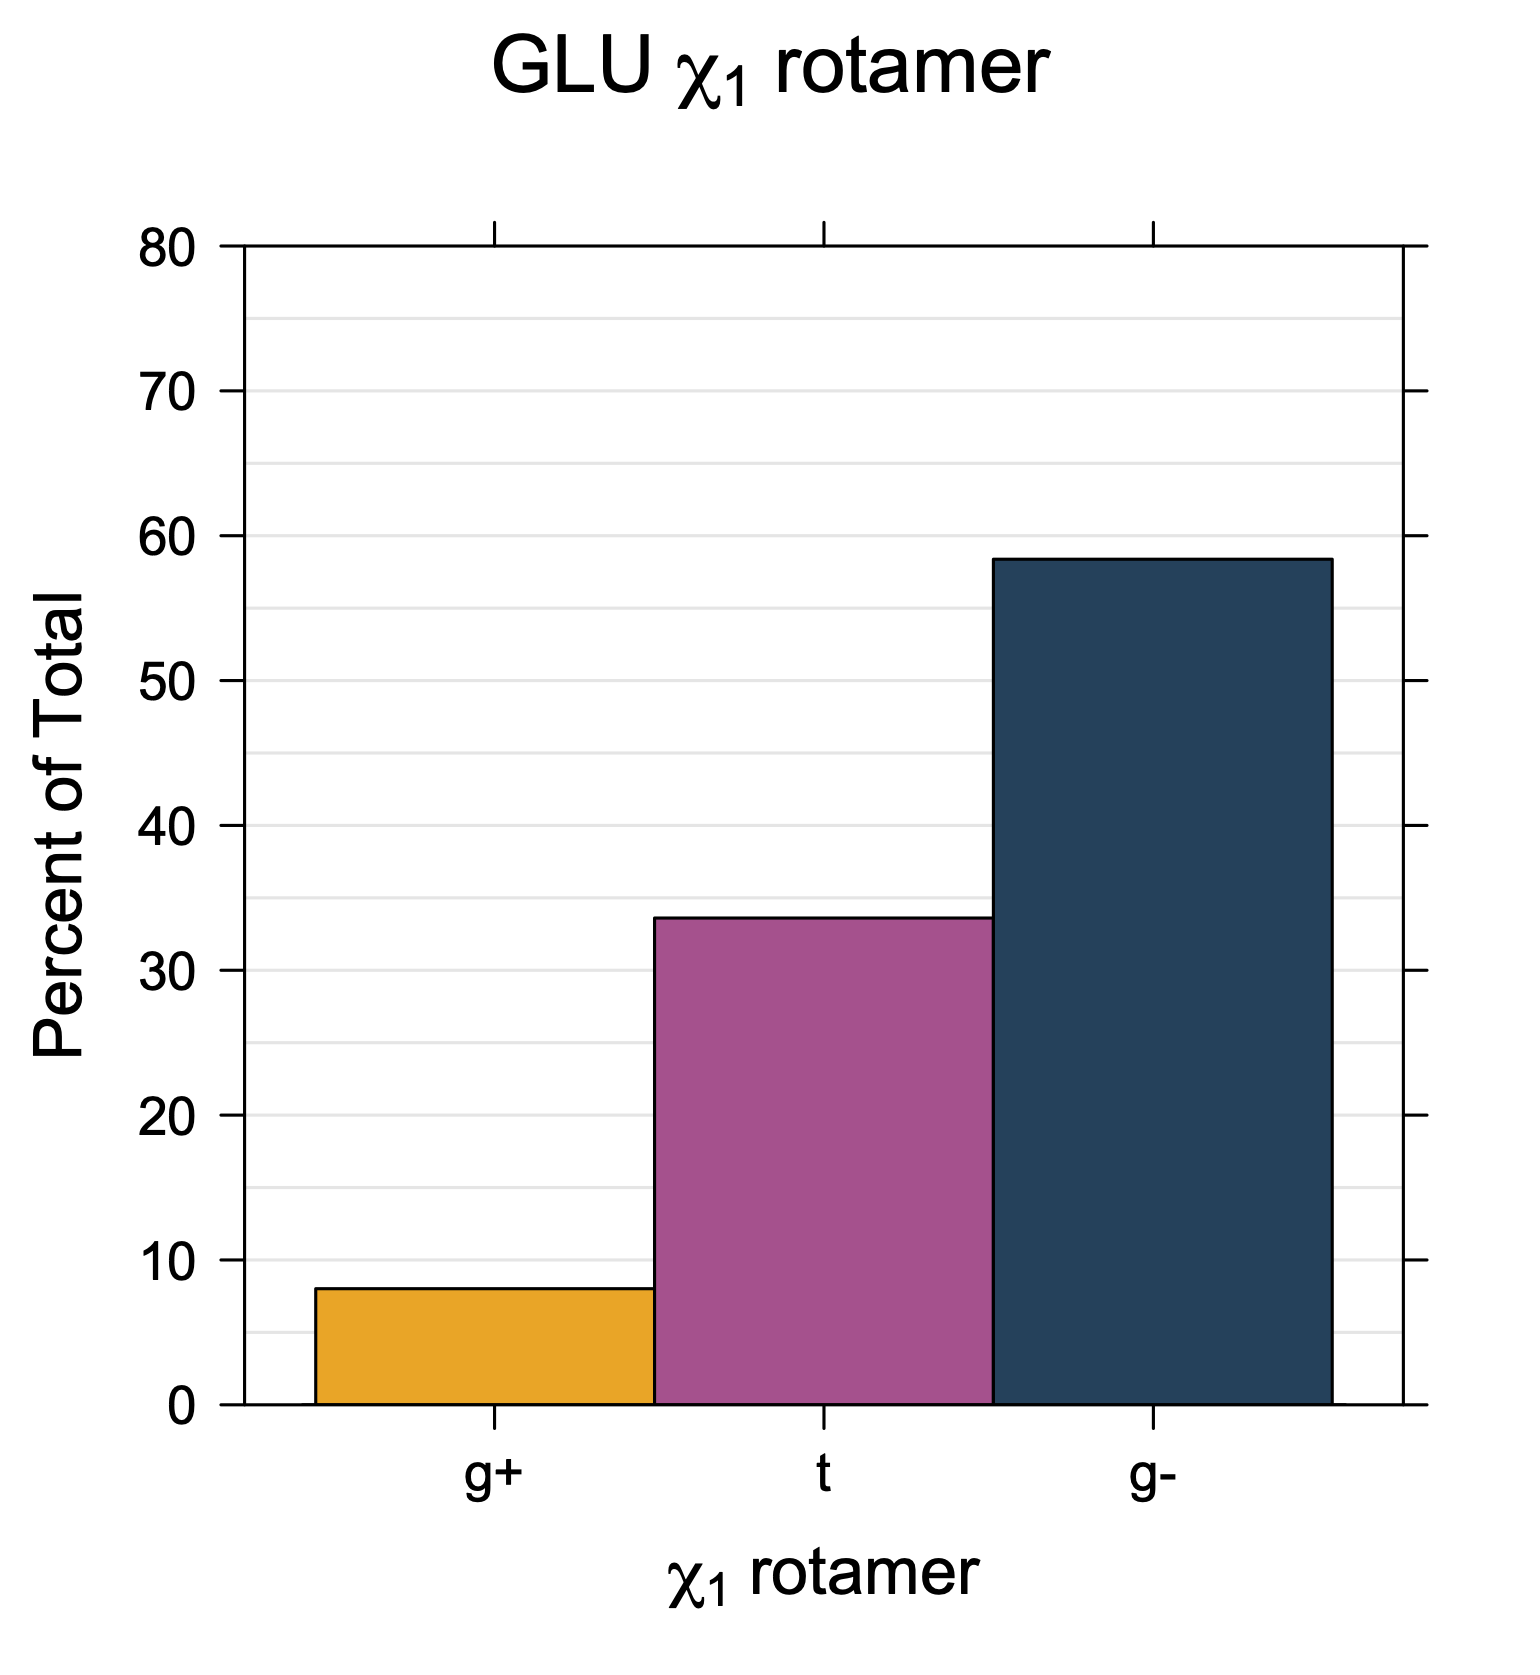
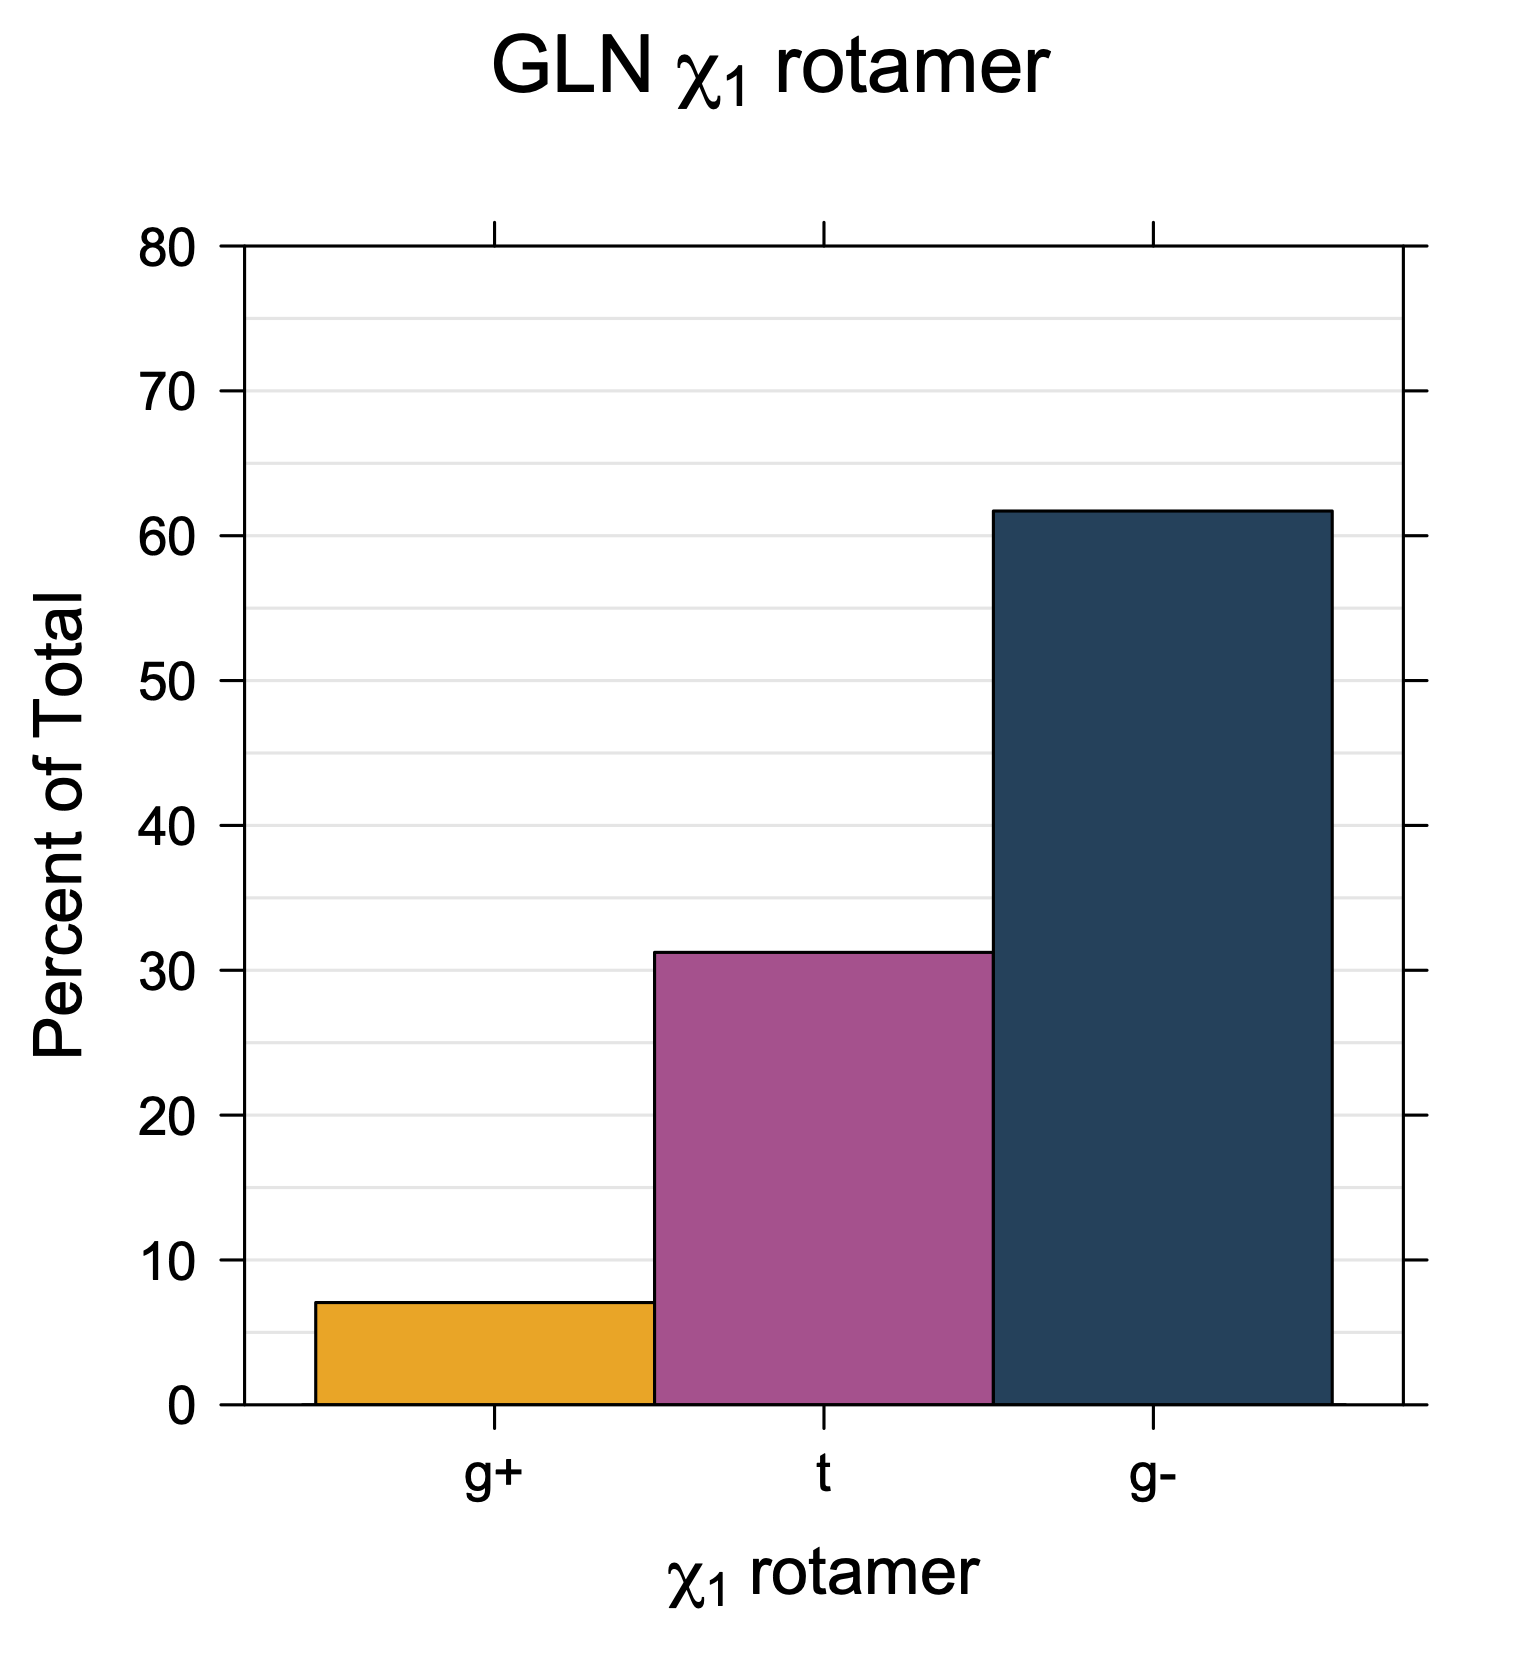
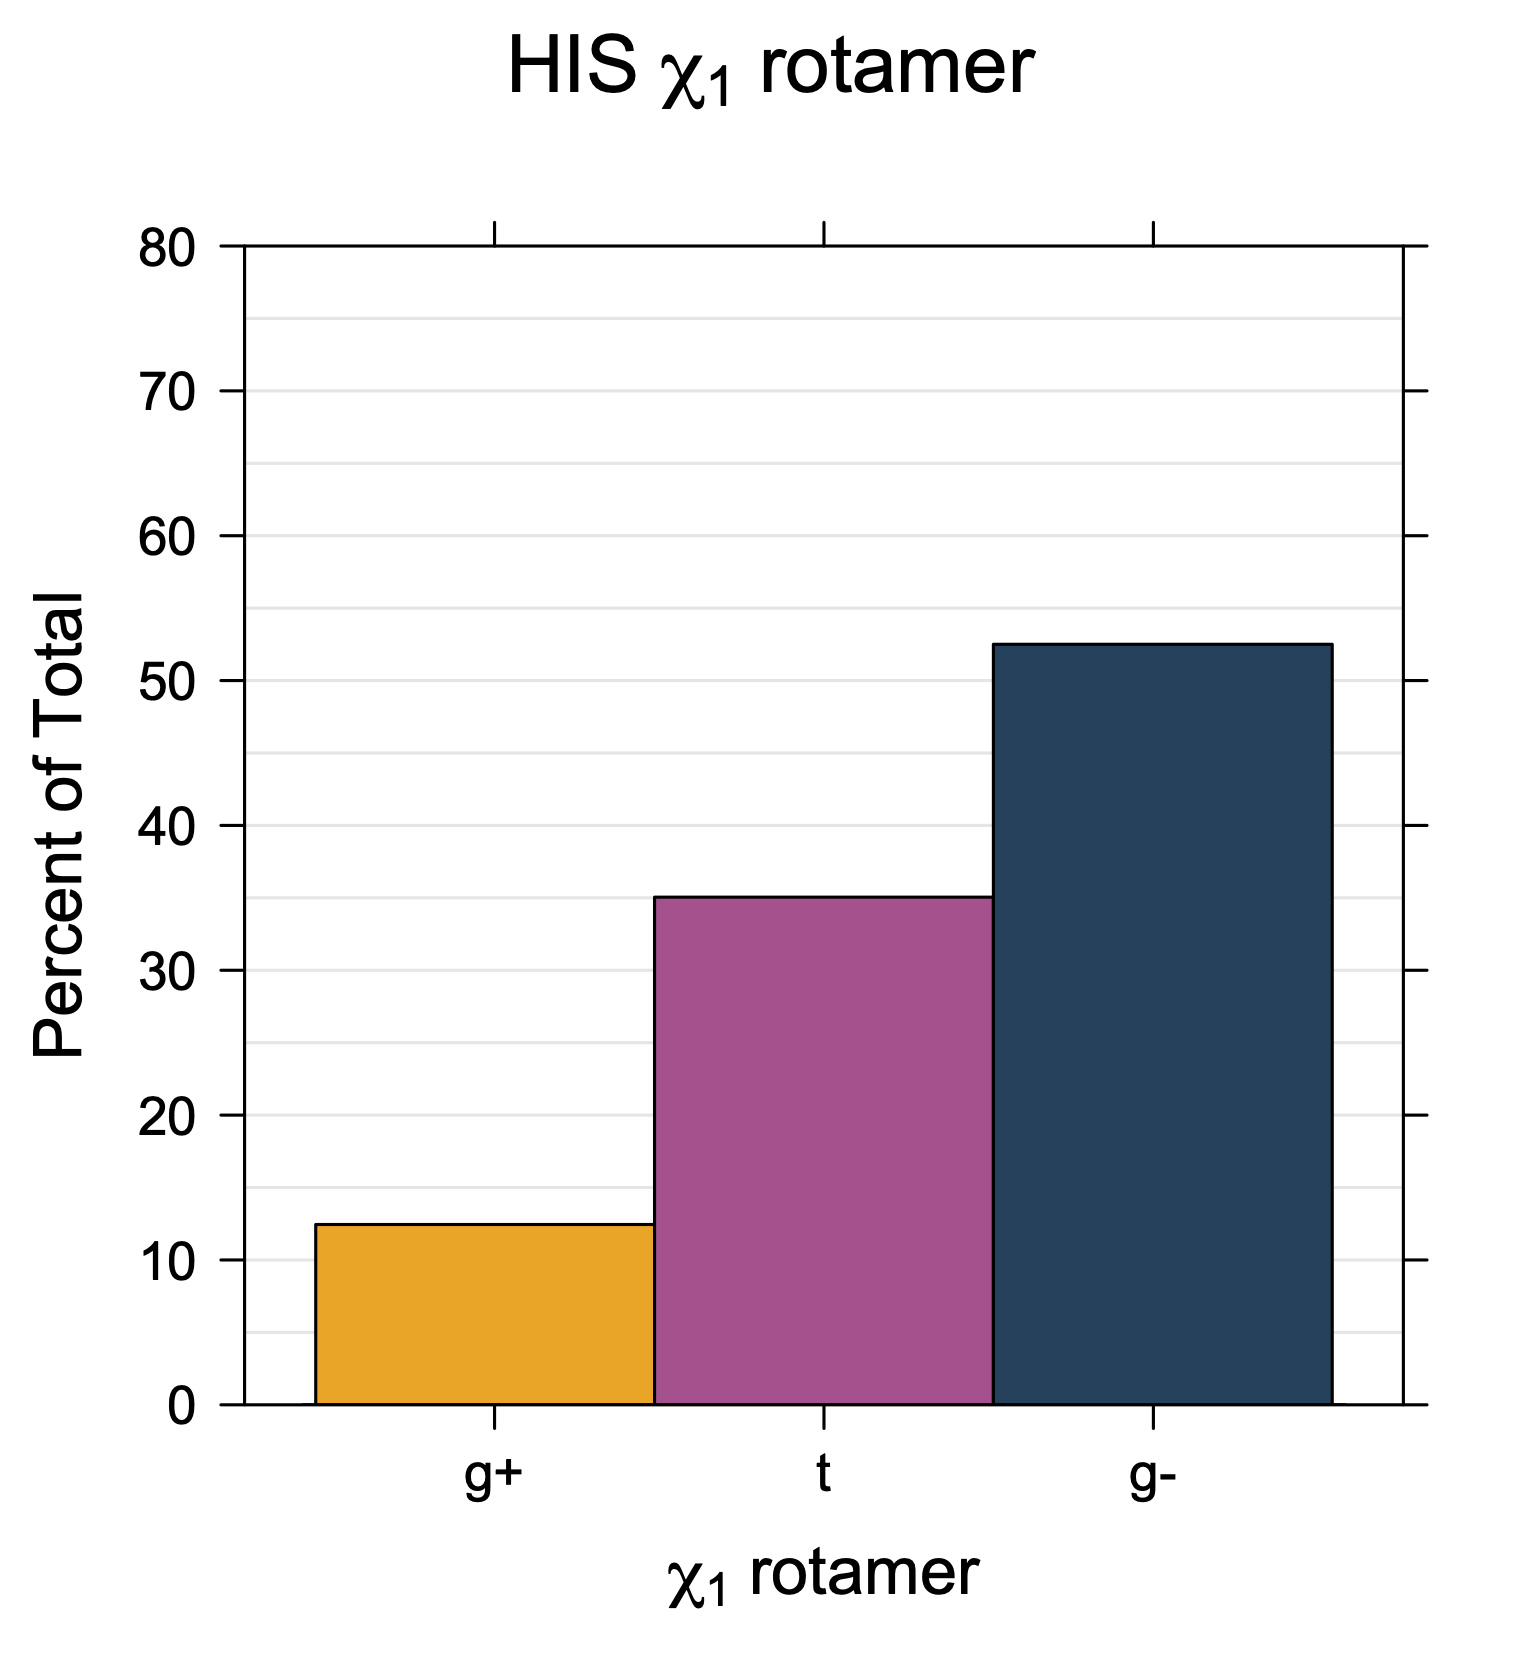
1. Histograms of χ1 Rotamer Populations
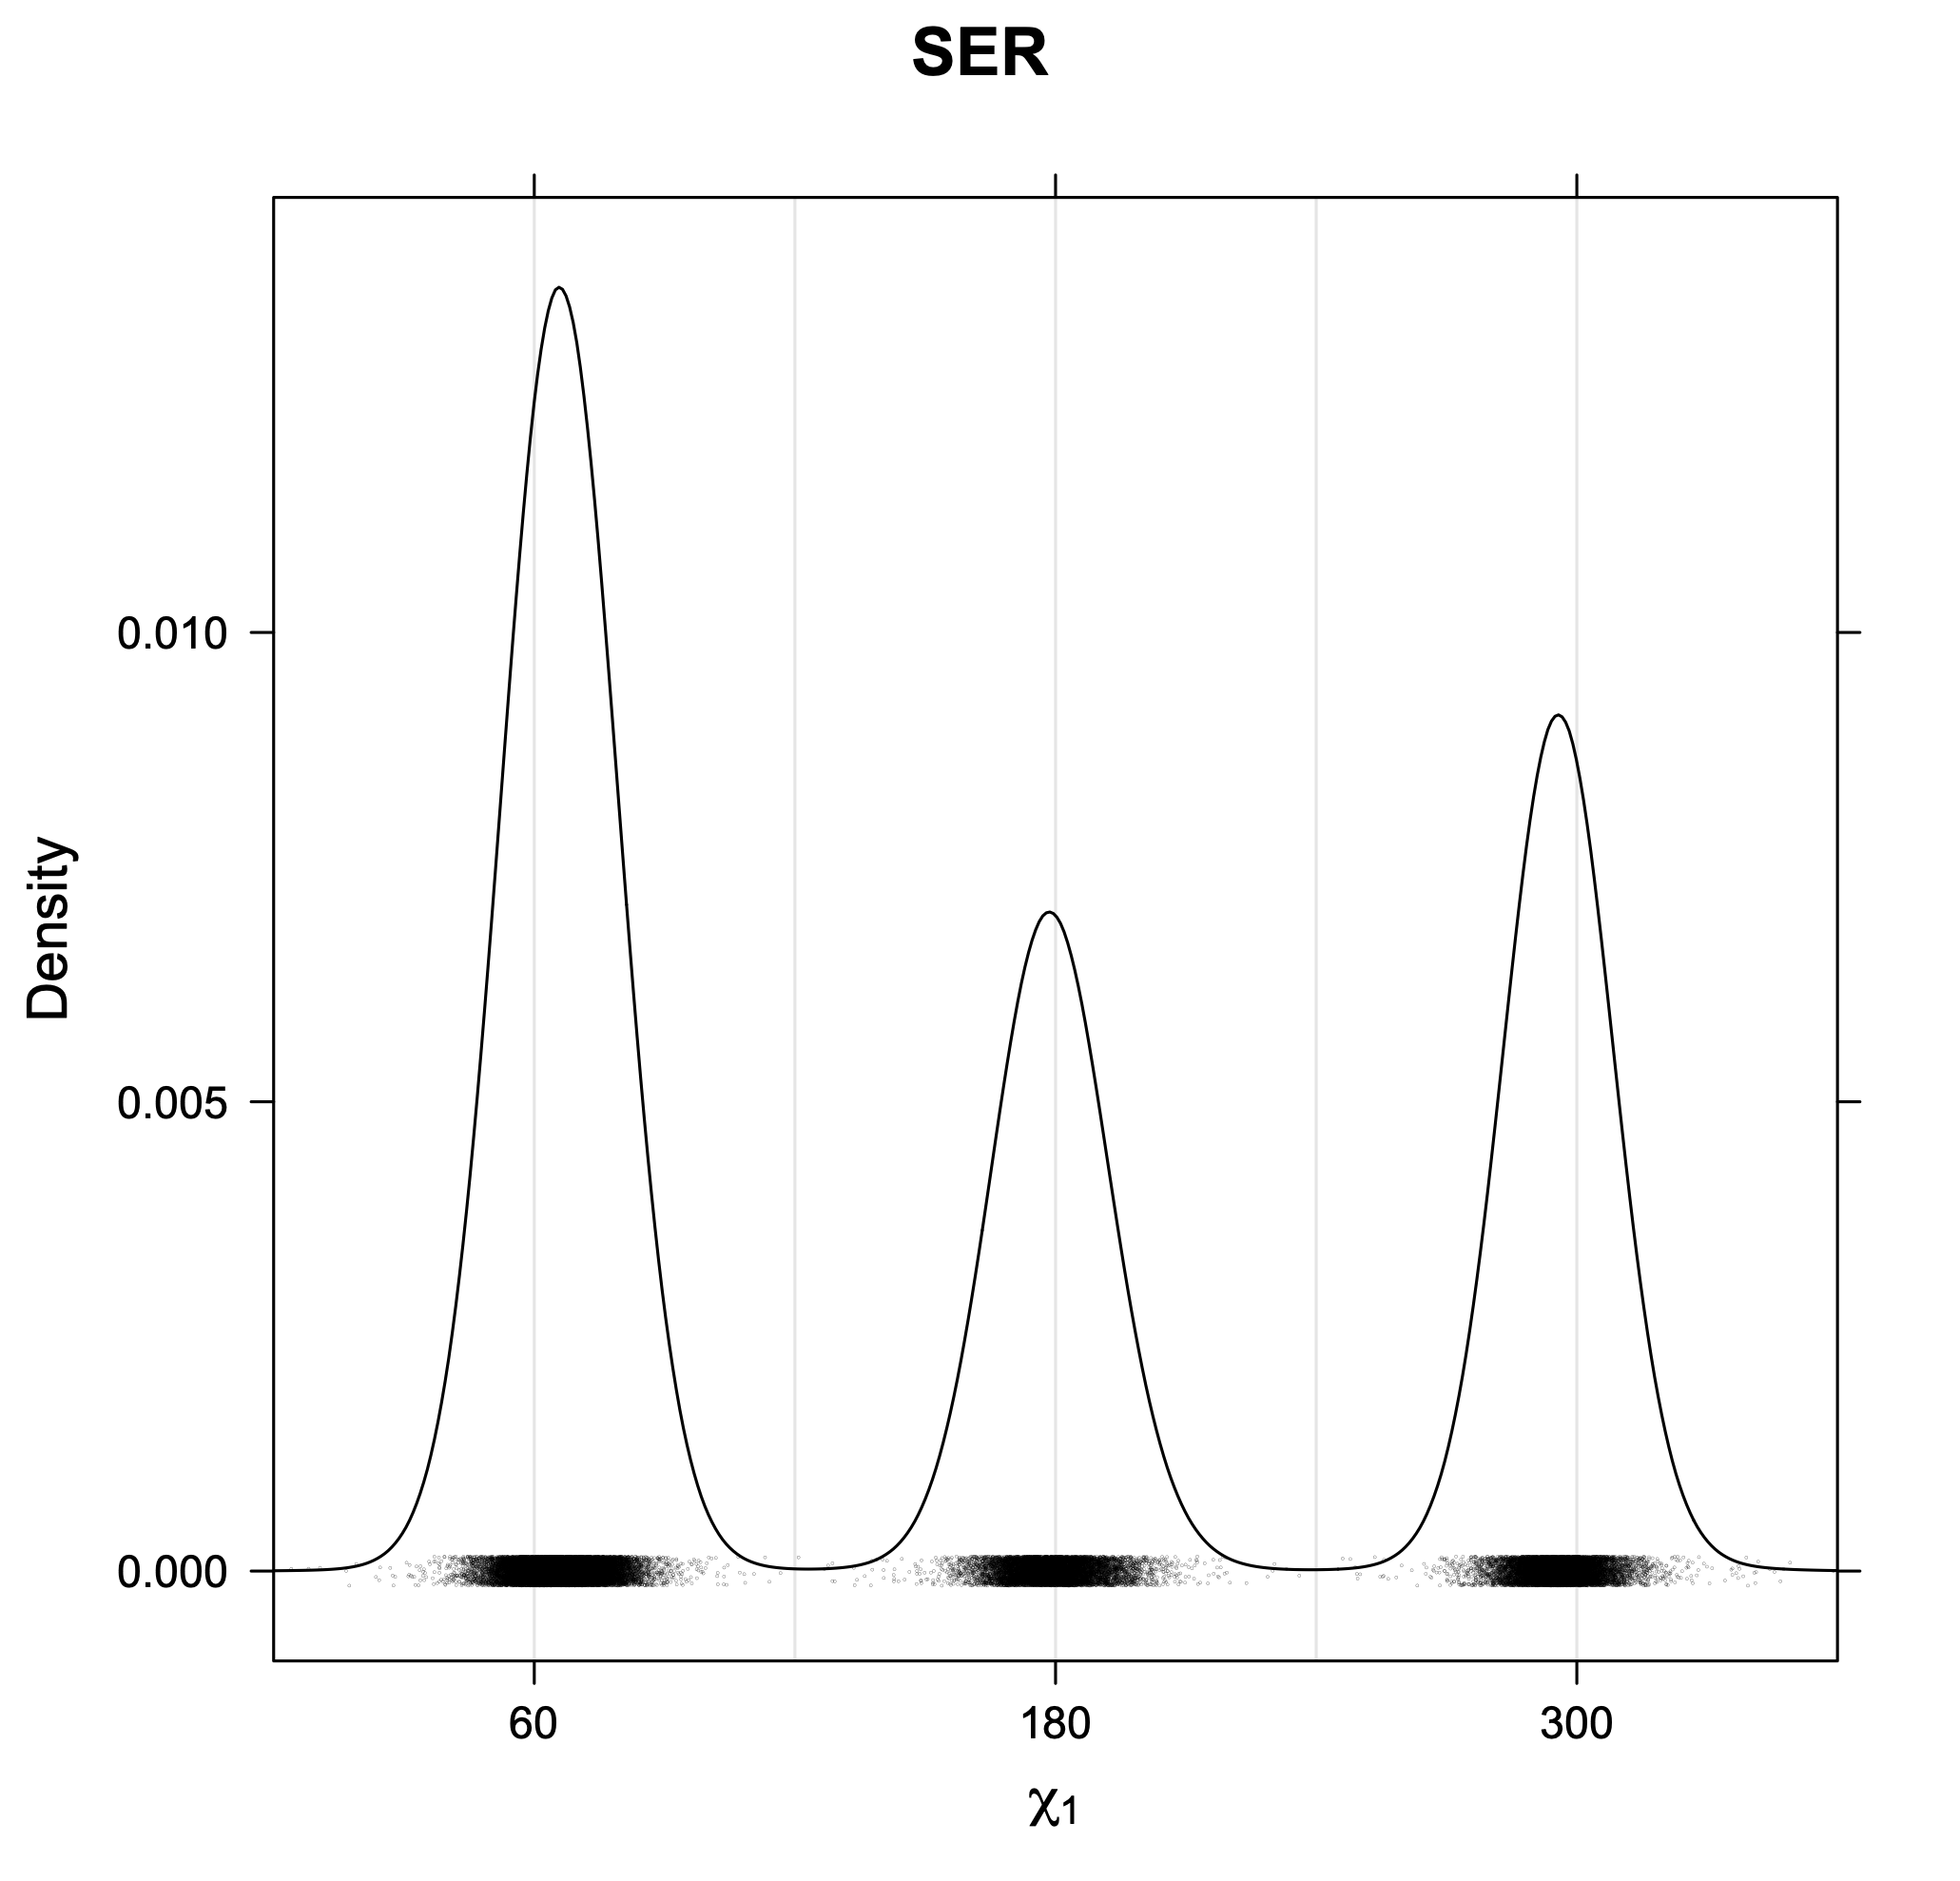
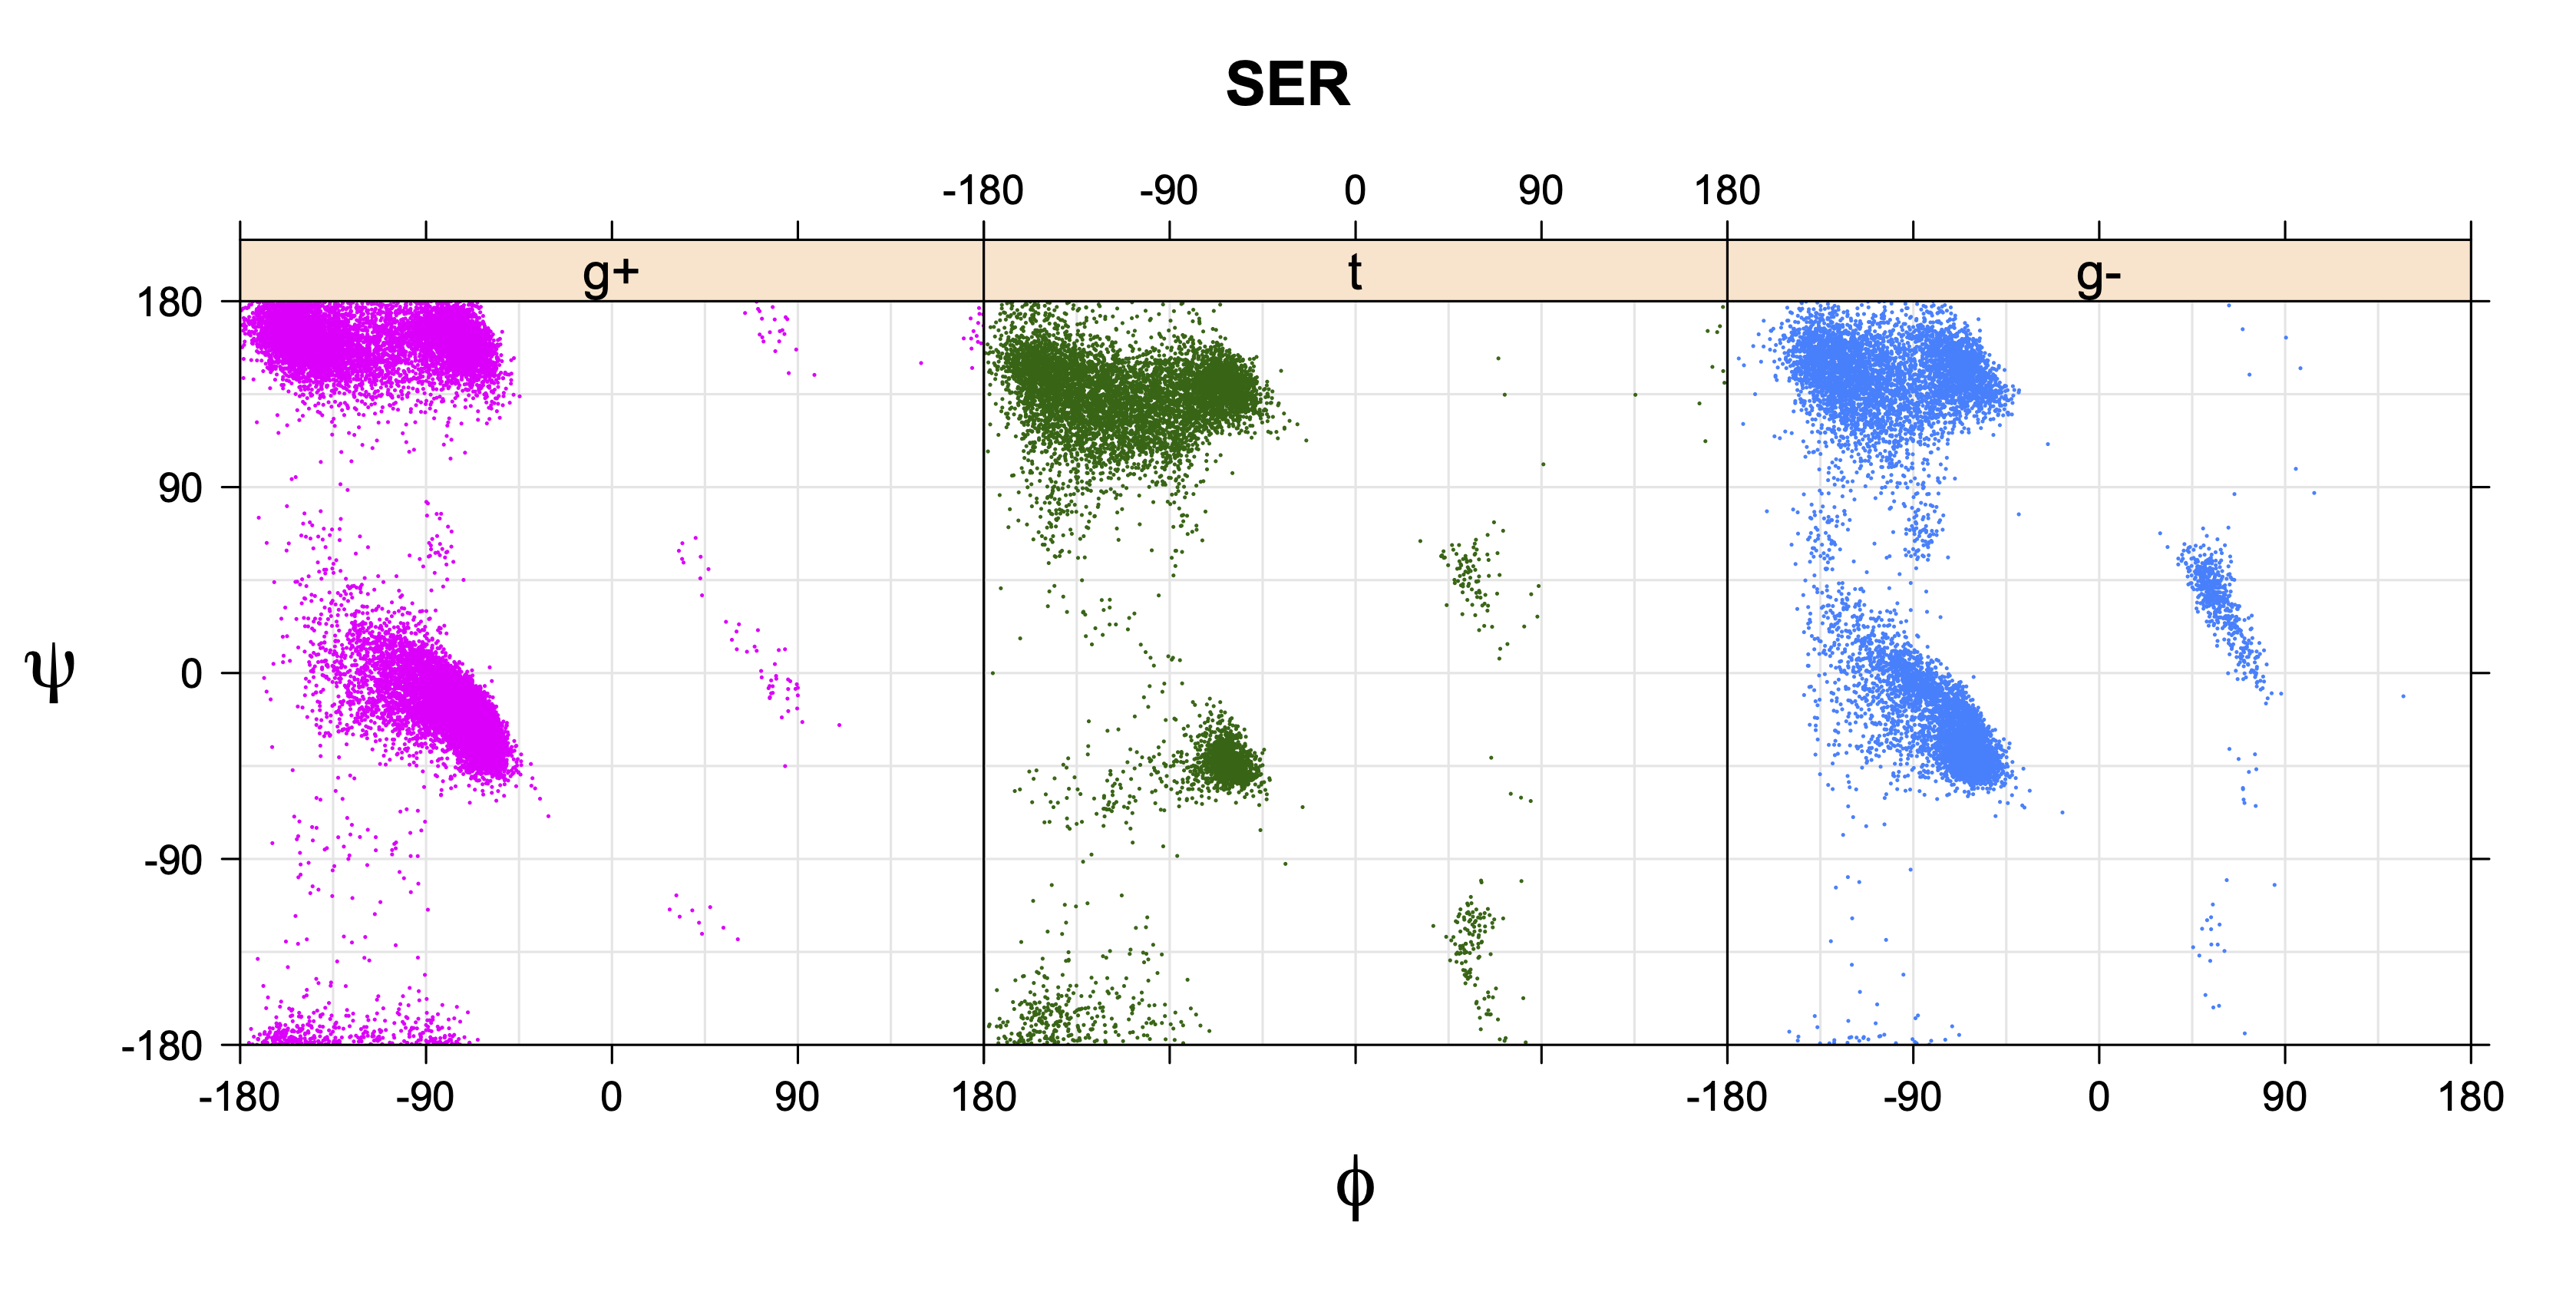
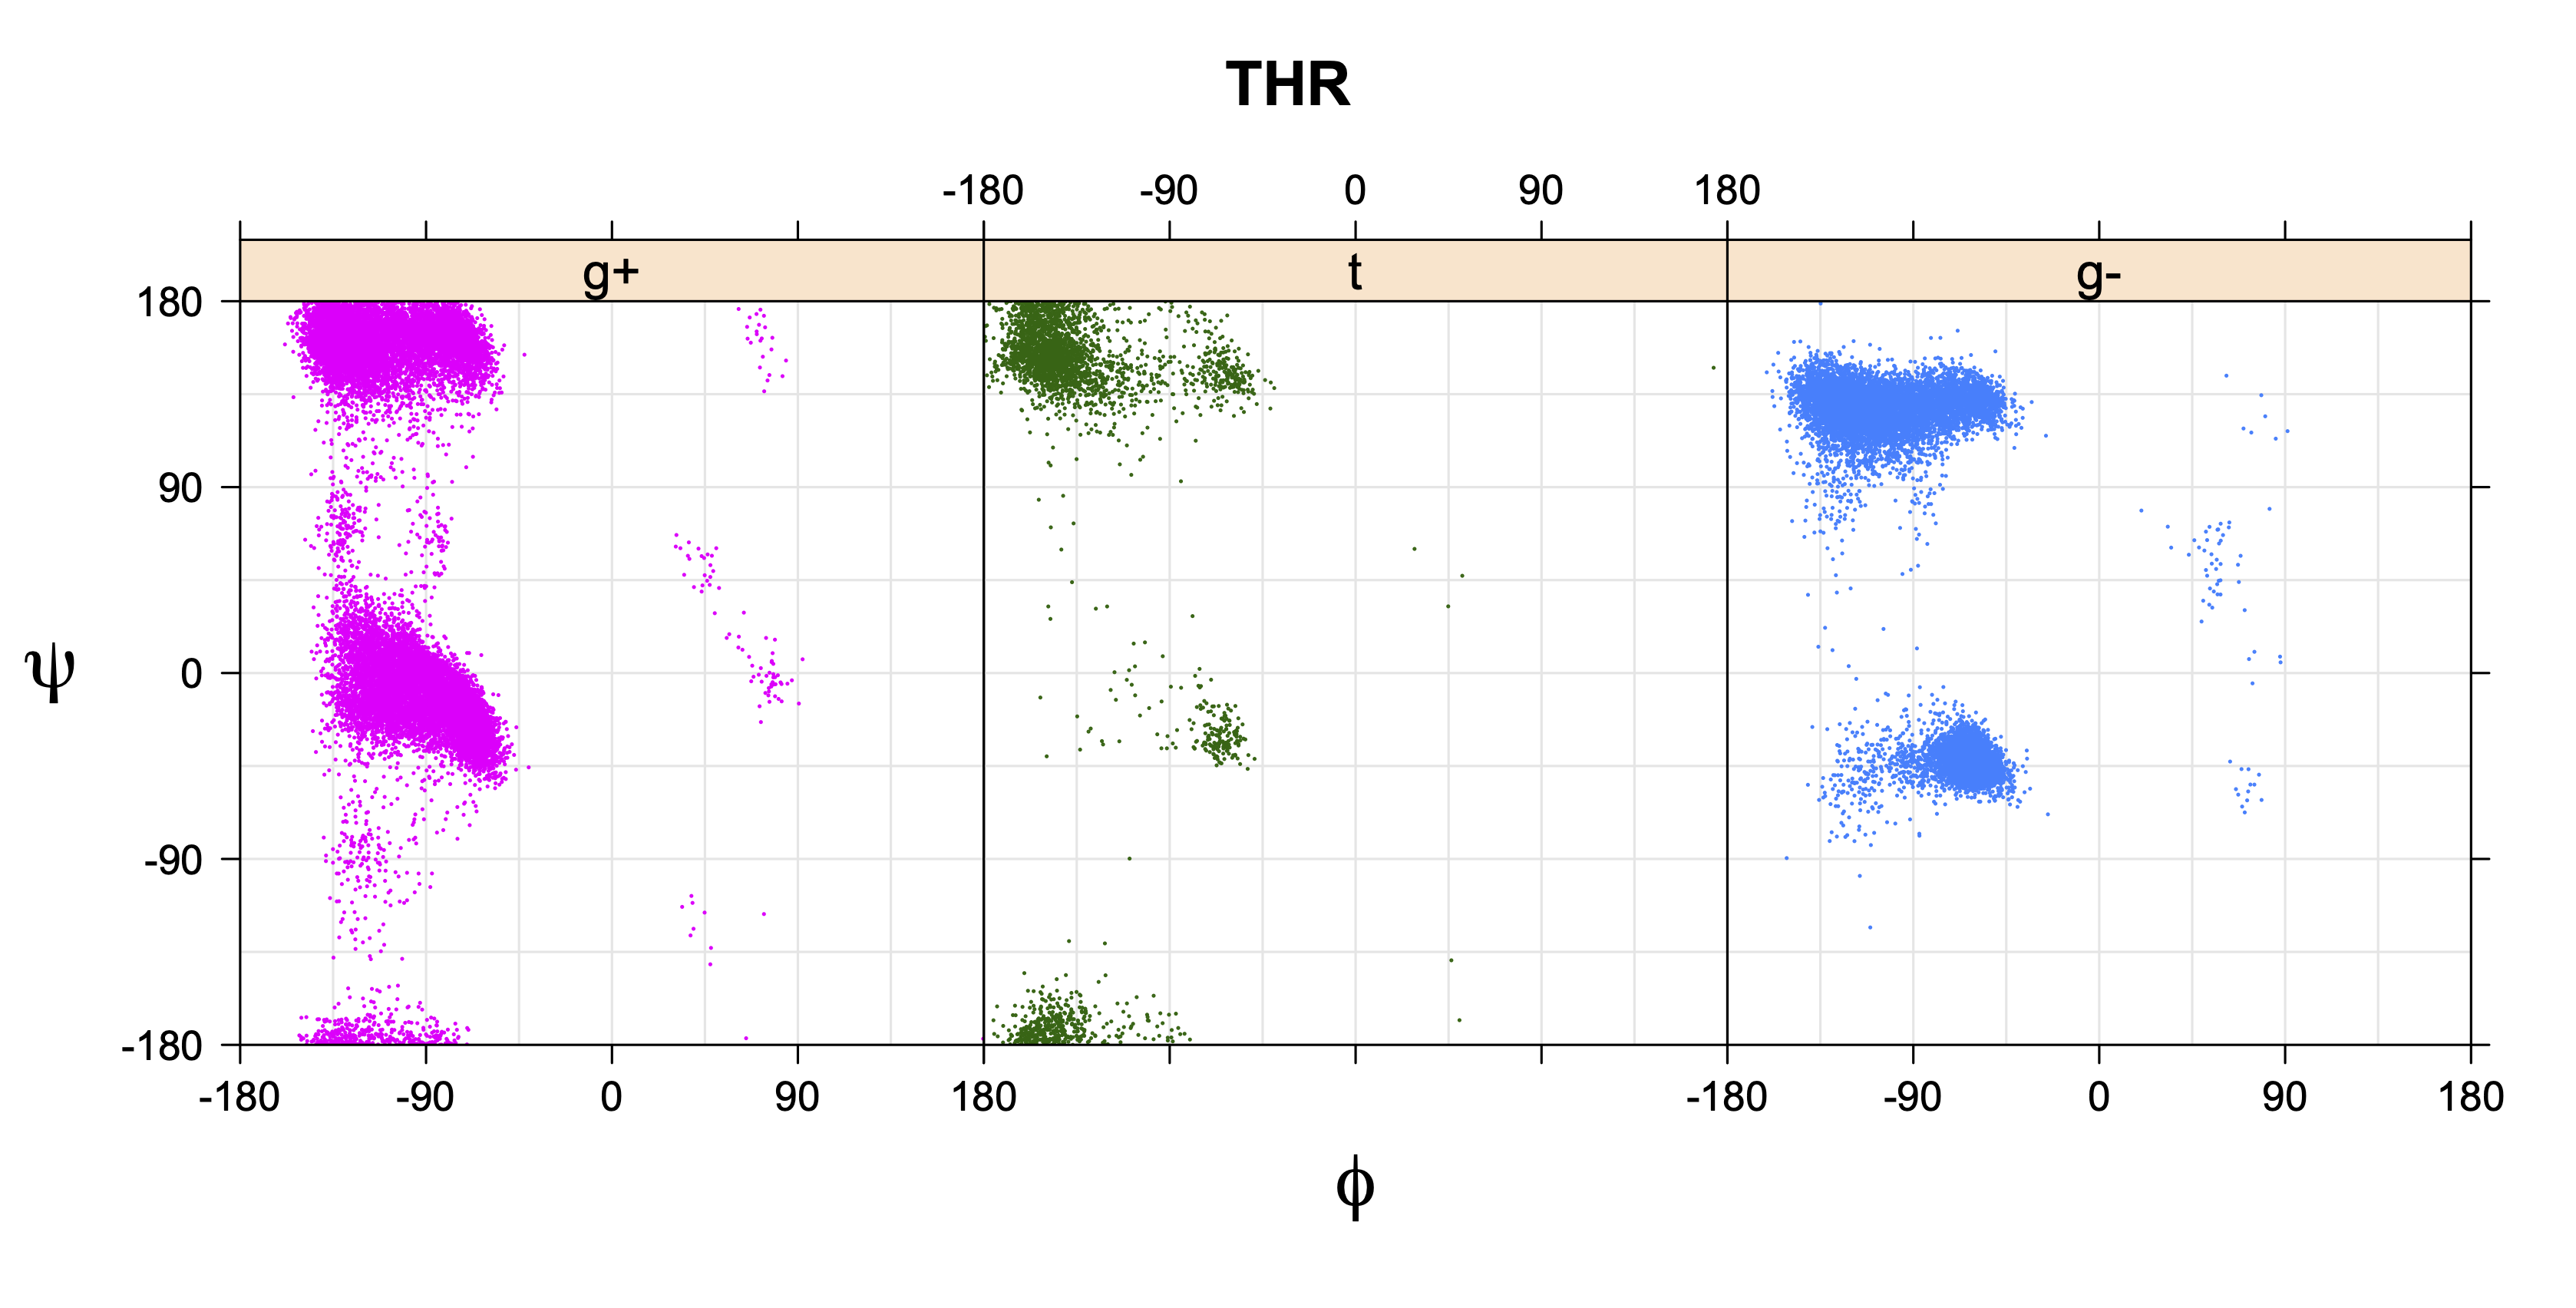
Rotamer populations for χ1 dihedrals for all side chains are contained in the following images. For most side chains, g- rotamers are the most common (-120°<χ1<0°). Exceptions include serine (g+ preferred) because of hydrogen bond interactions with C=O of residue i-1. Another is valine, where trans is the most populated rotamer because of backbone-dependent syn-pentane interactions at heavily populated regions of the φ,ψ map. Isoleucine is quite similar to valine, but since the χ1 is defined differently for isoleucine (CG1 at χ1, CG2 at χ1-120°) than in valine (CG1 at χ1, and CG2 at χ1+120°), the equivalent rotamer for Ile is g-. Threonine has a χ1 angle defined like that of isoleucine. Thr is like Ile in its χ1 distribution, but in addition, like serine it has a large increase in g+ rotamers because of hydrogen bonding effects.


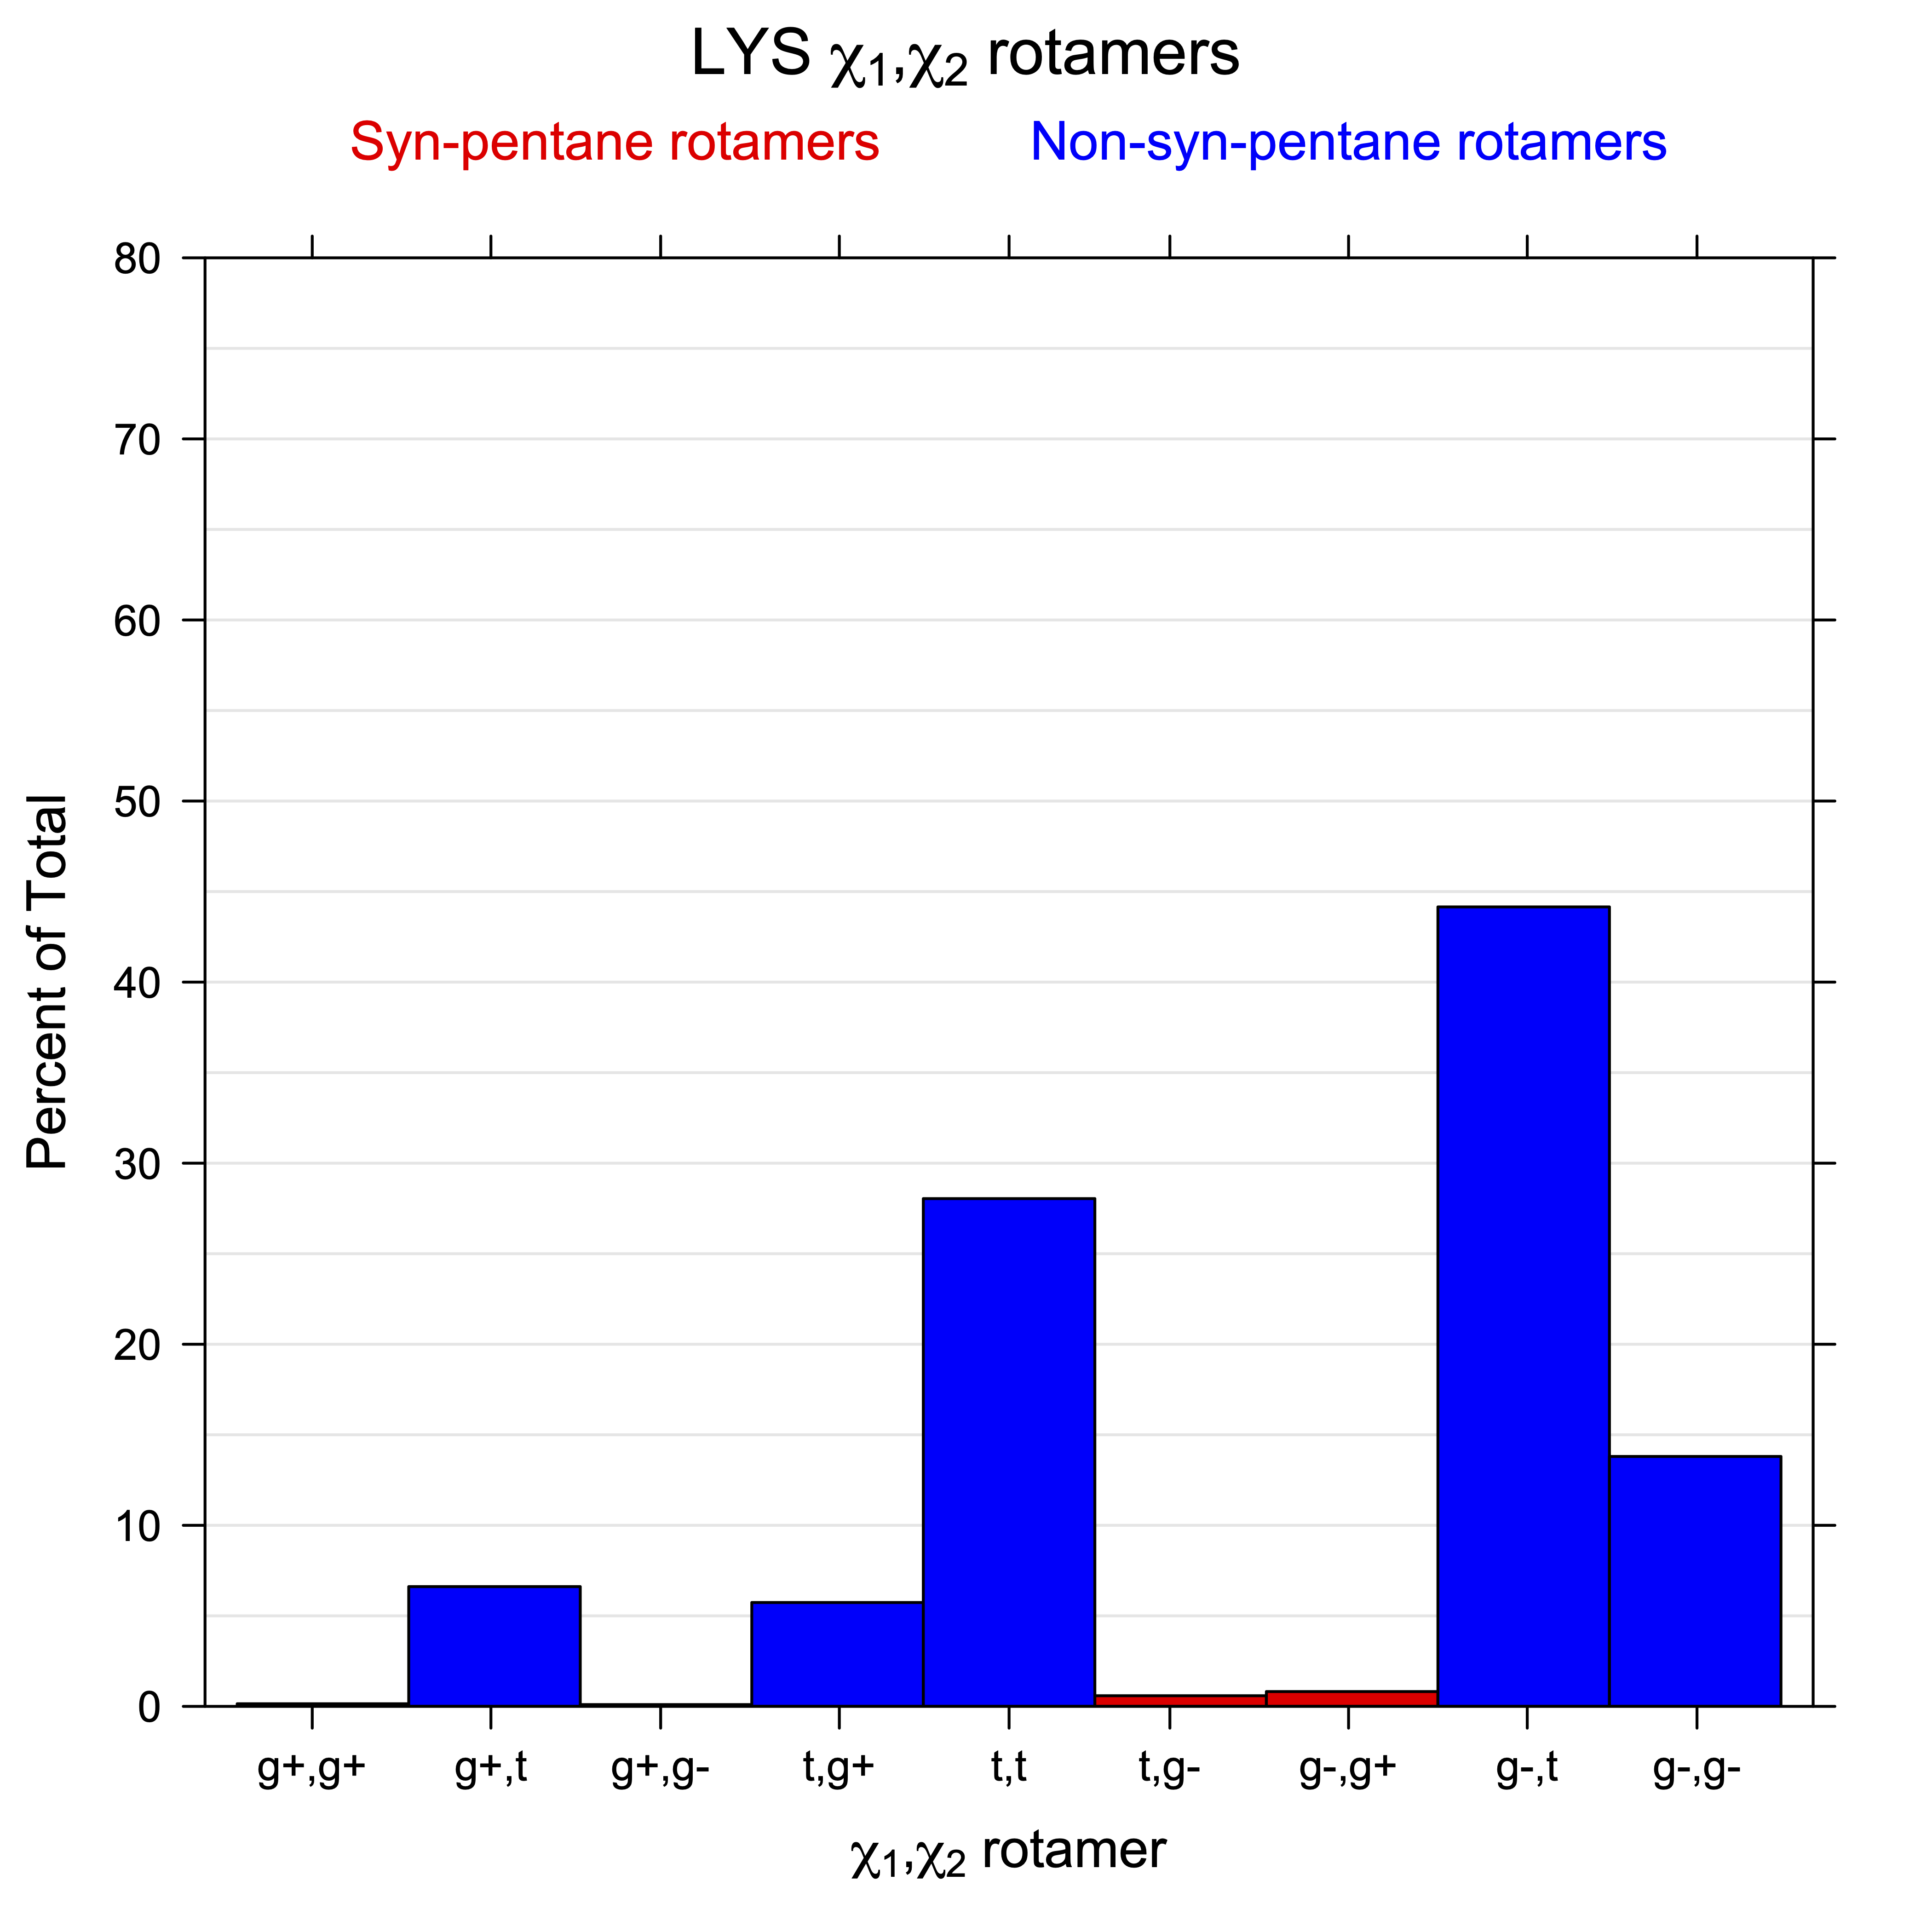
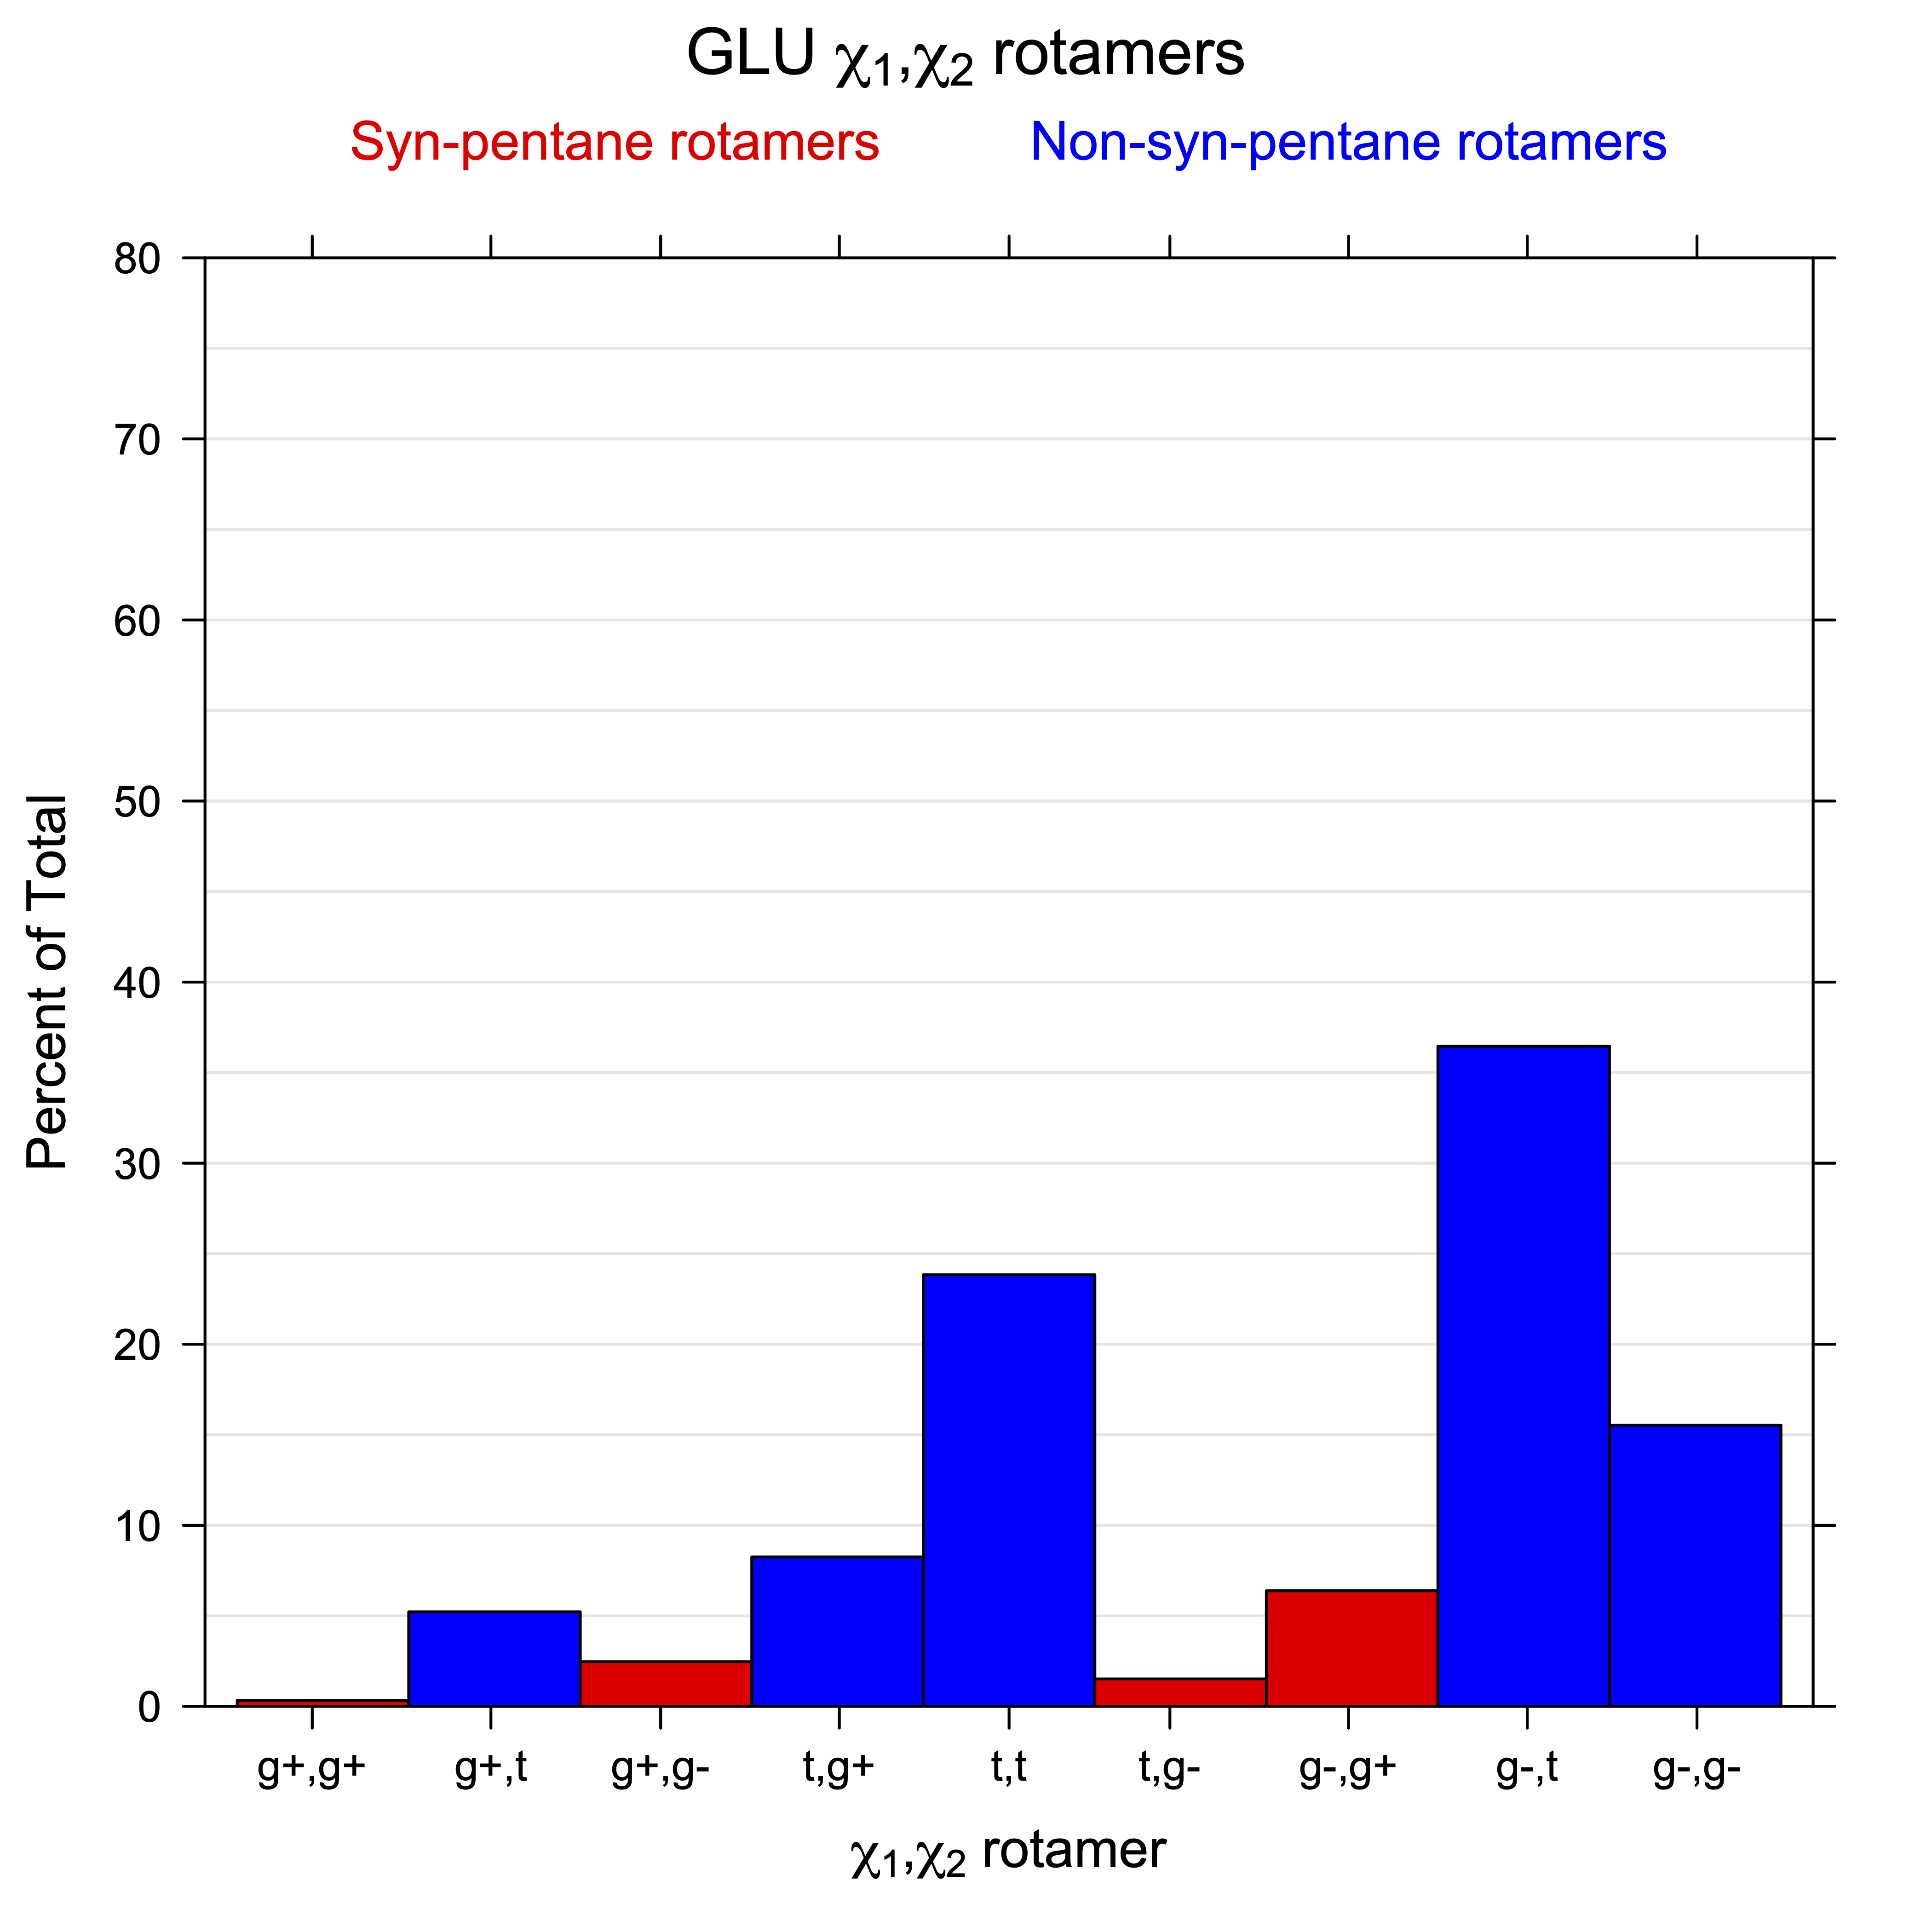
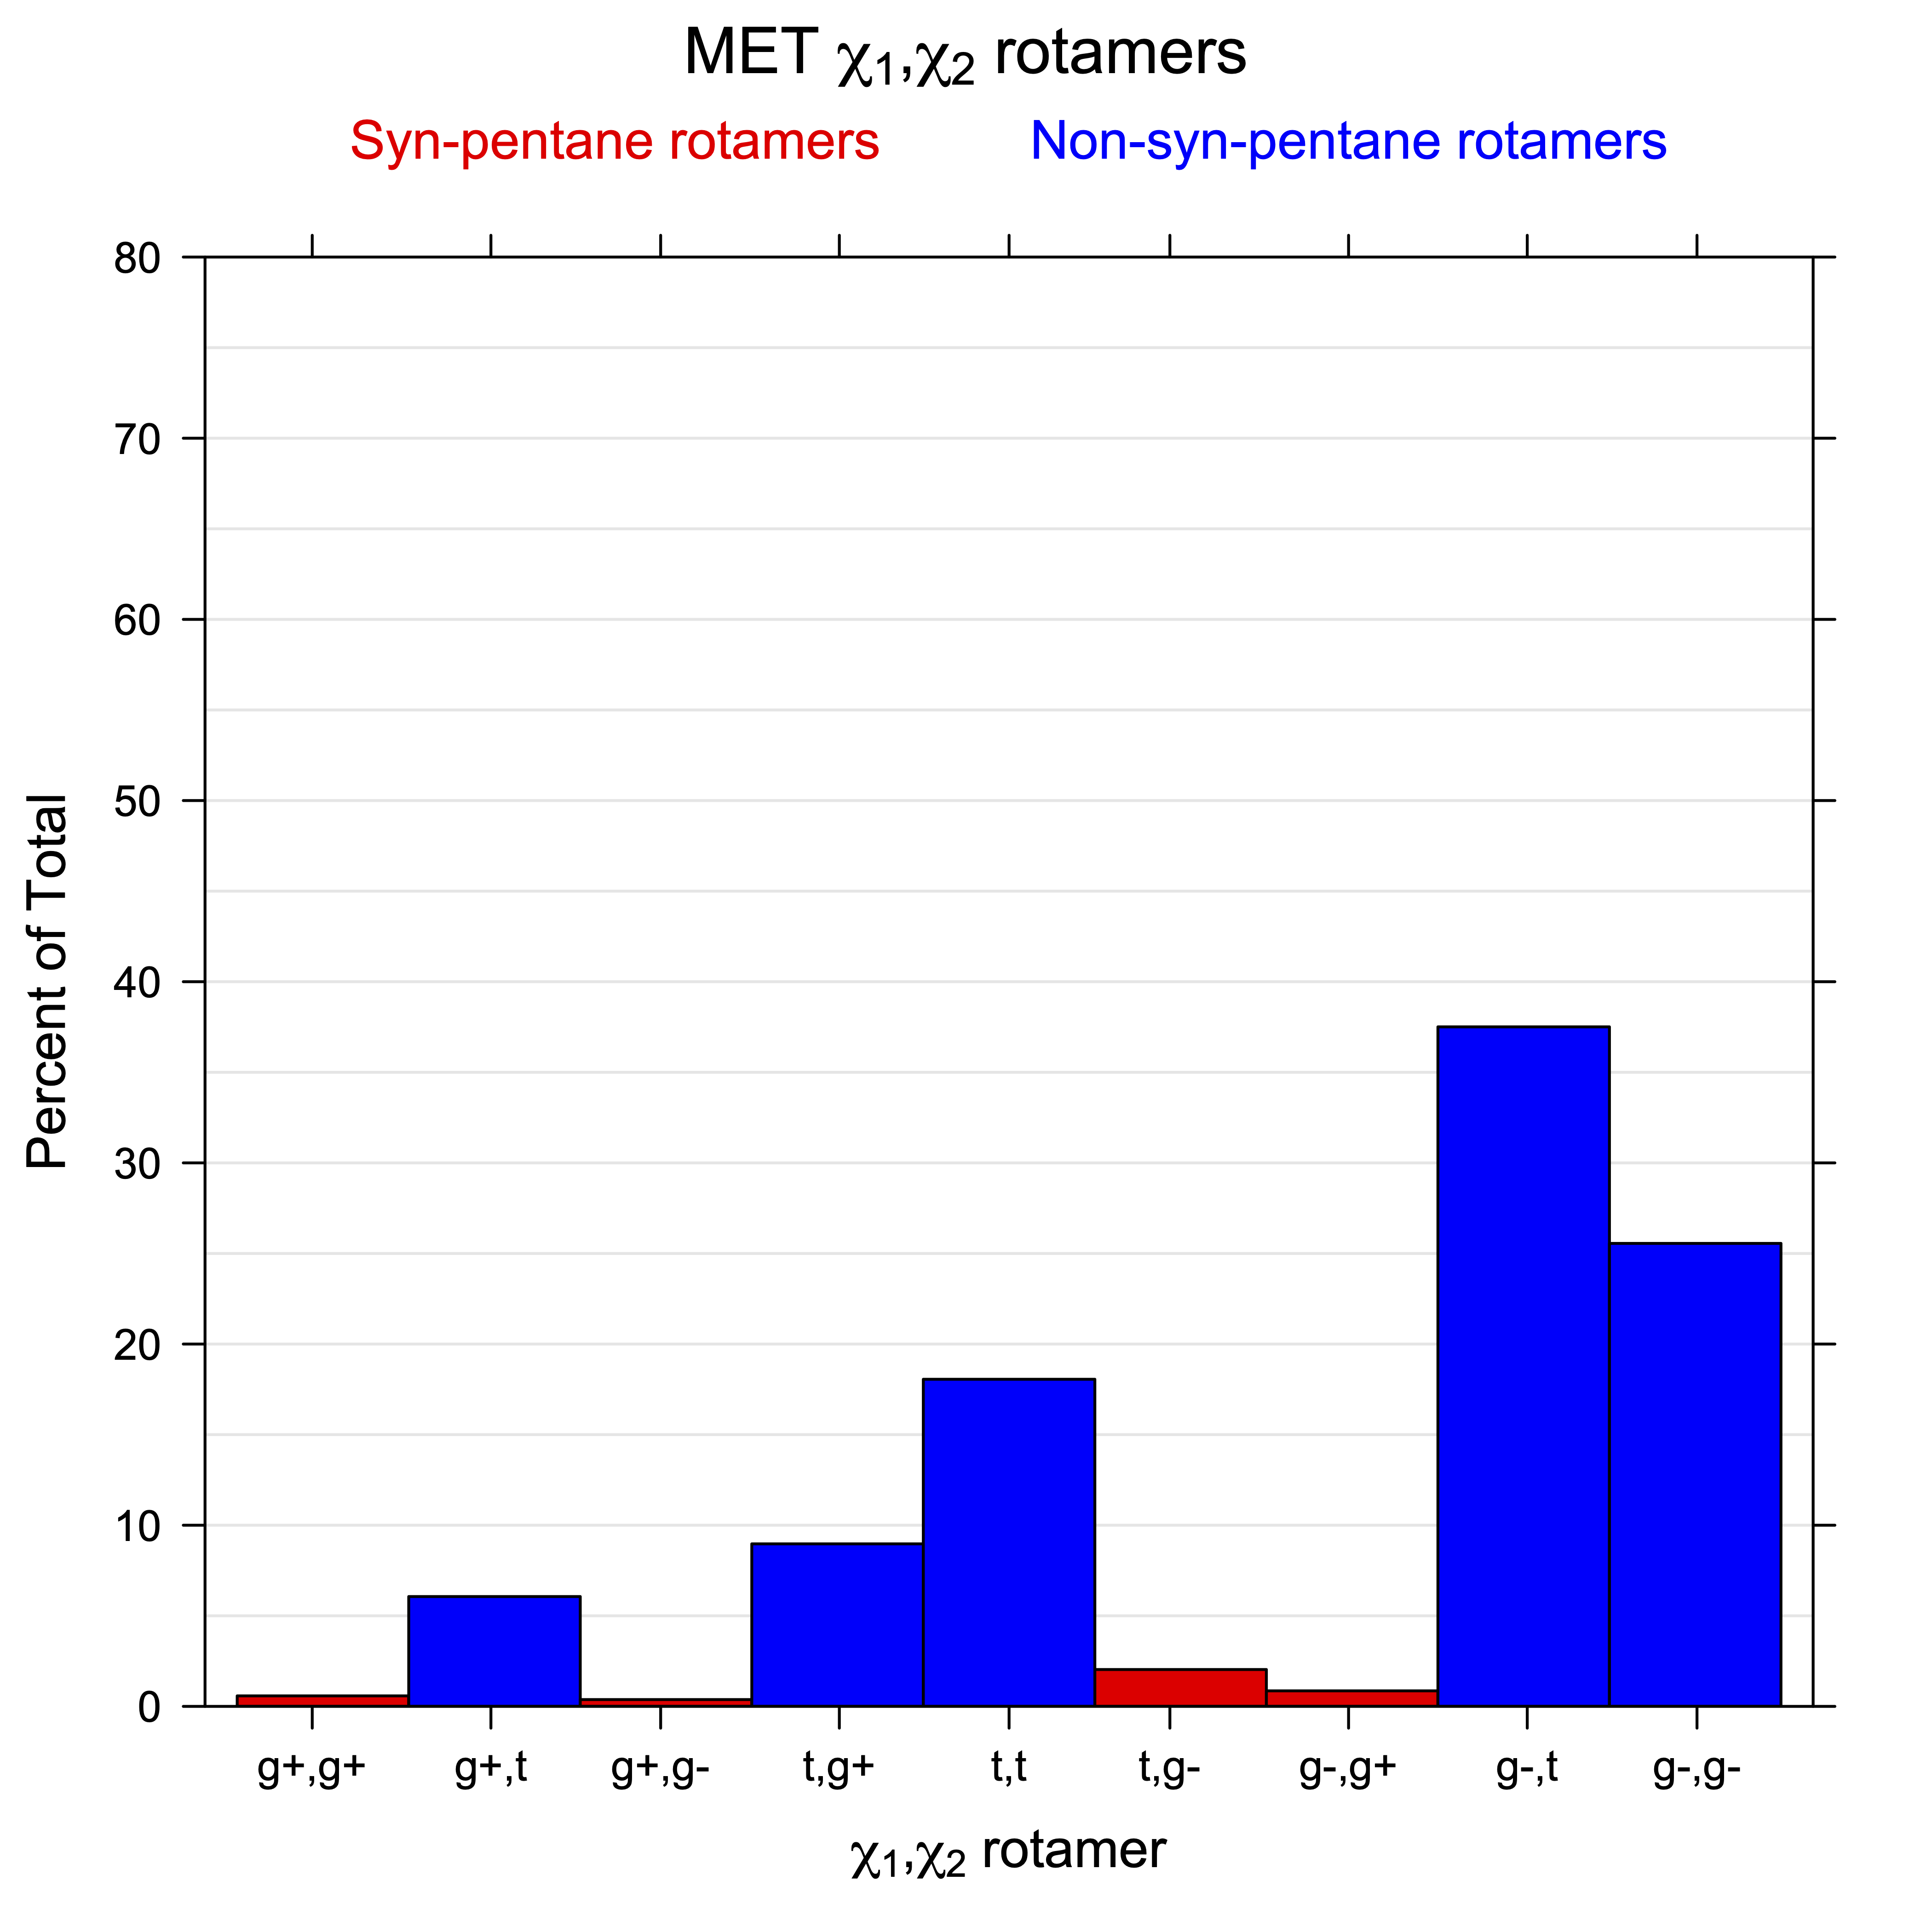
2. Histograms of r1, r2 Rotamer Populations
For all side chain types with sp3-sp3 bonds at χ1 and χ2 (Arg, Lys, Glu, Gln, Met, Ile, Leu), we can plot the r1,r2 rotamer populations as histograms. In all of these figures, syn-pentane rotamers are represented by solid red bars and non-syn-pentane rotamers are represented by blue bars.


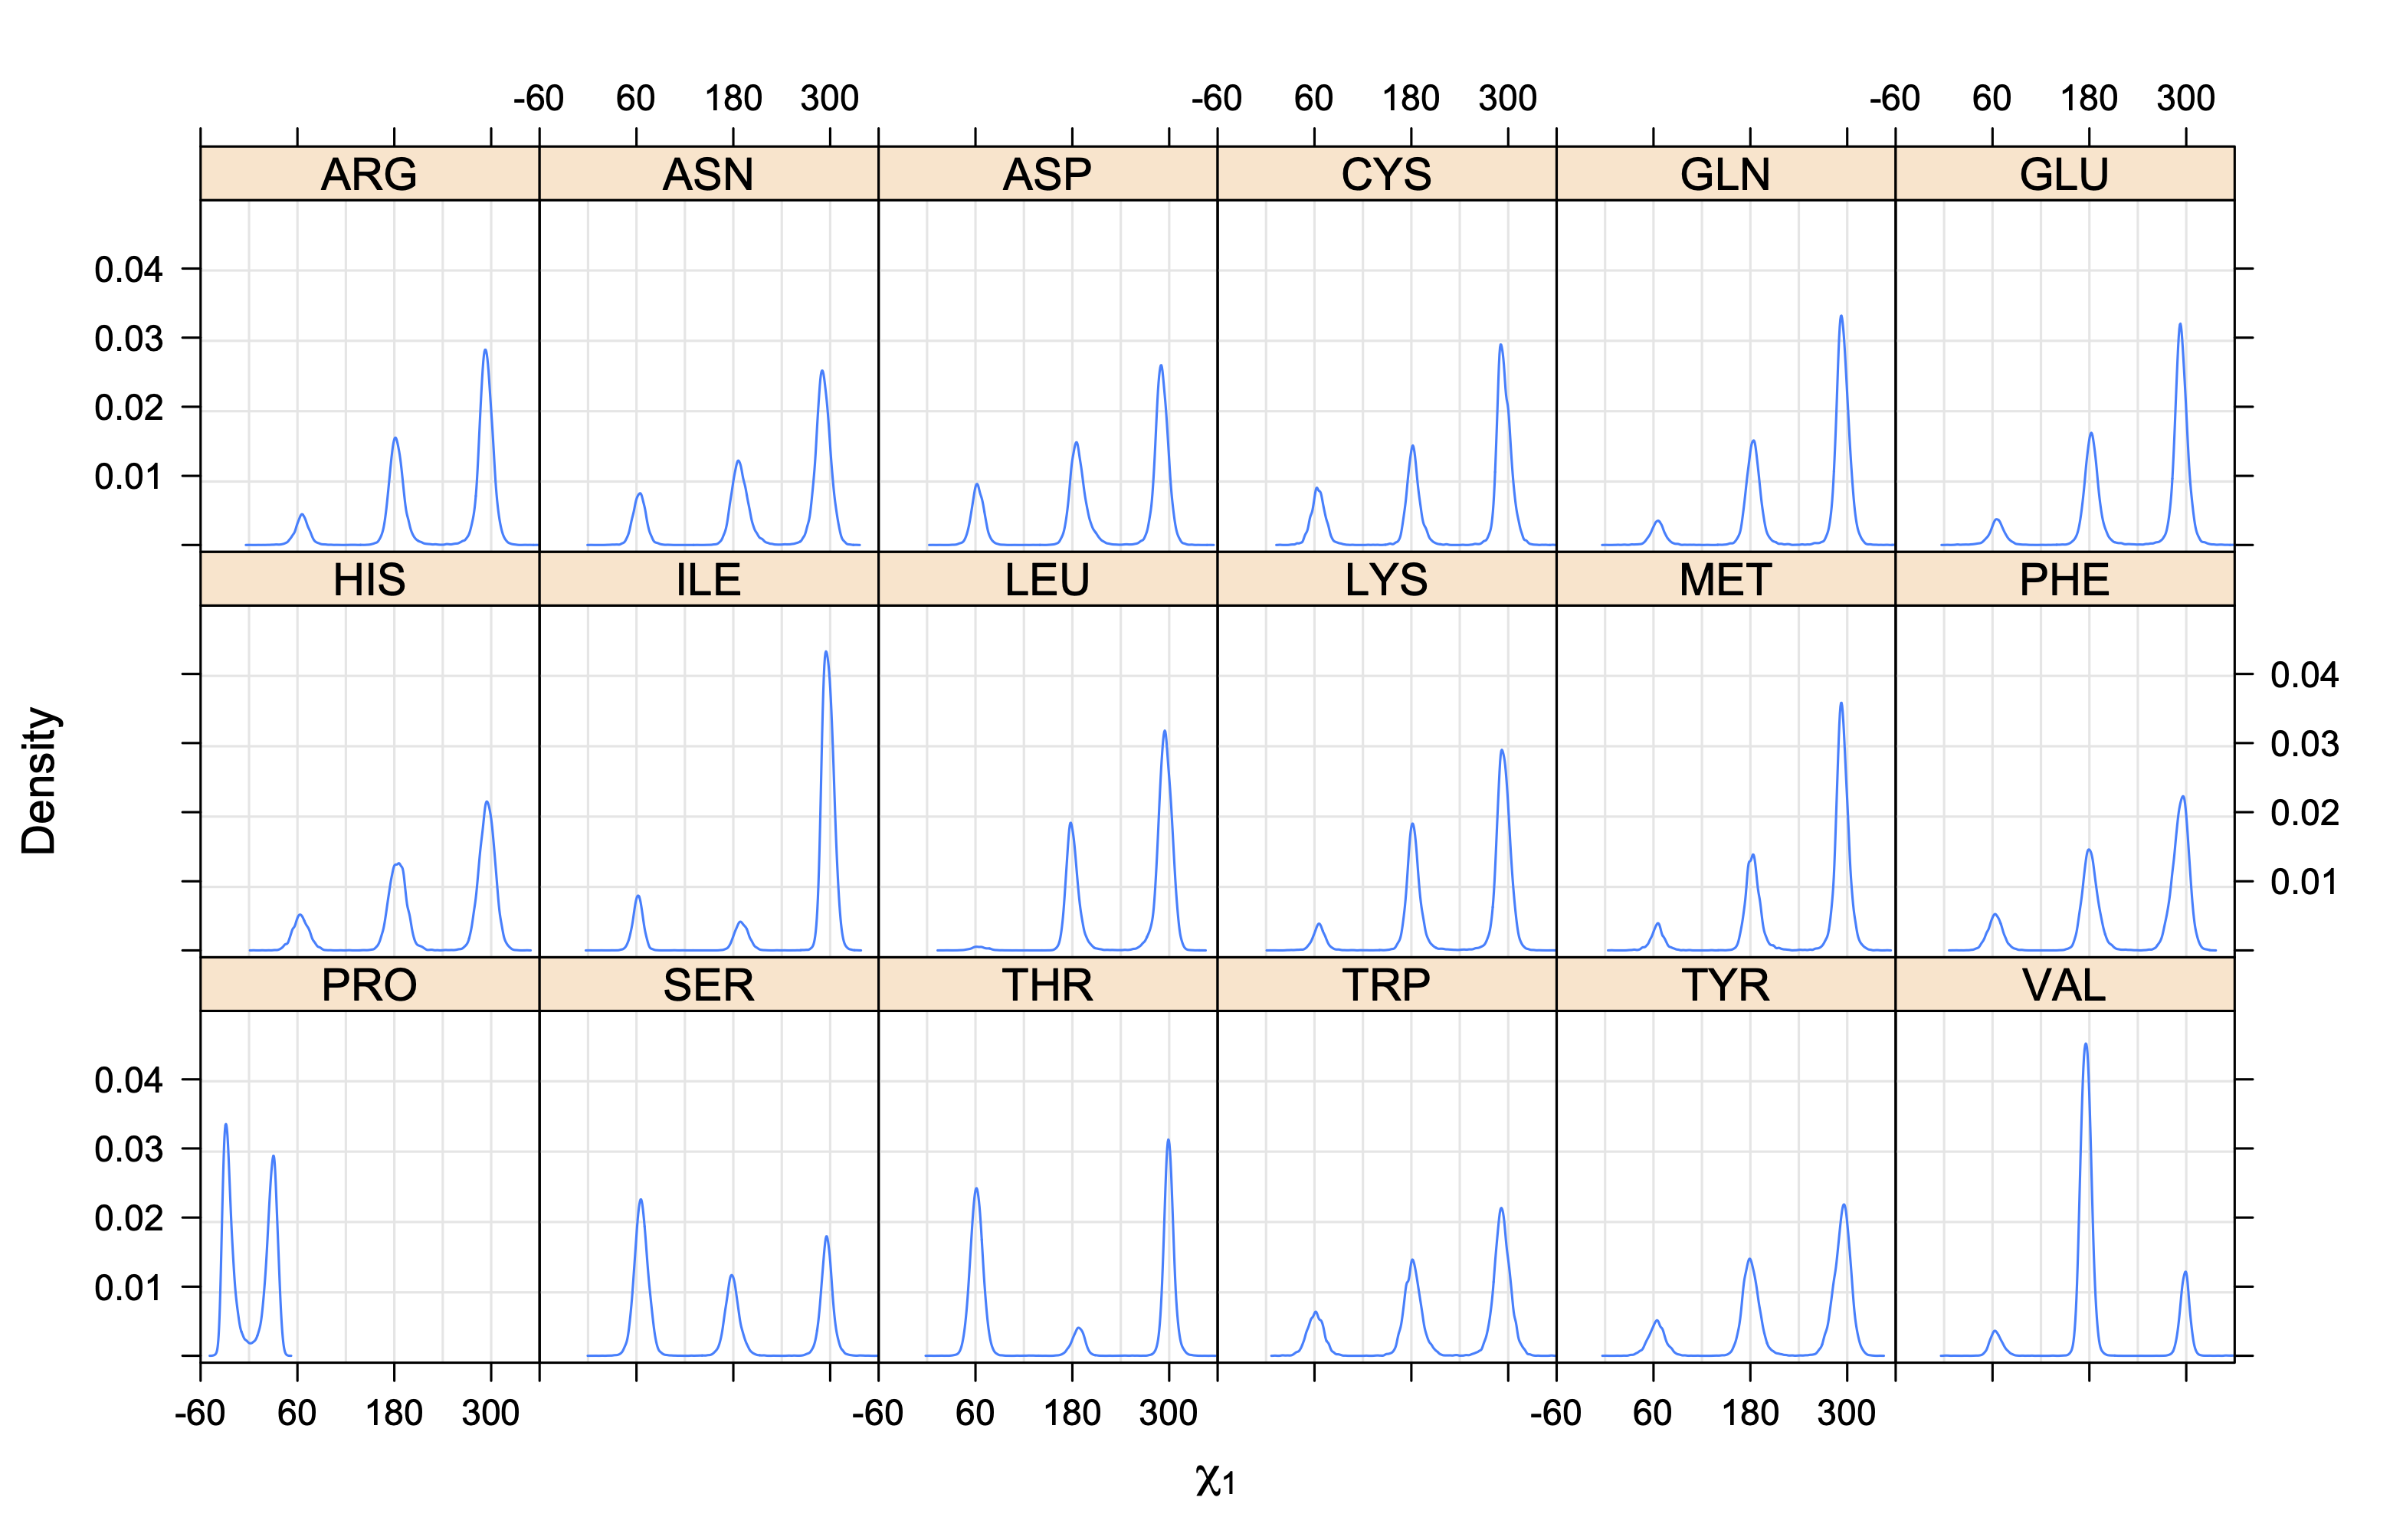
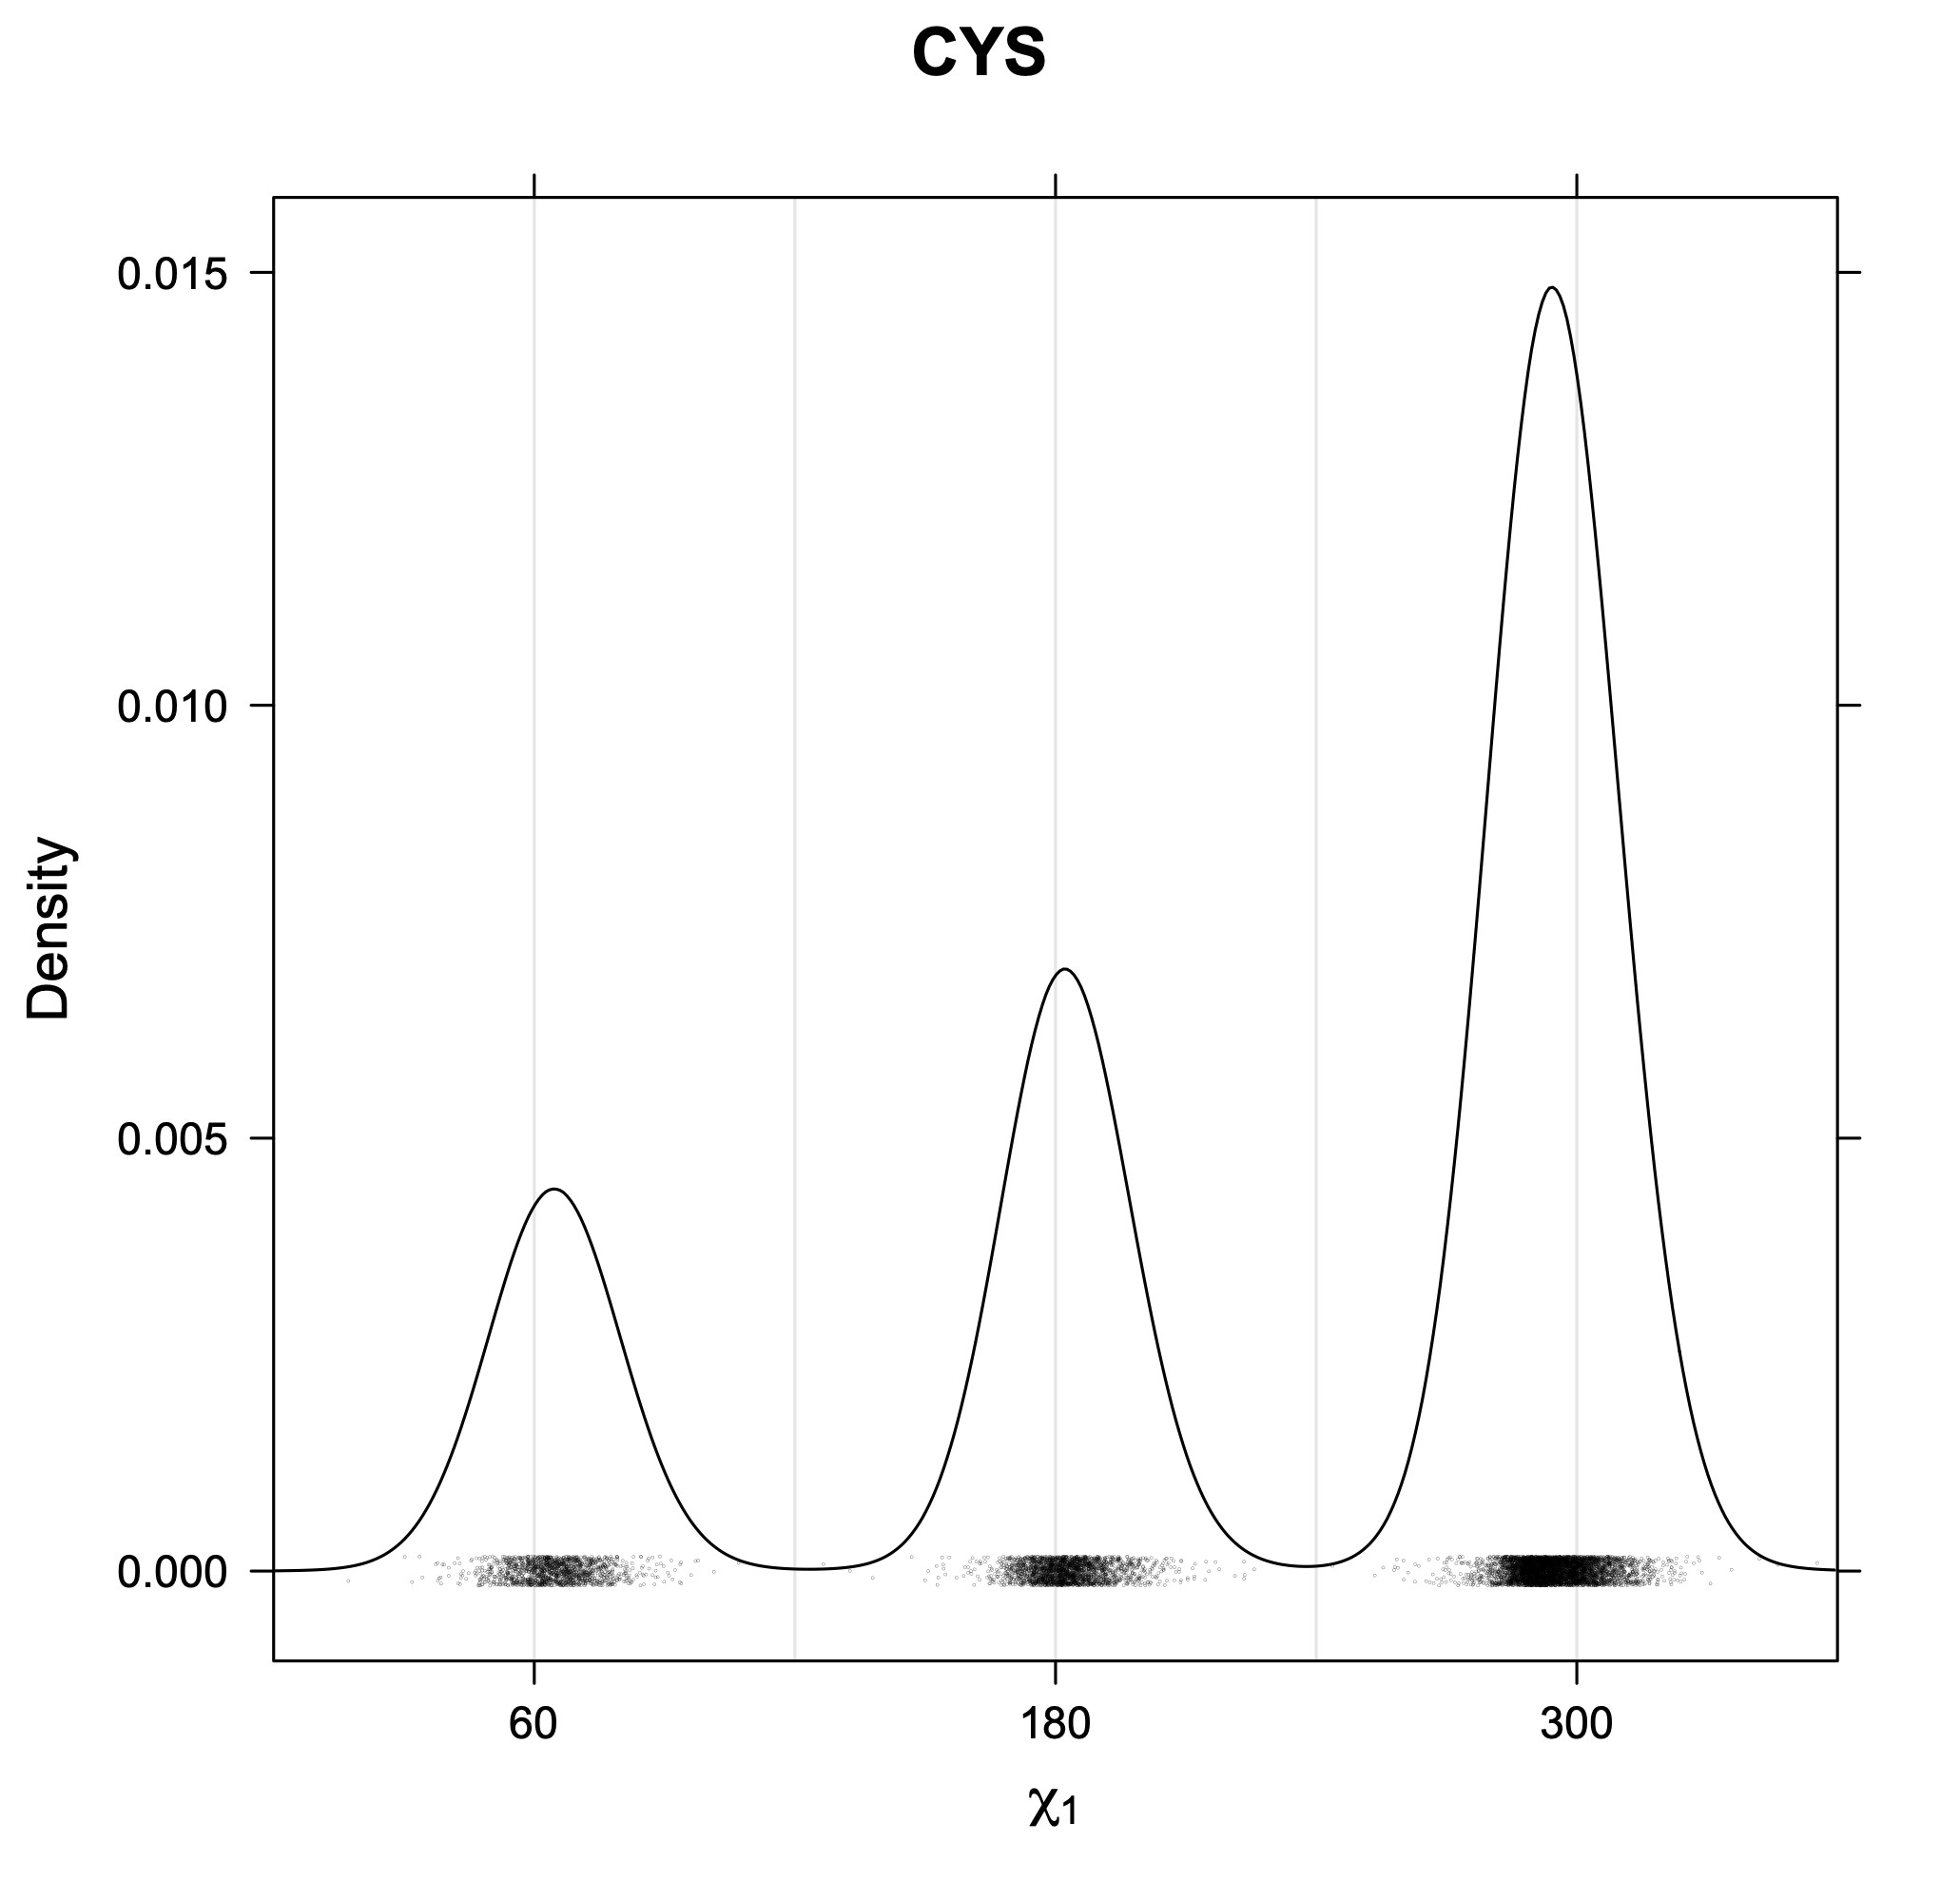
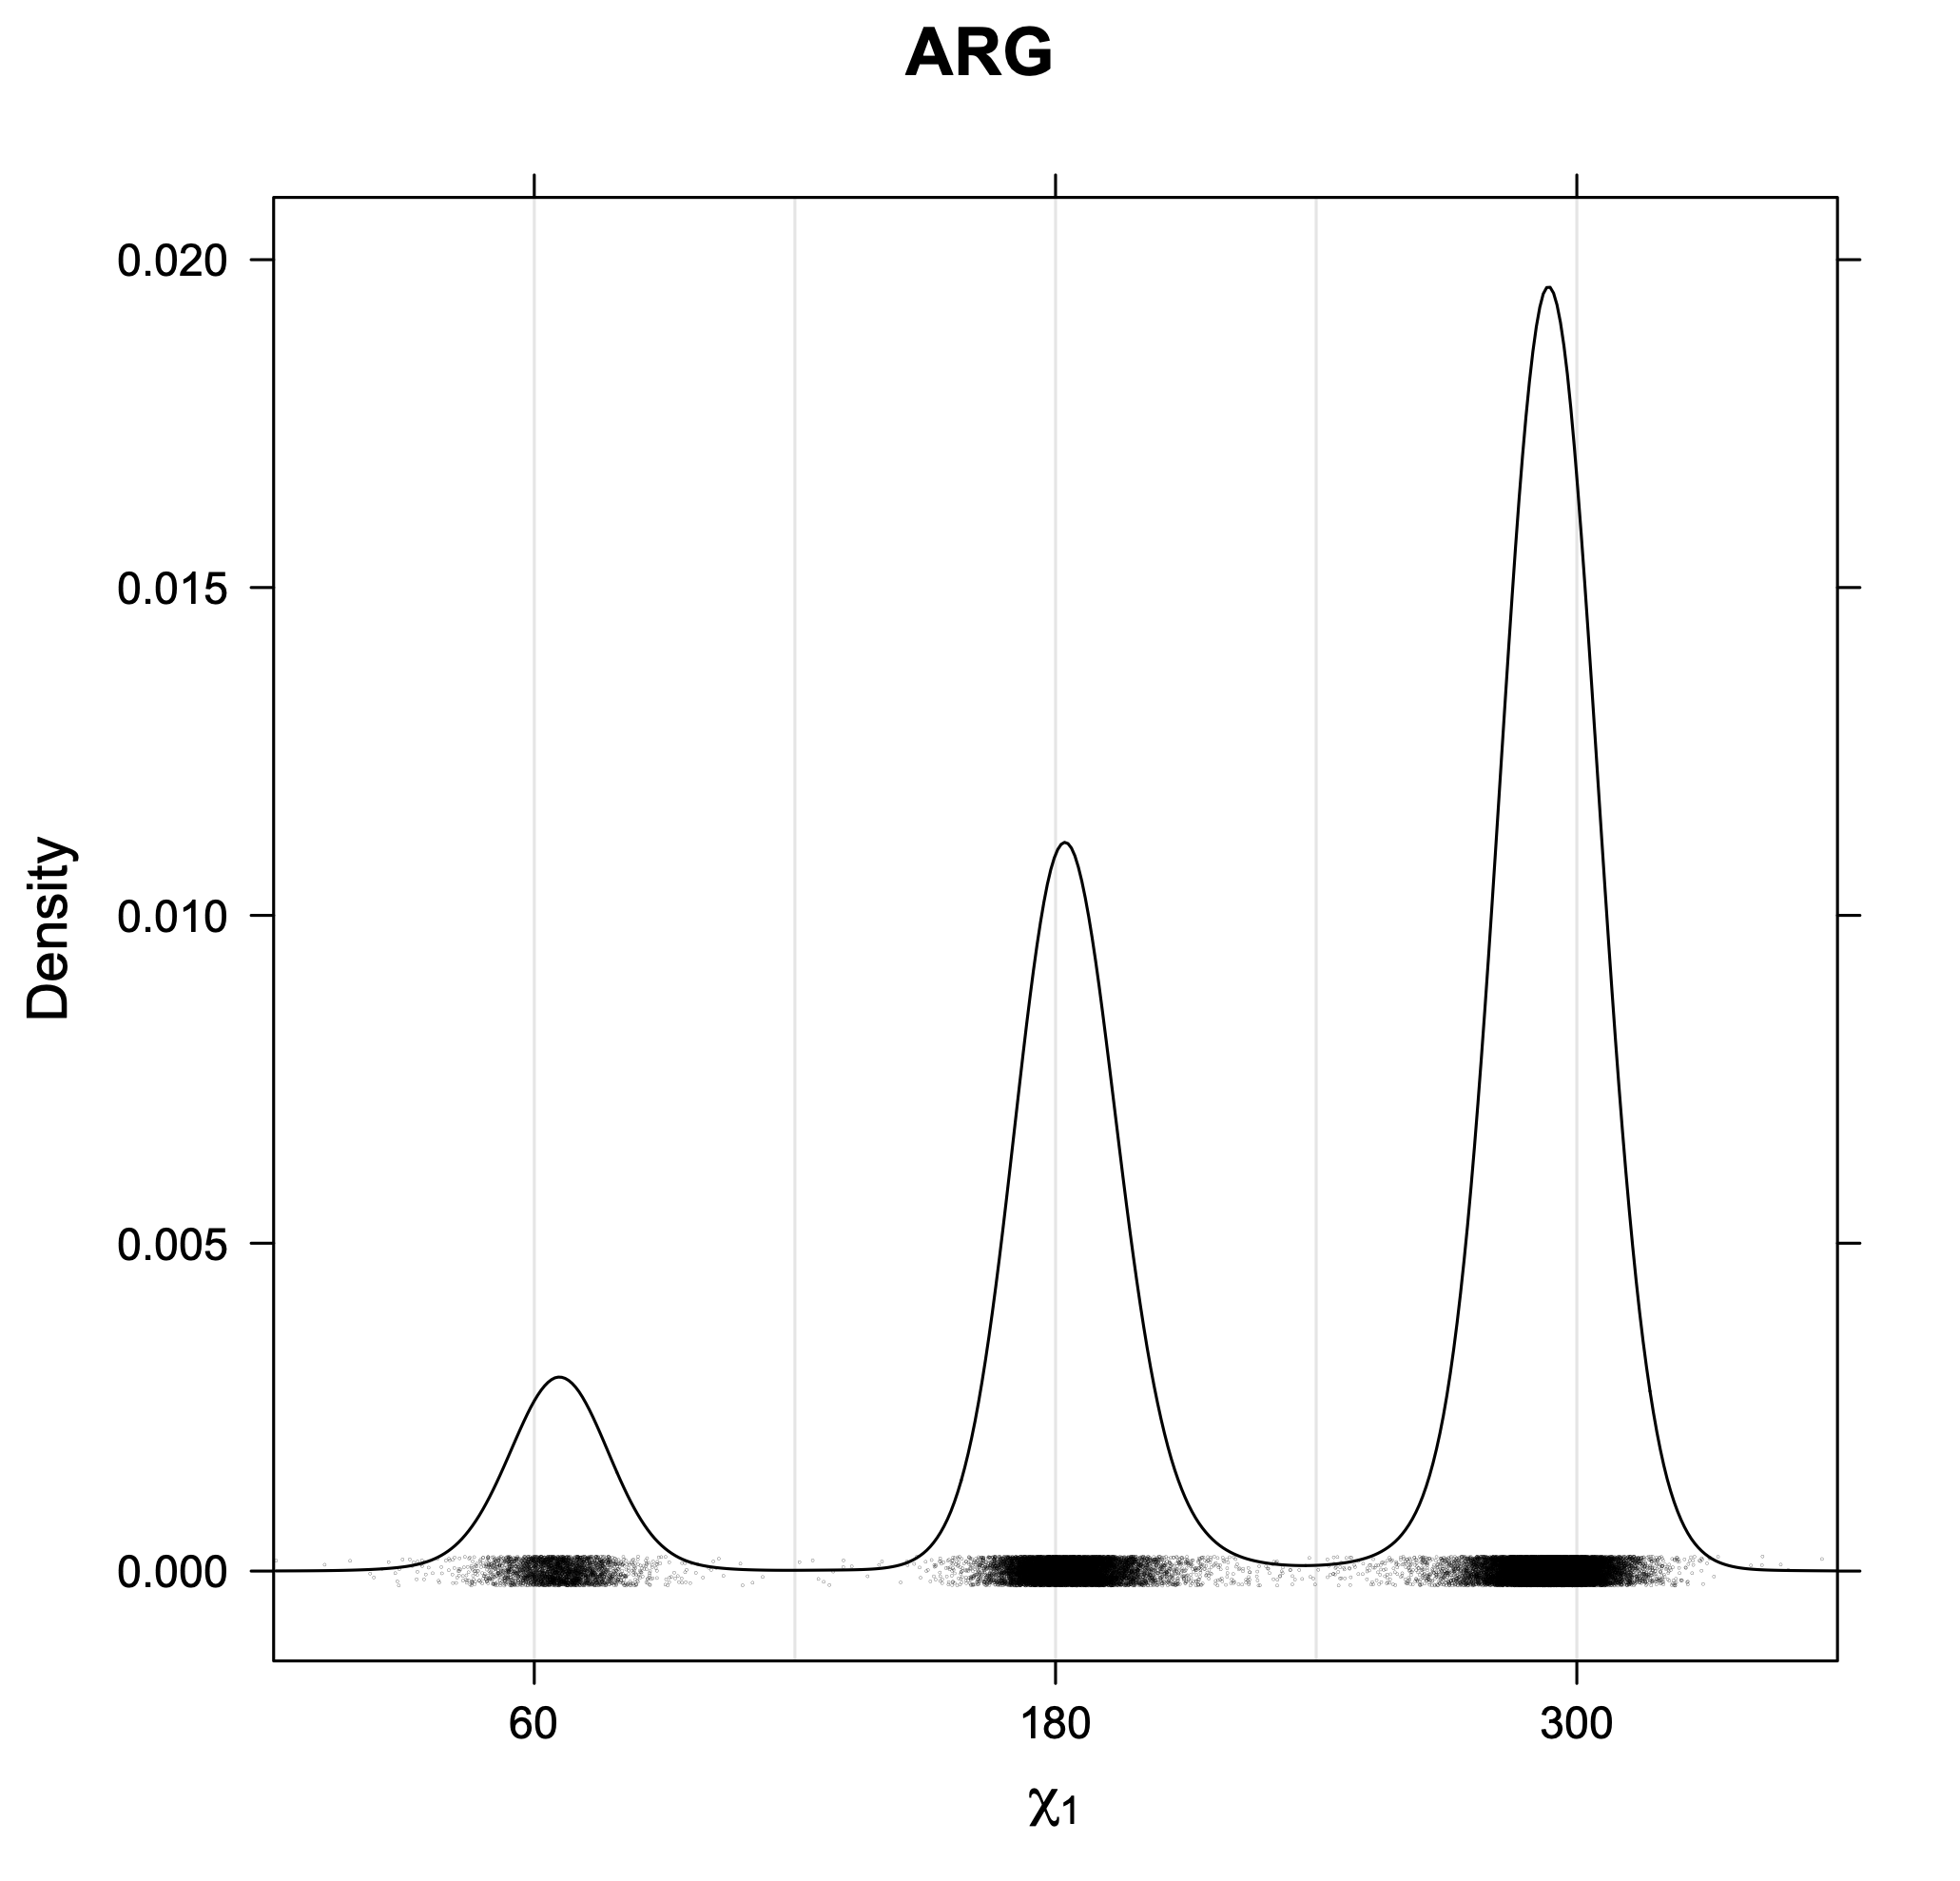
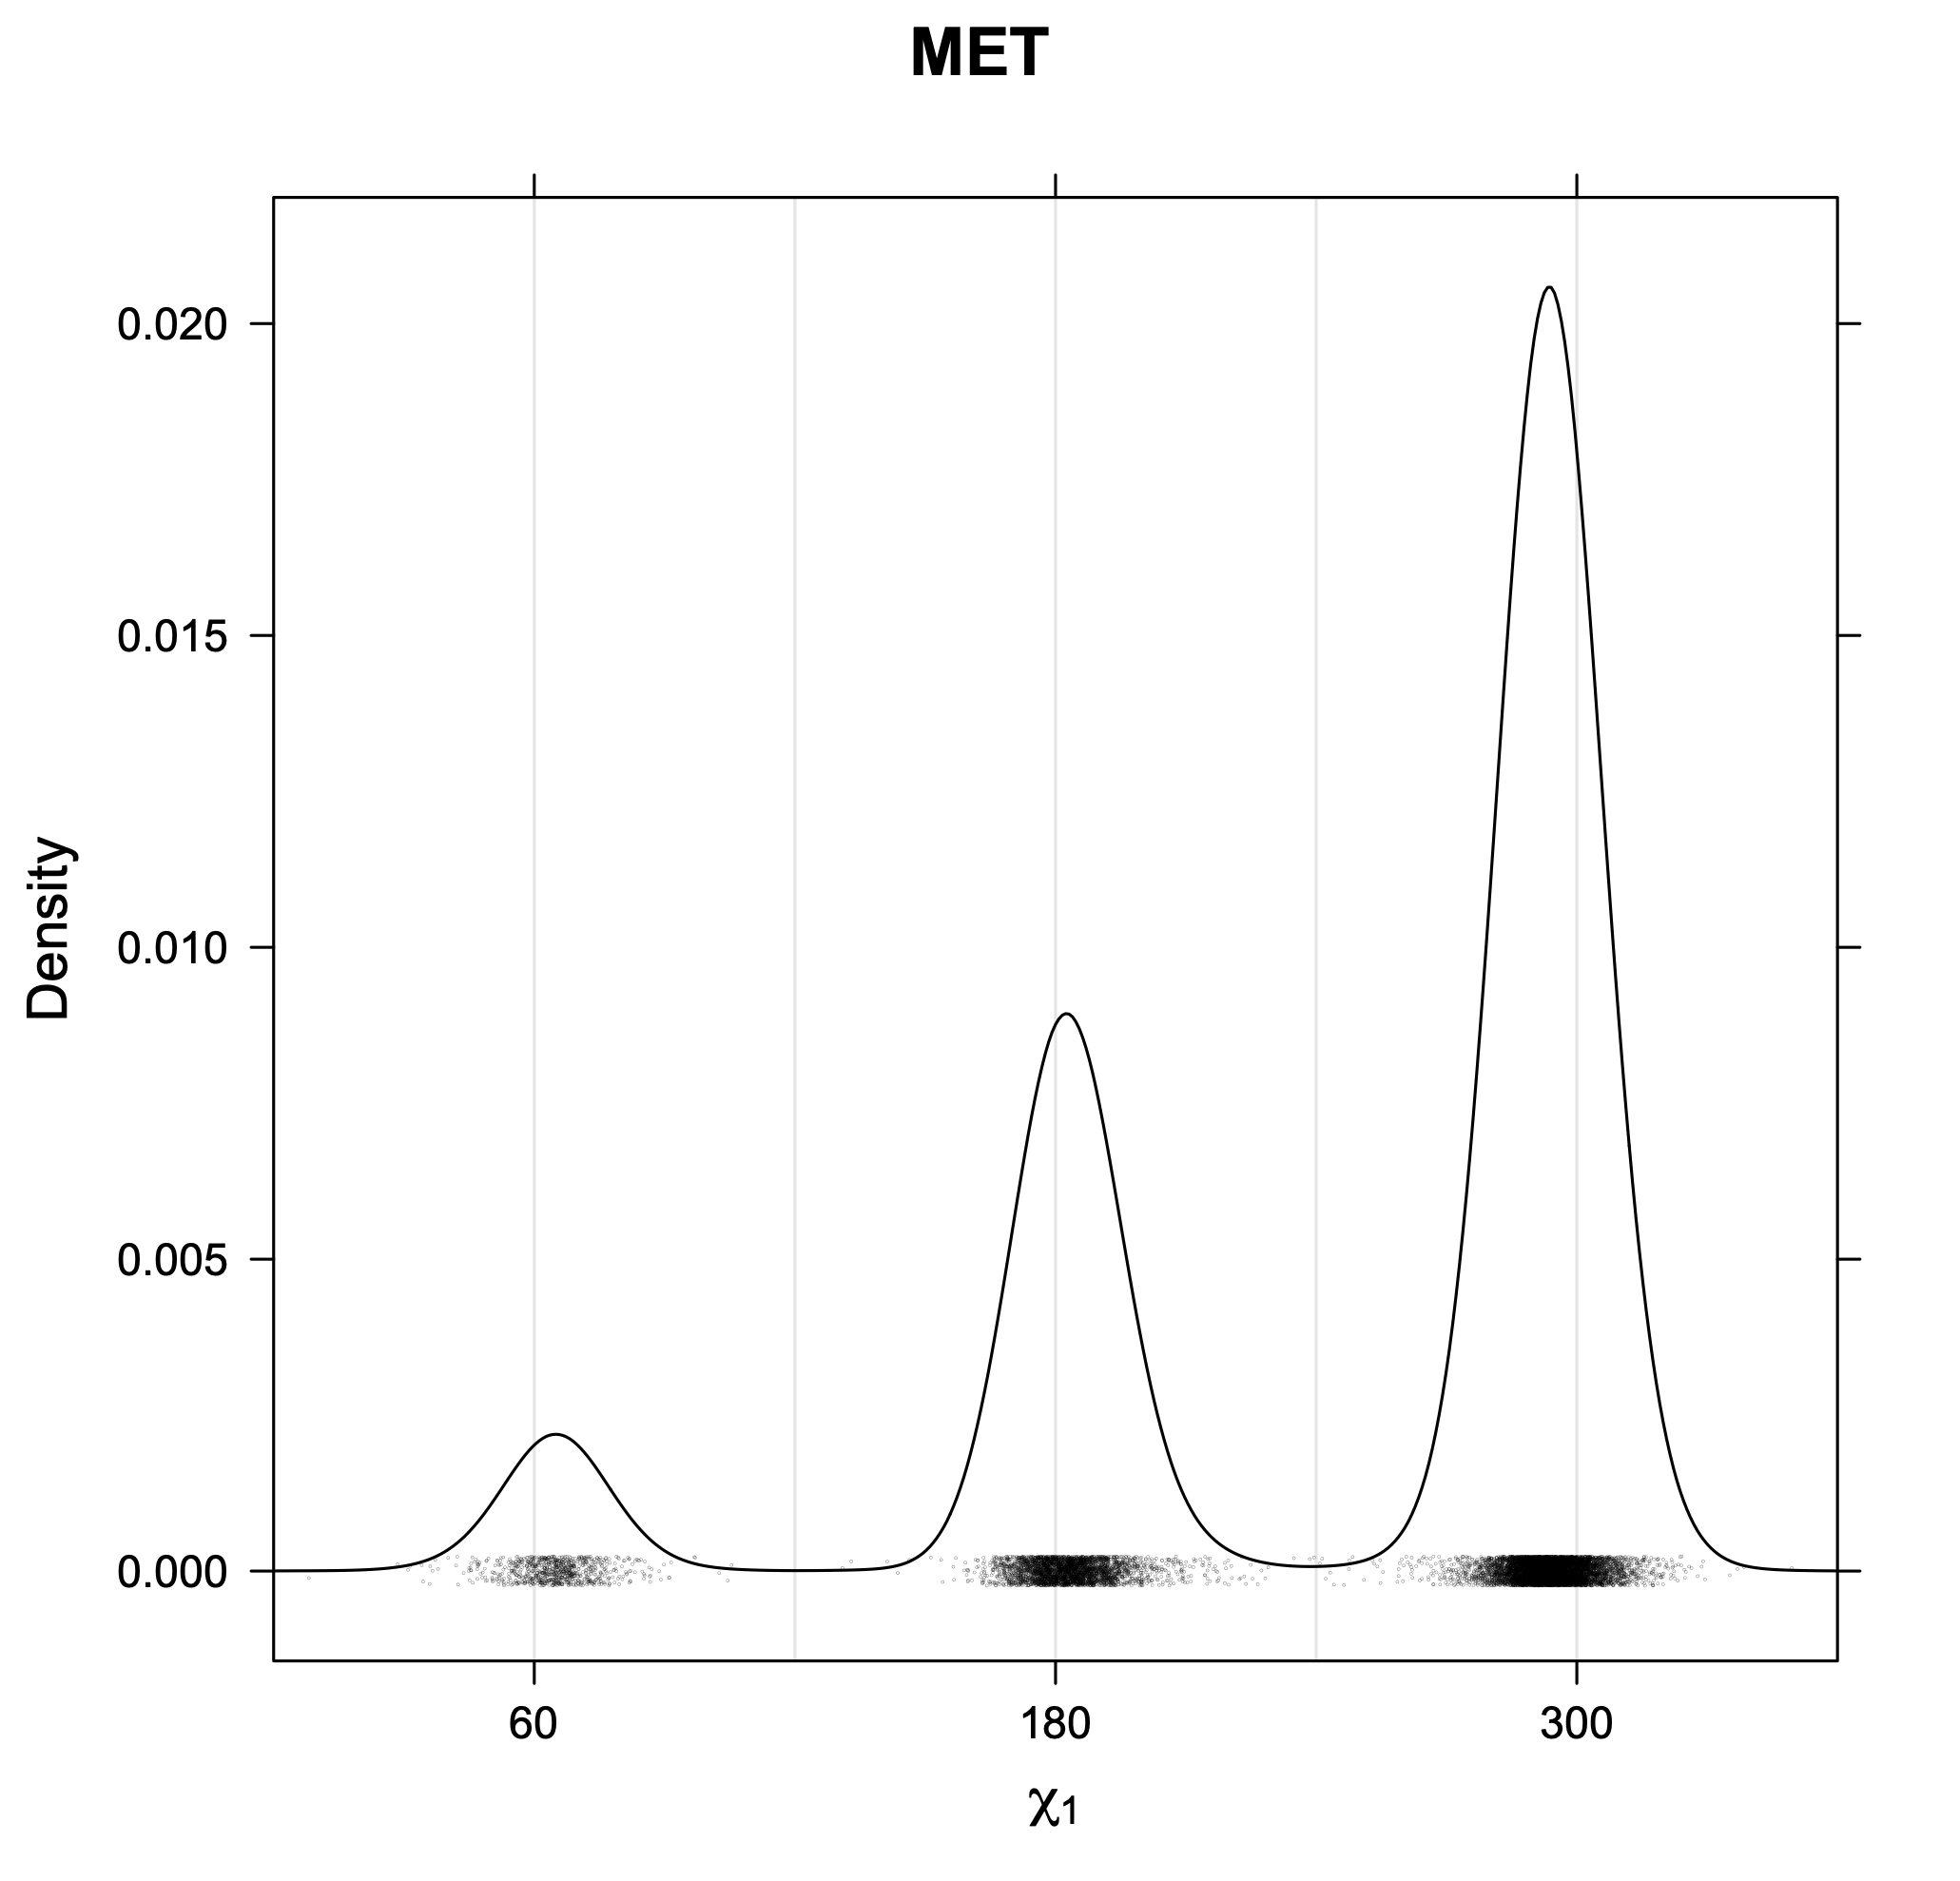
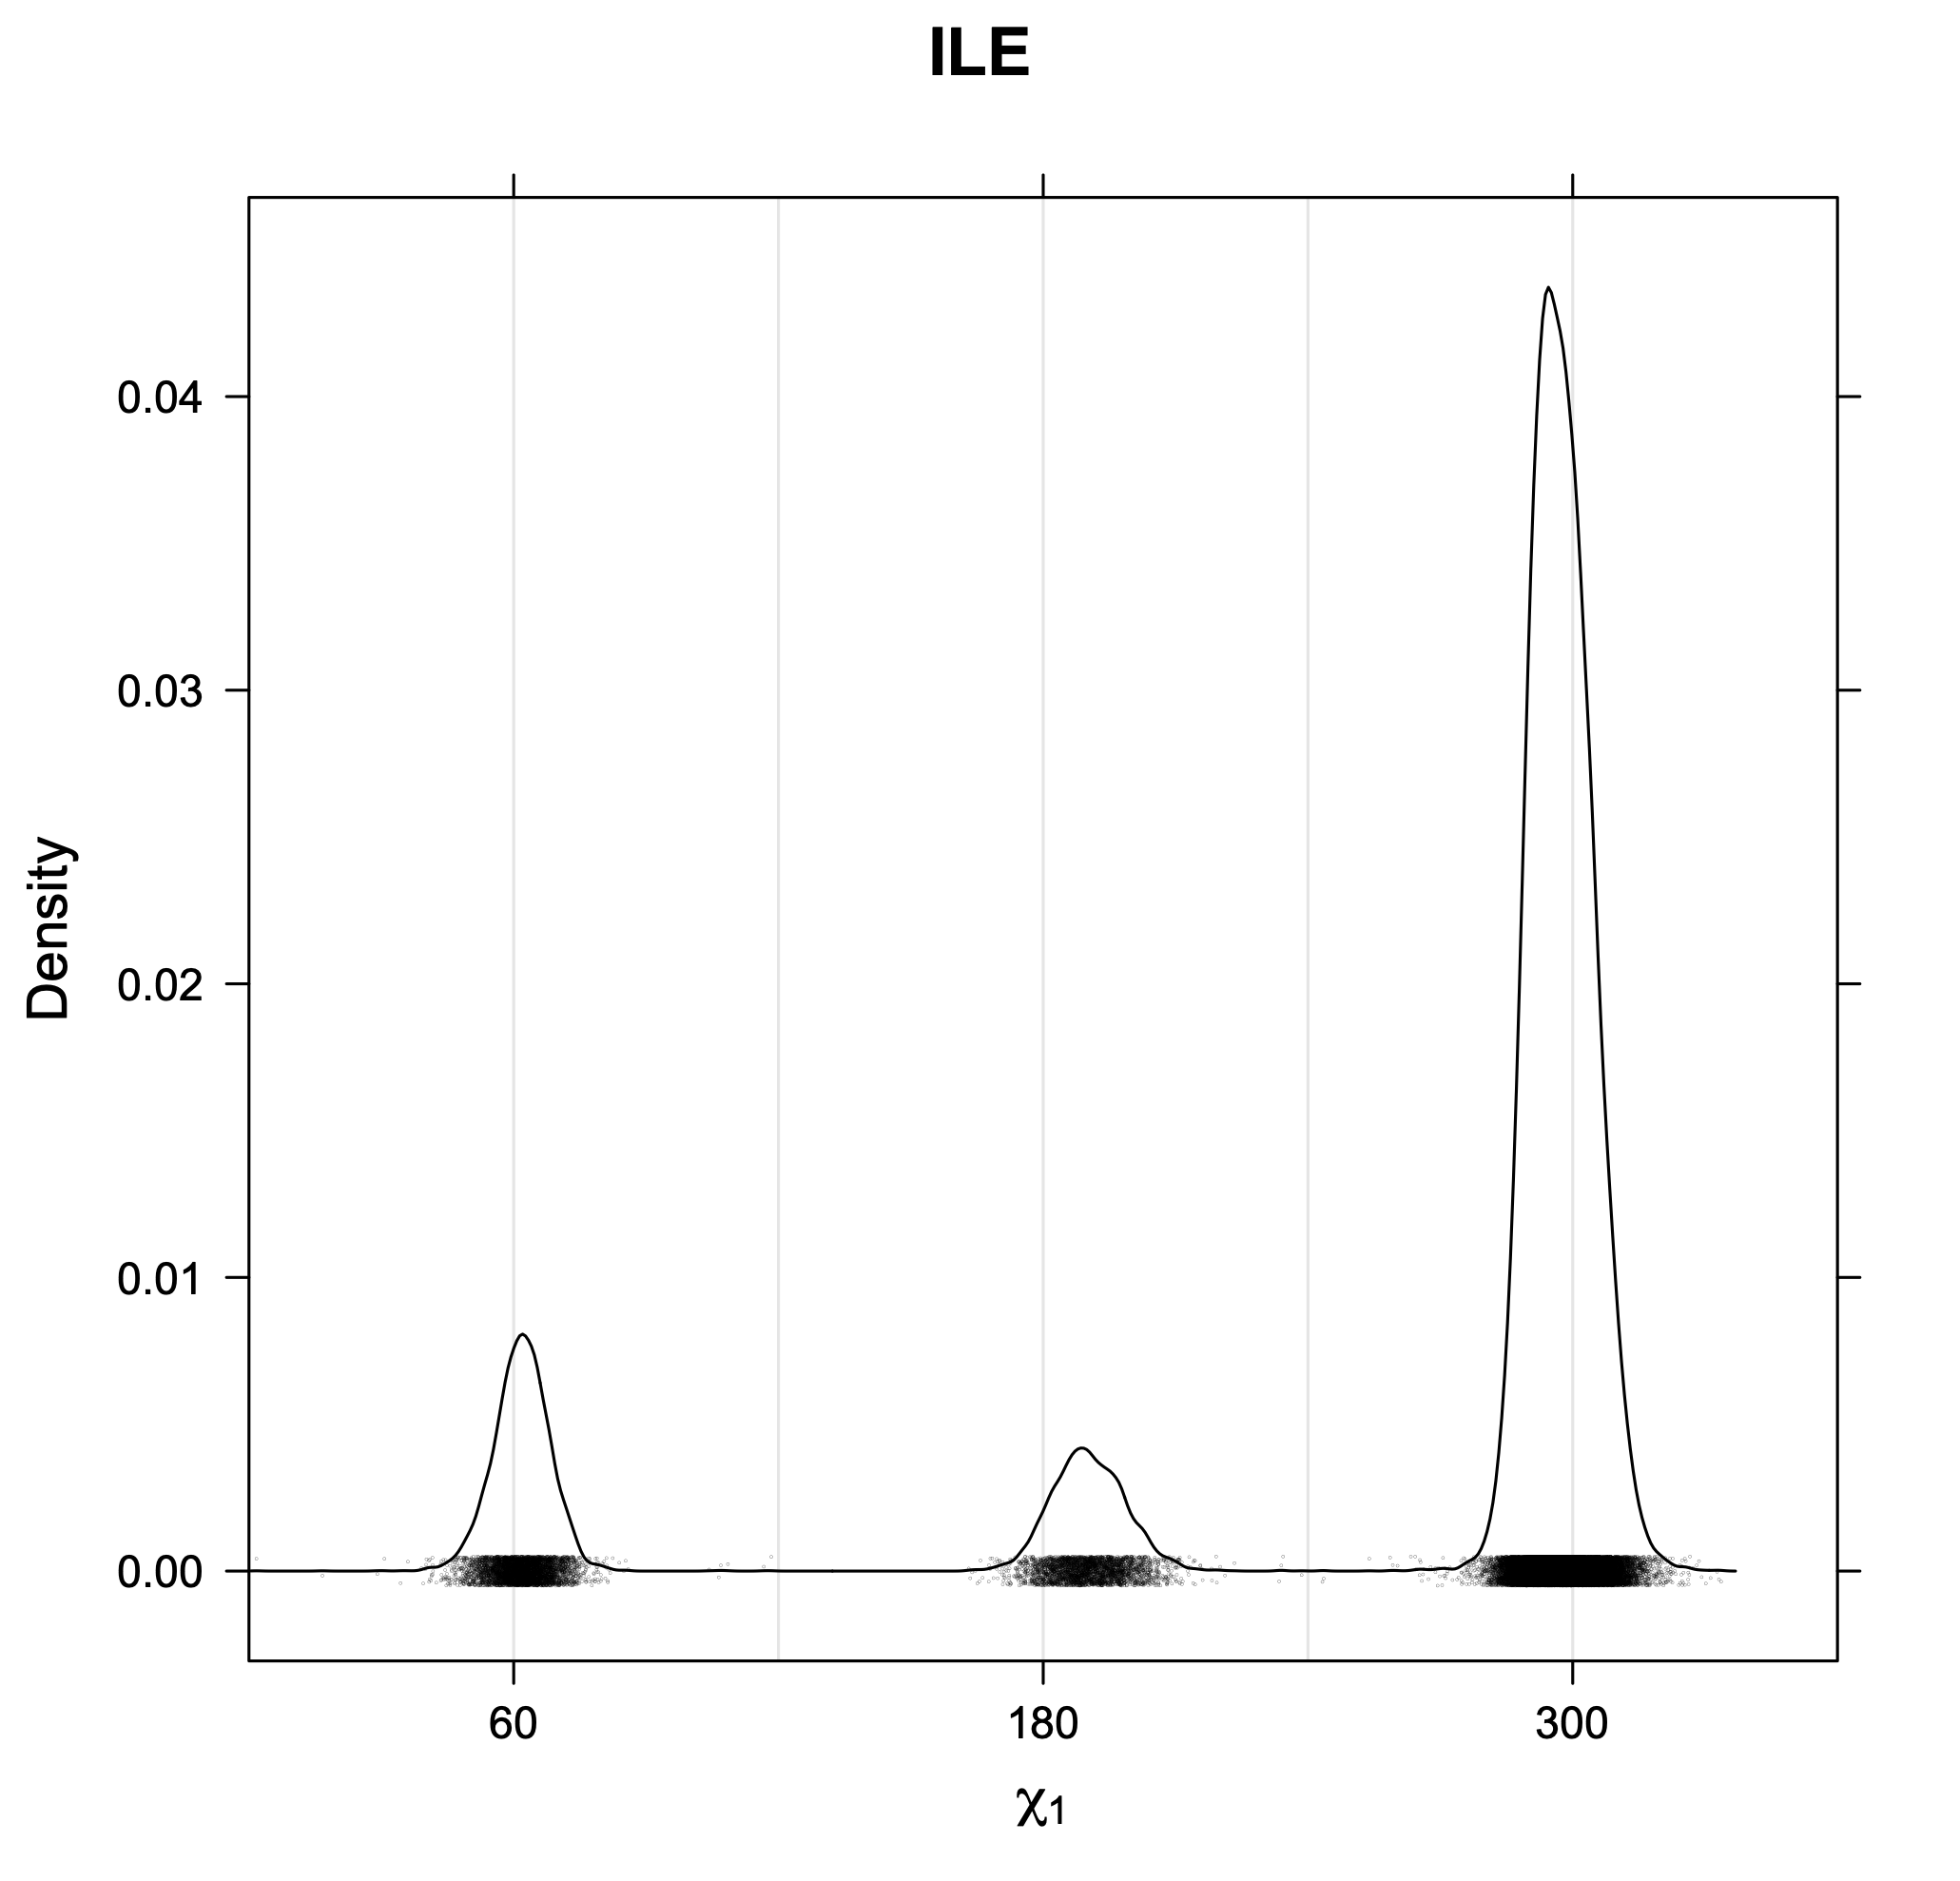
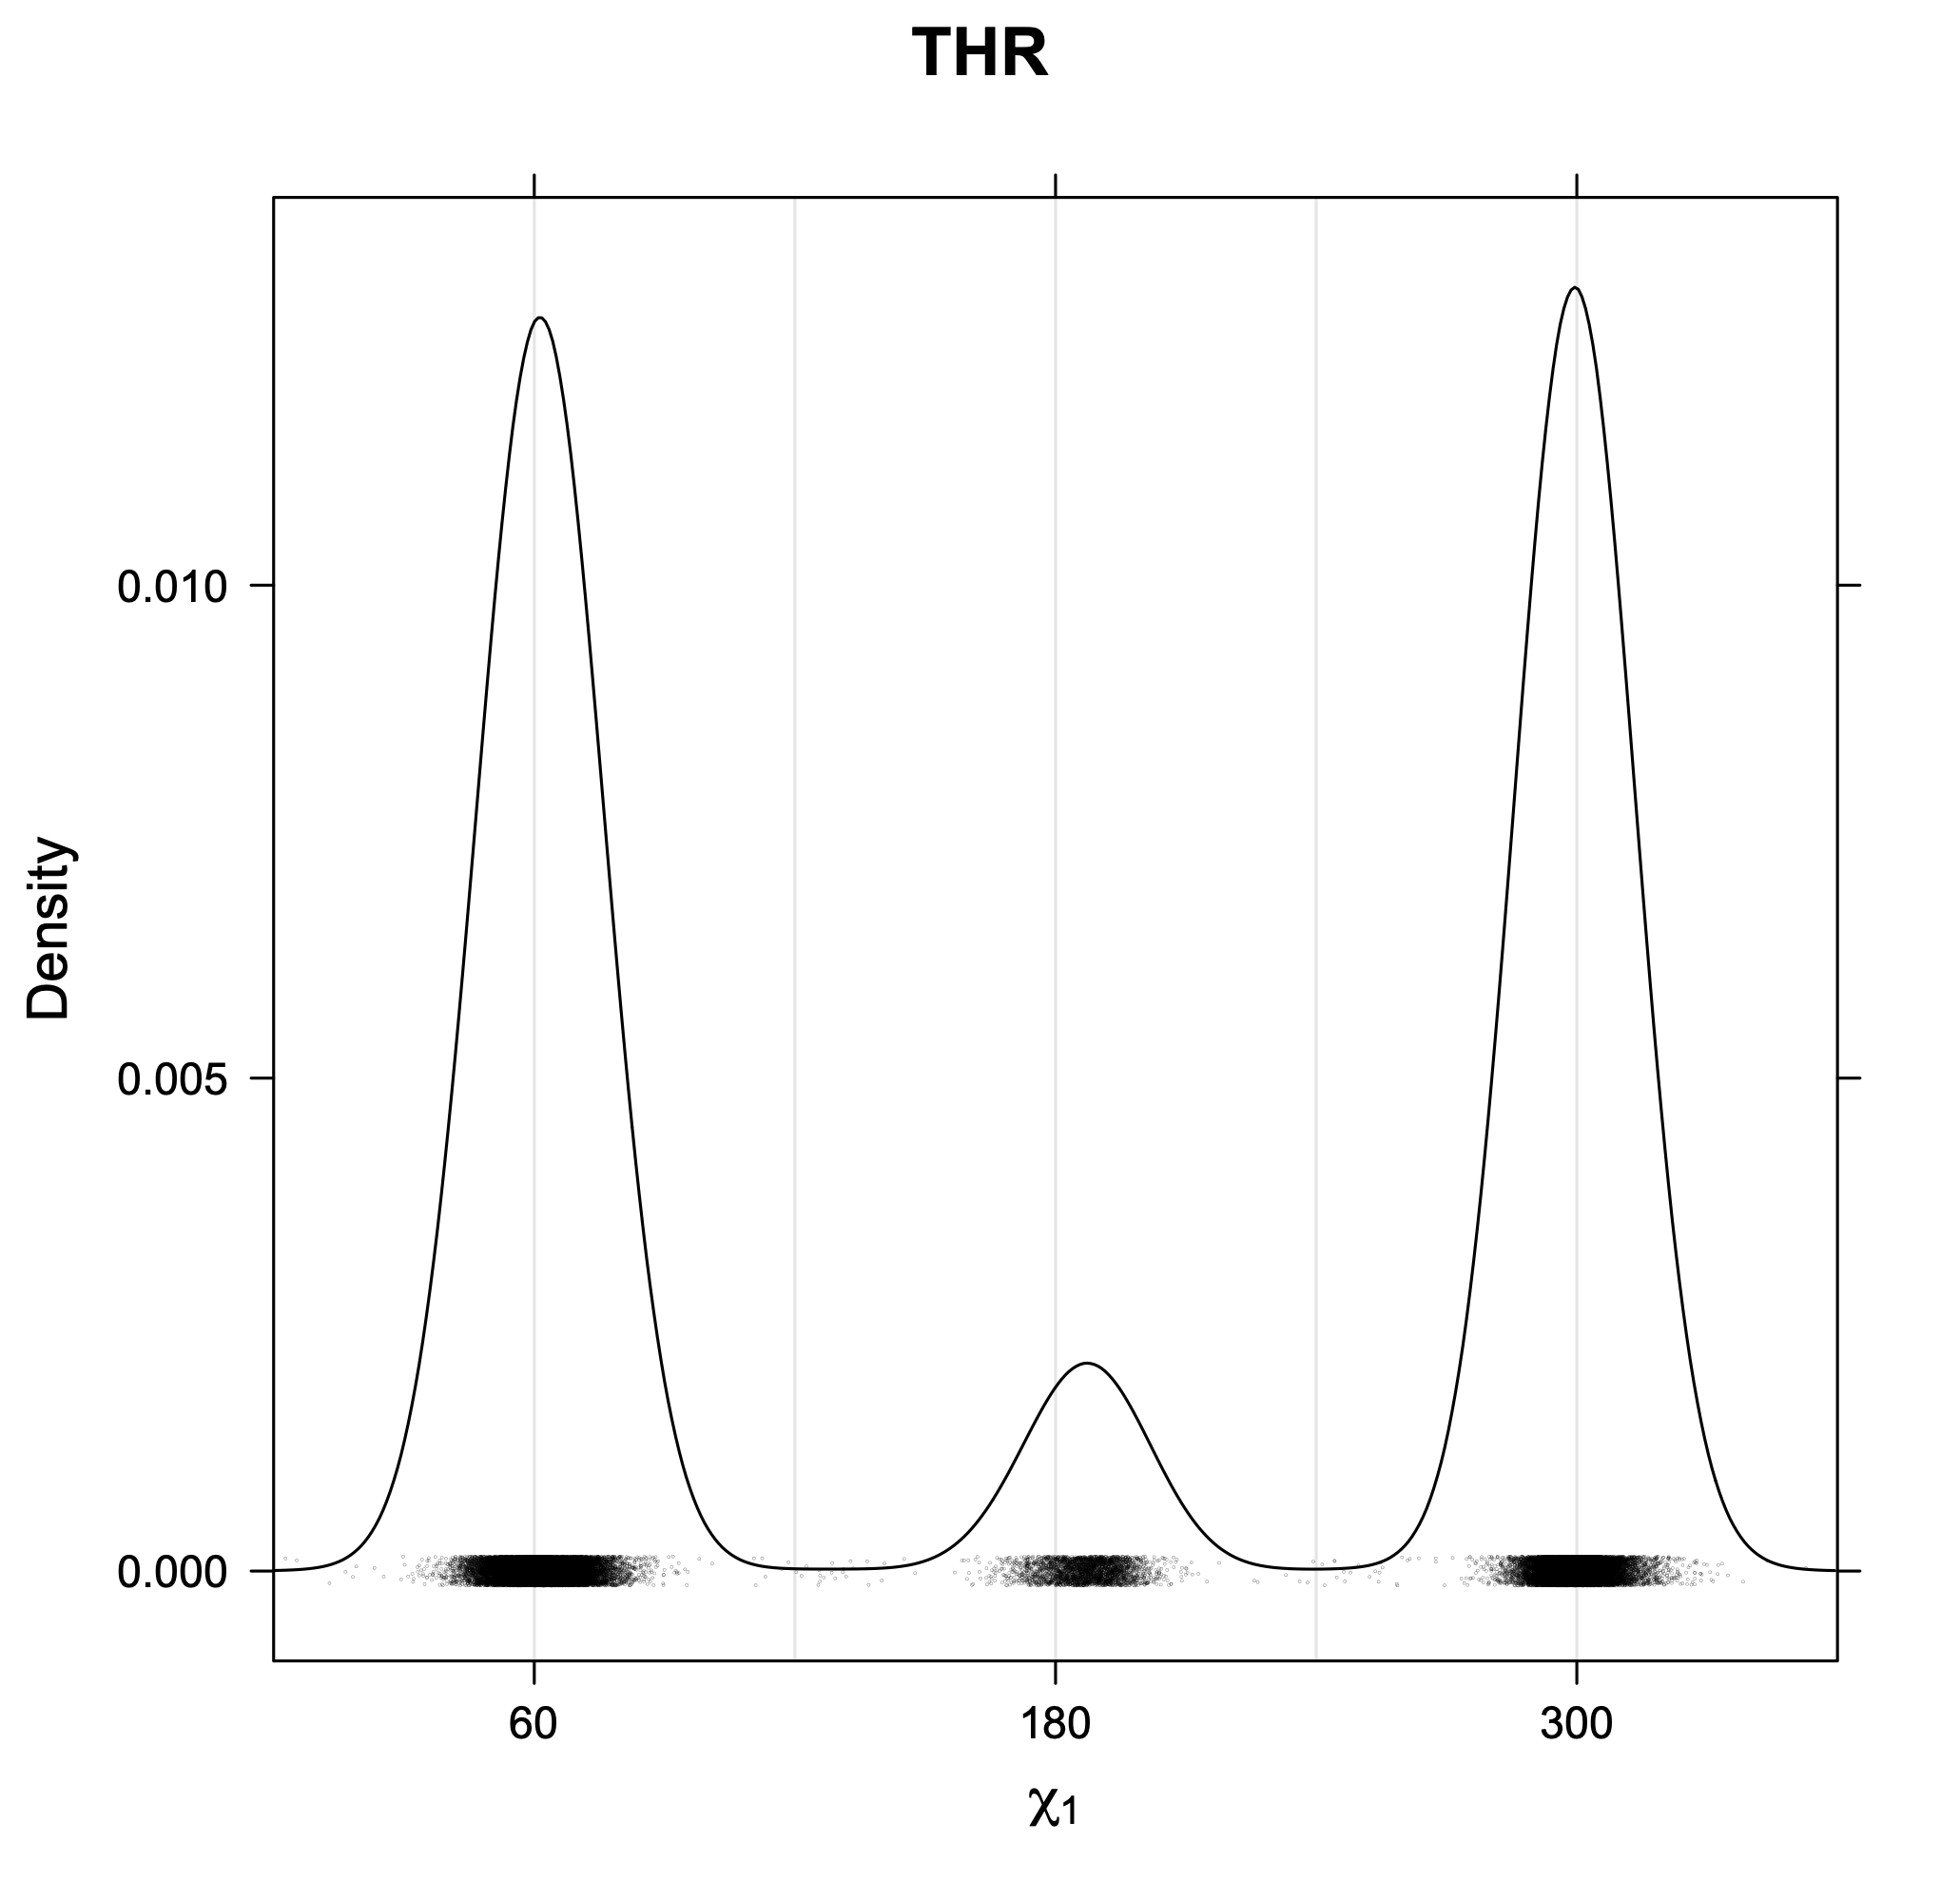
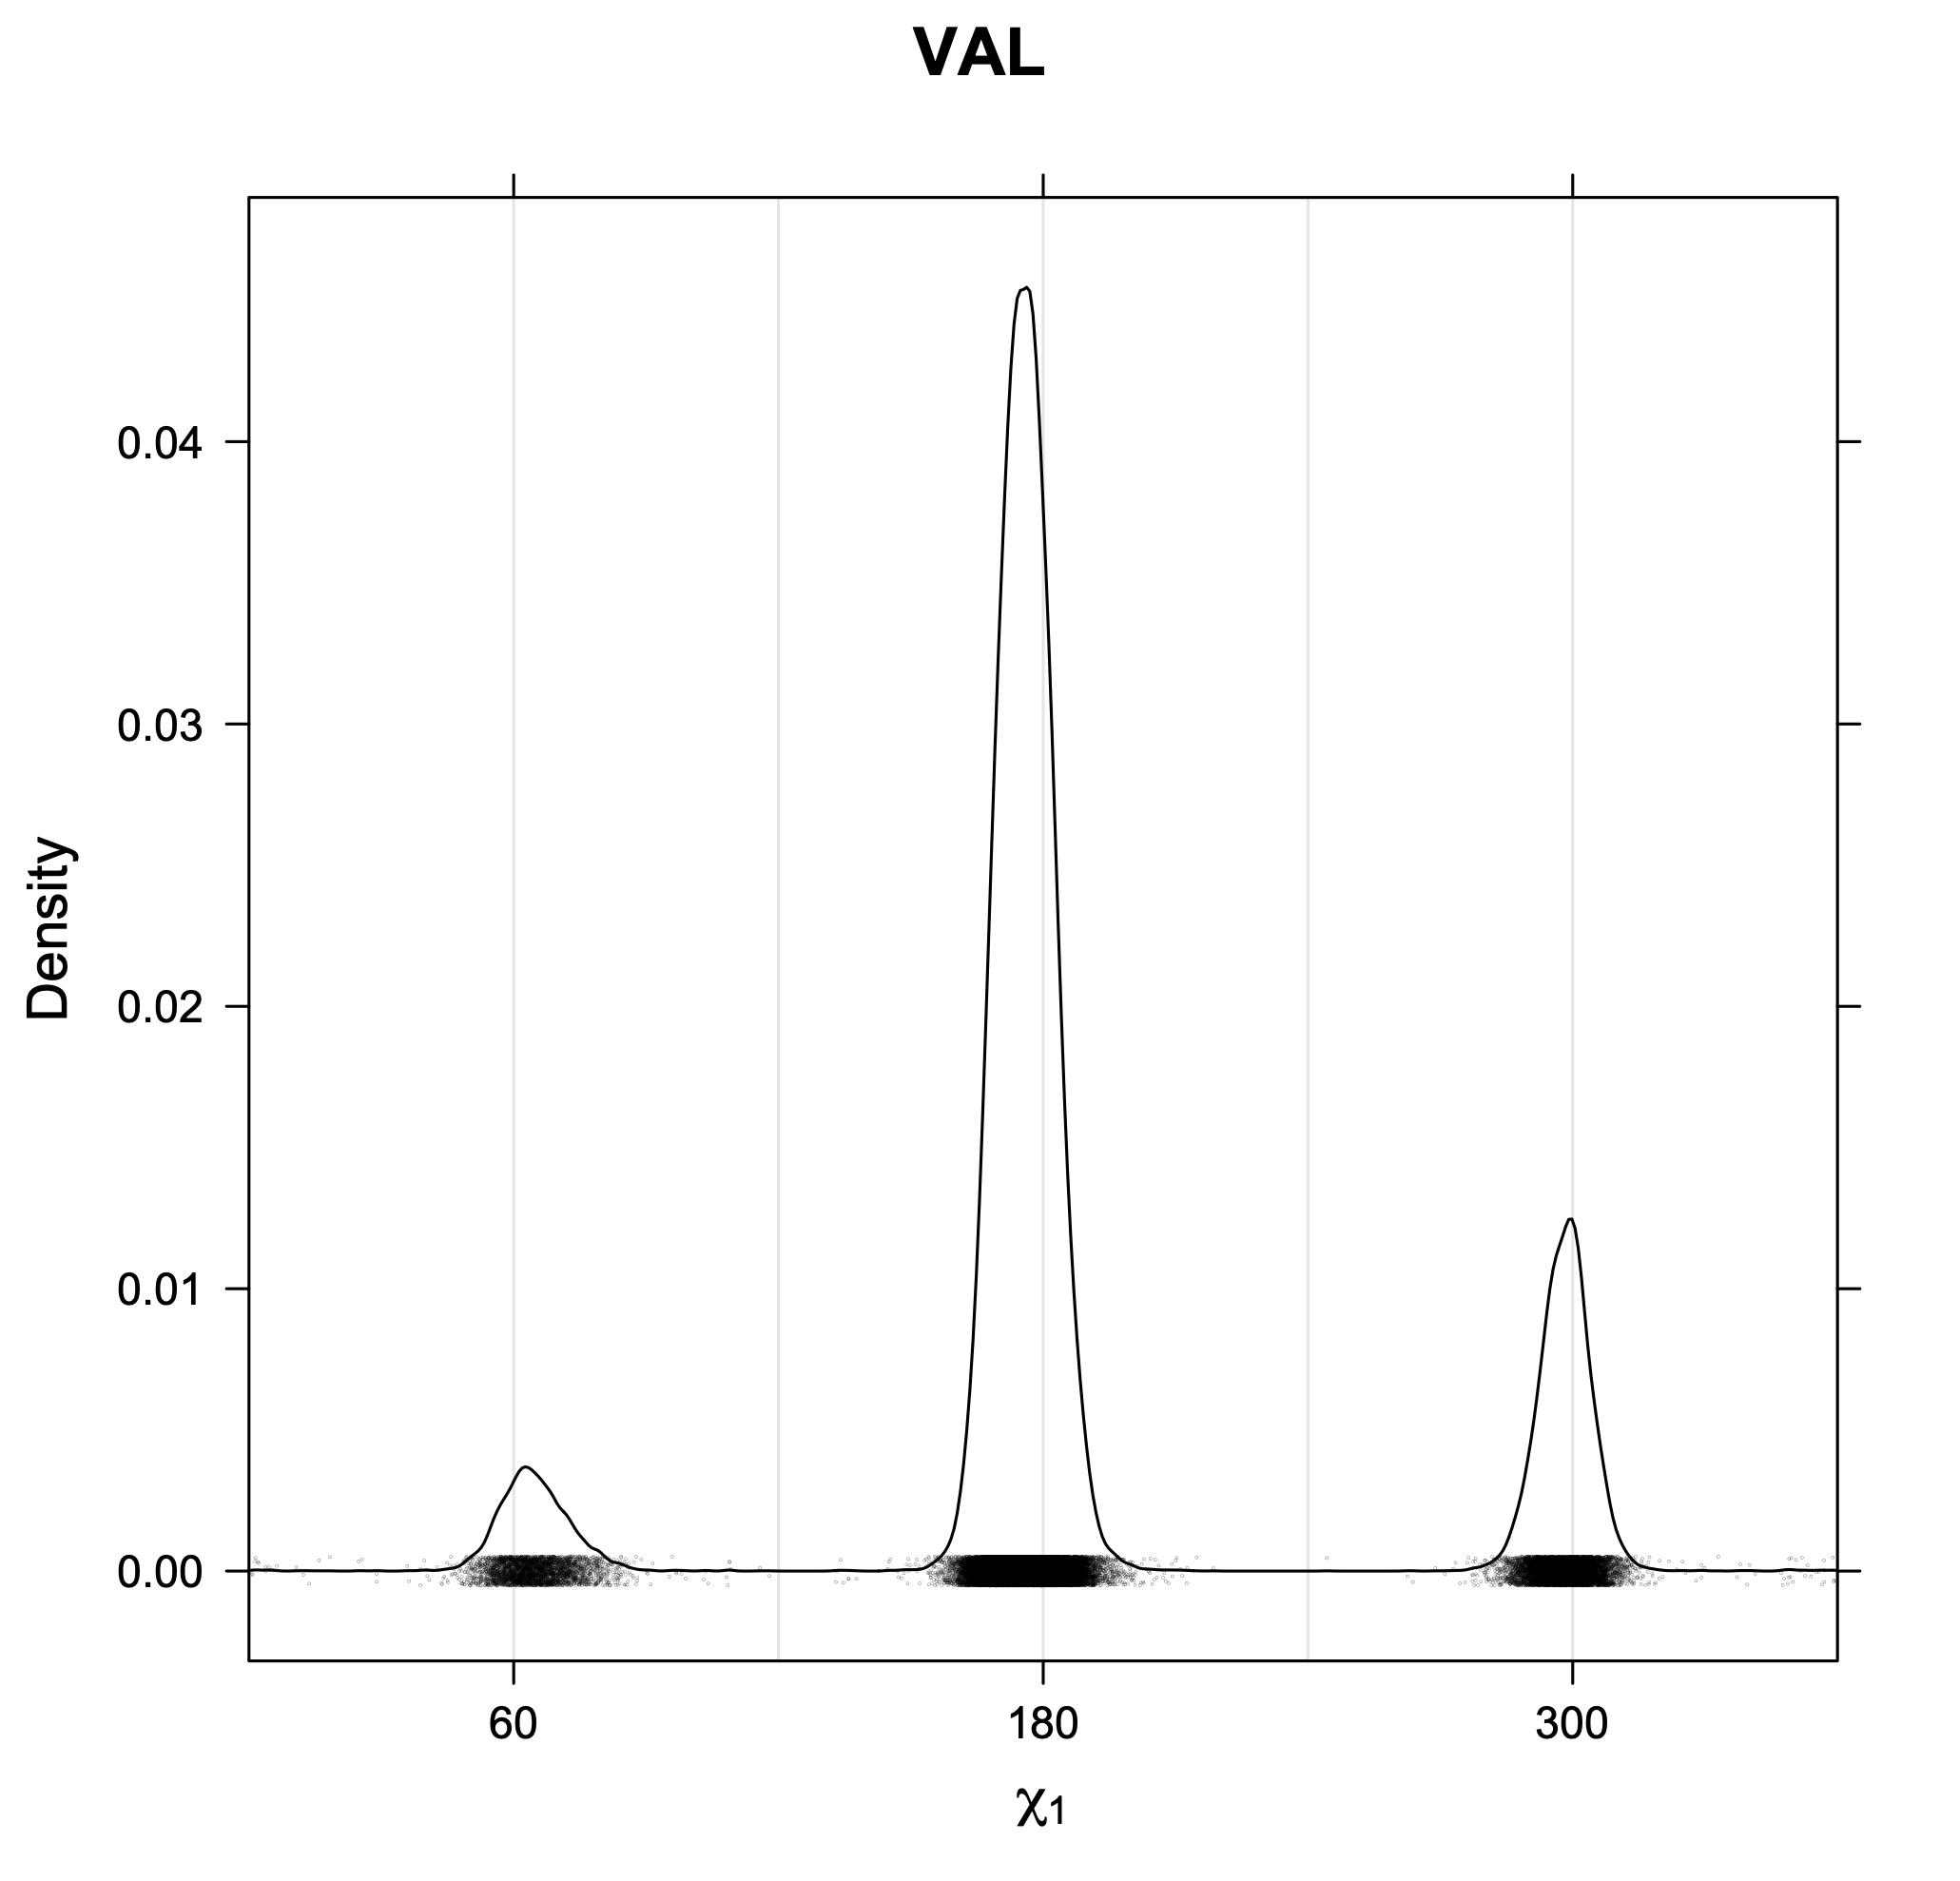
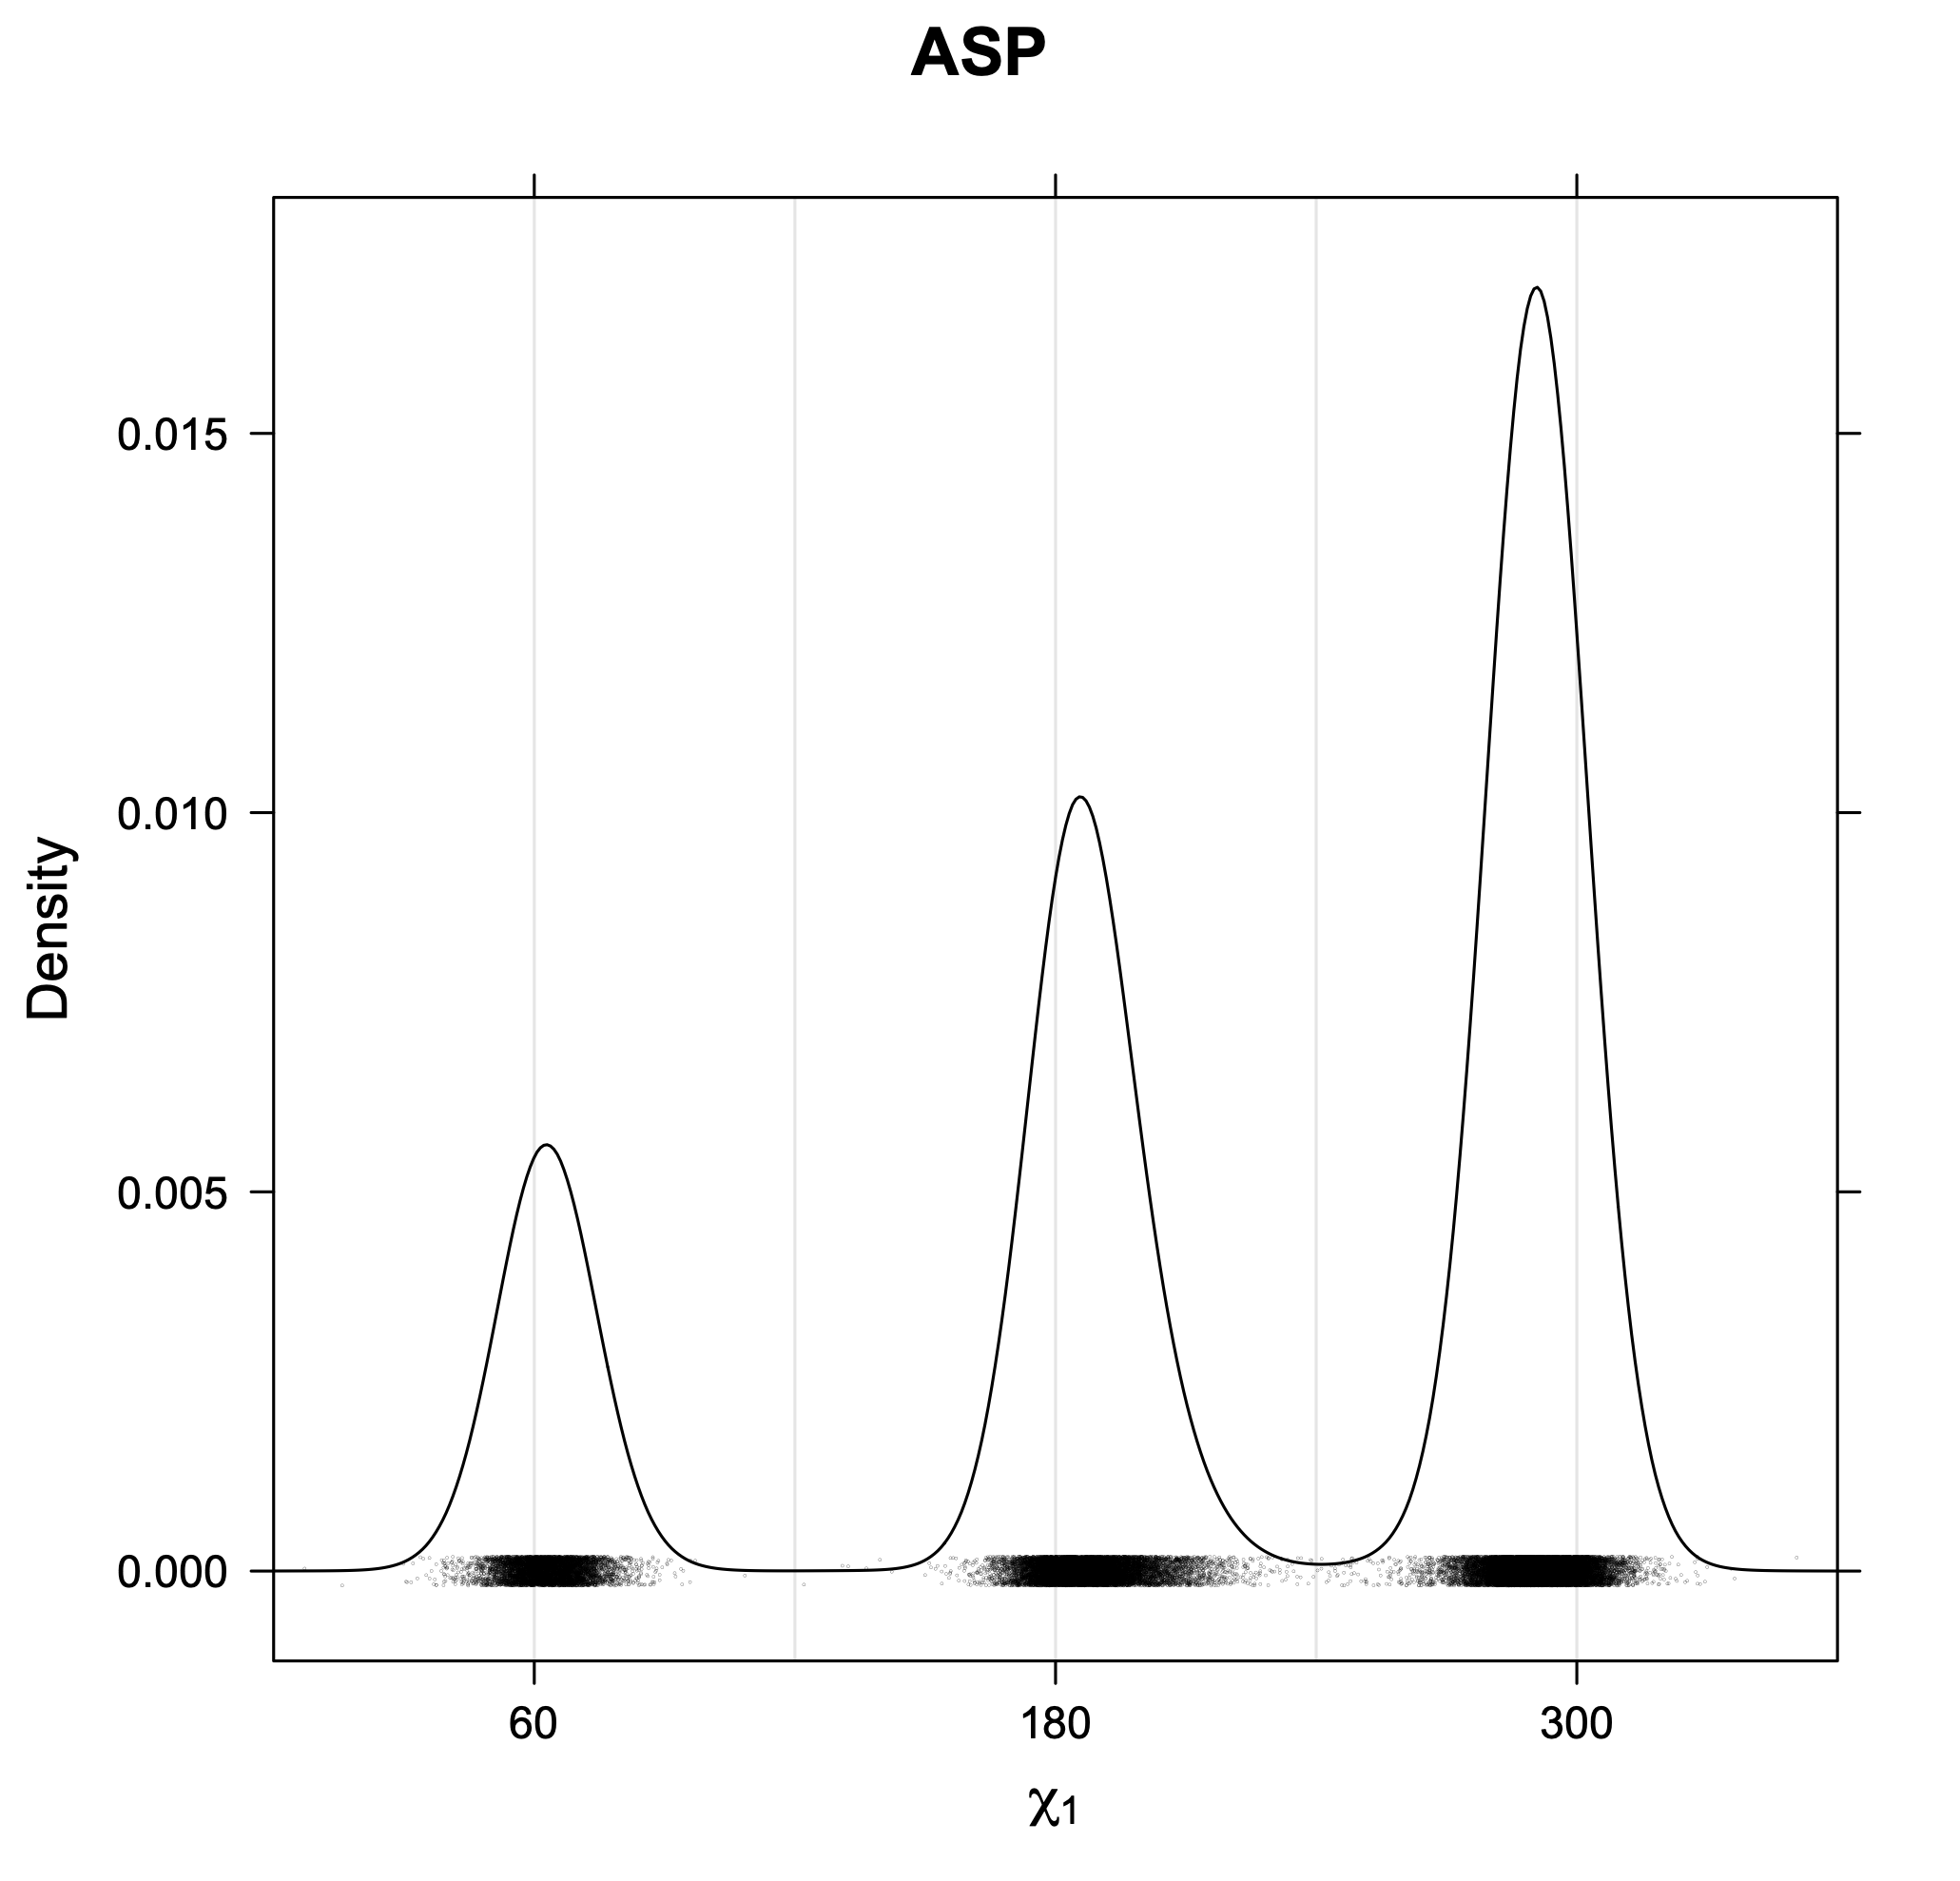
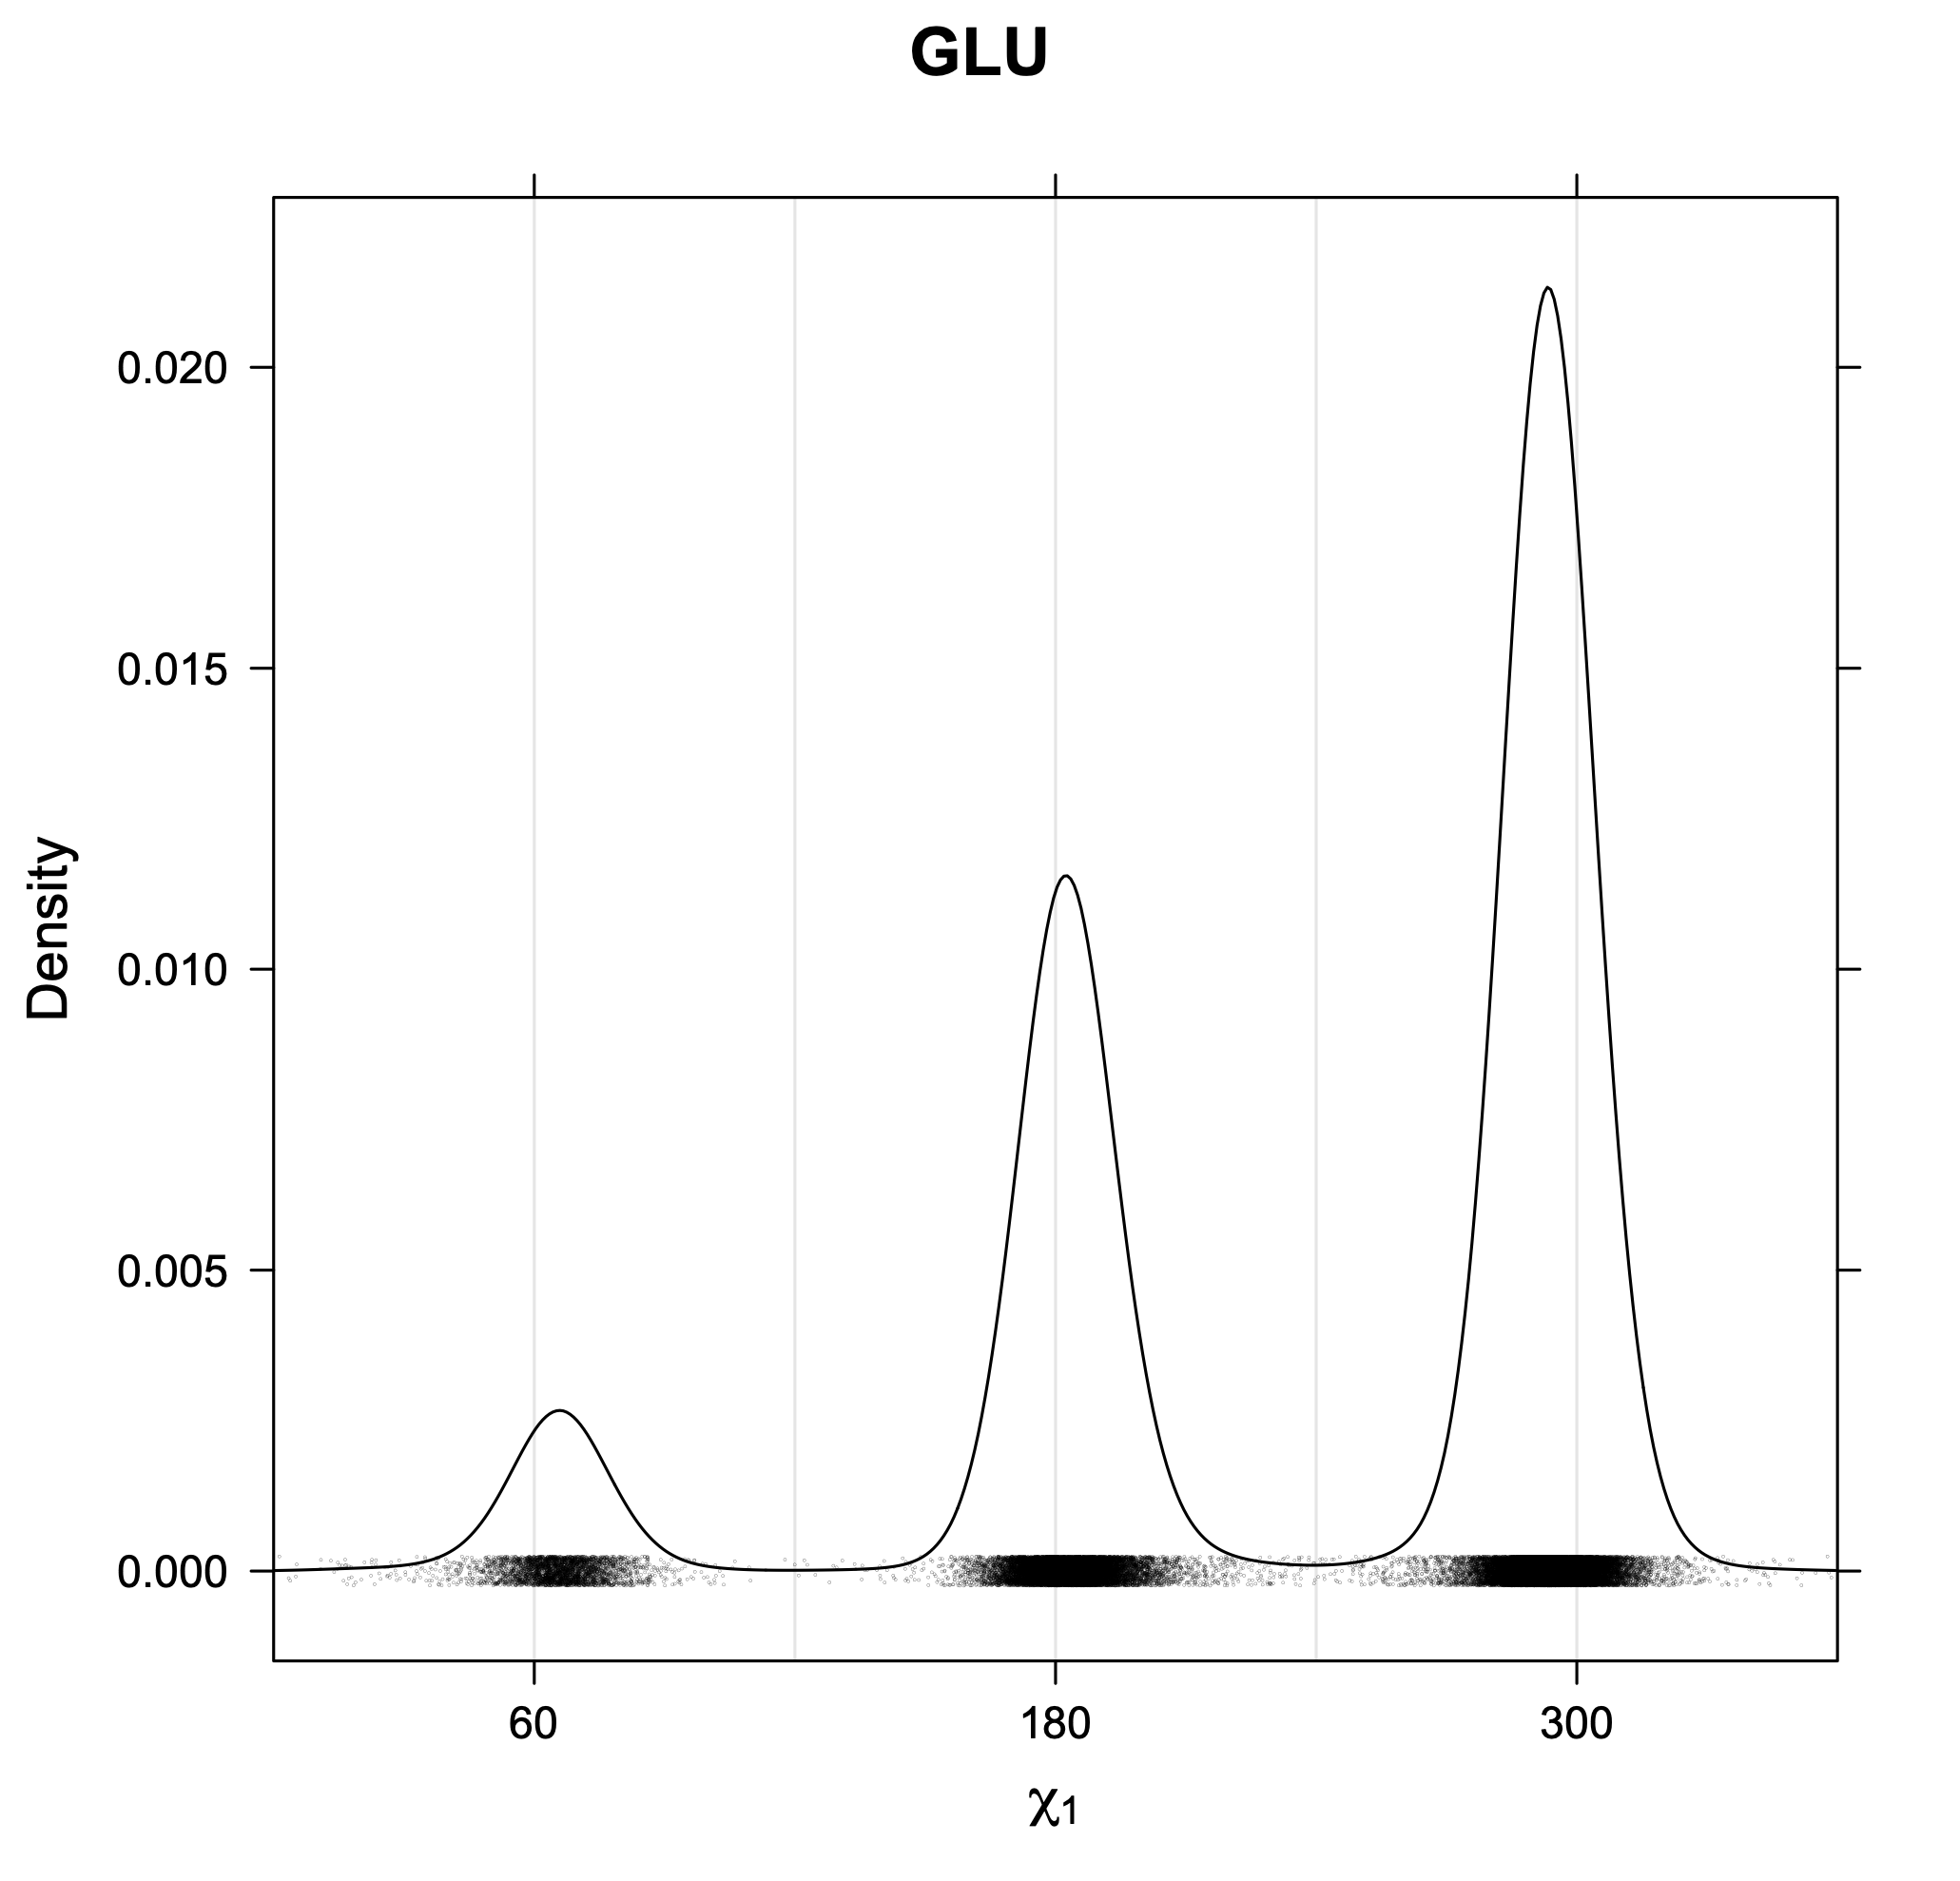
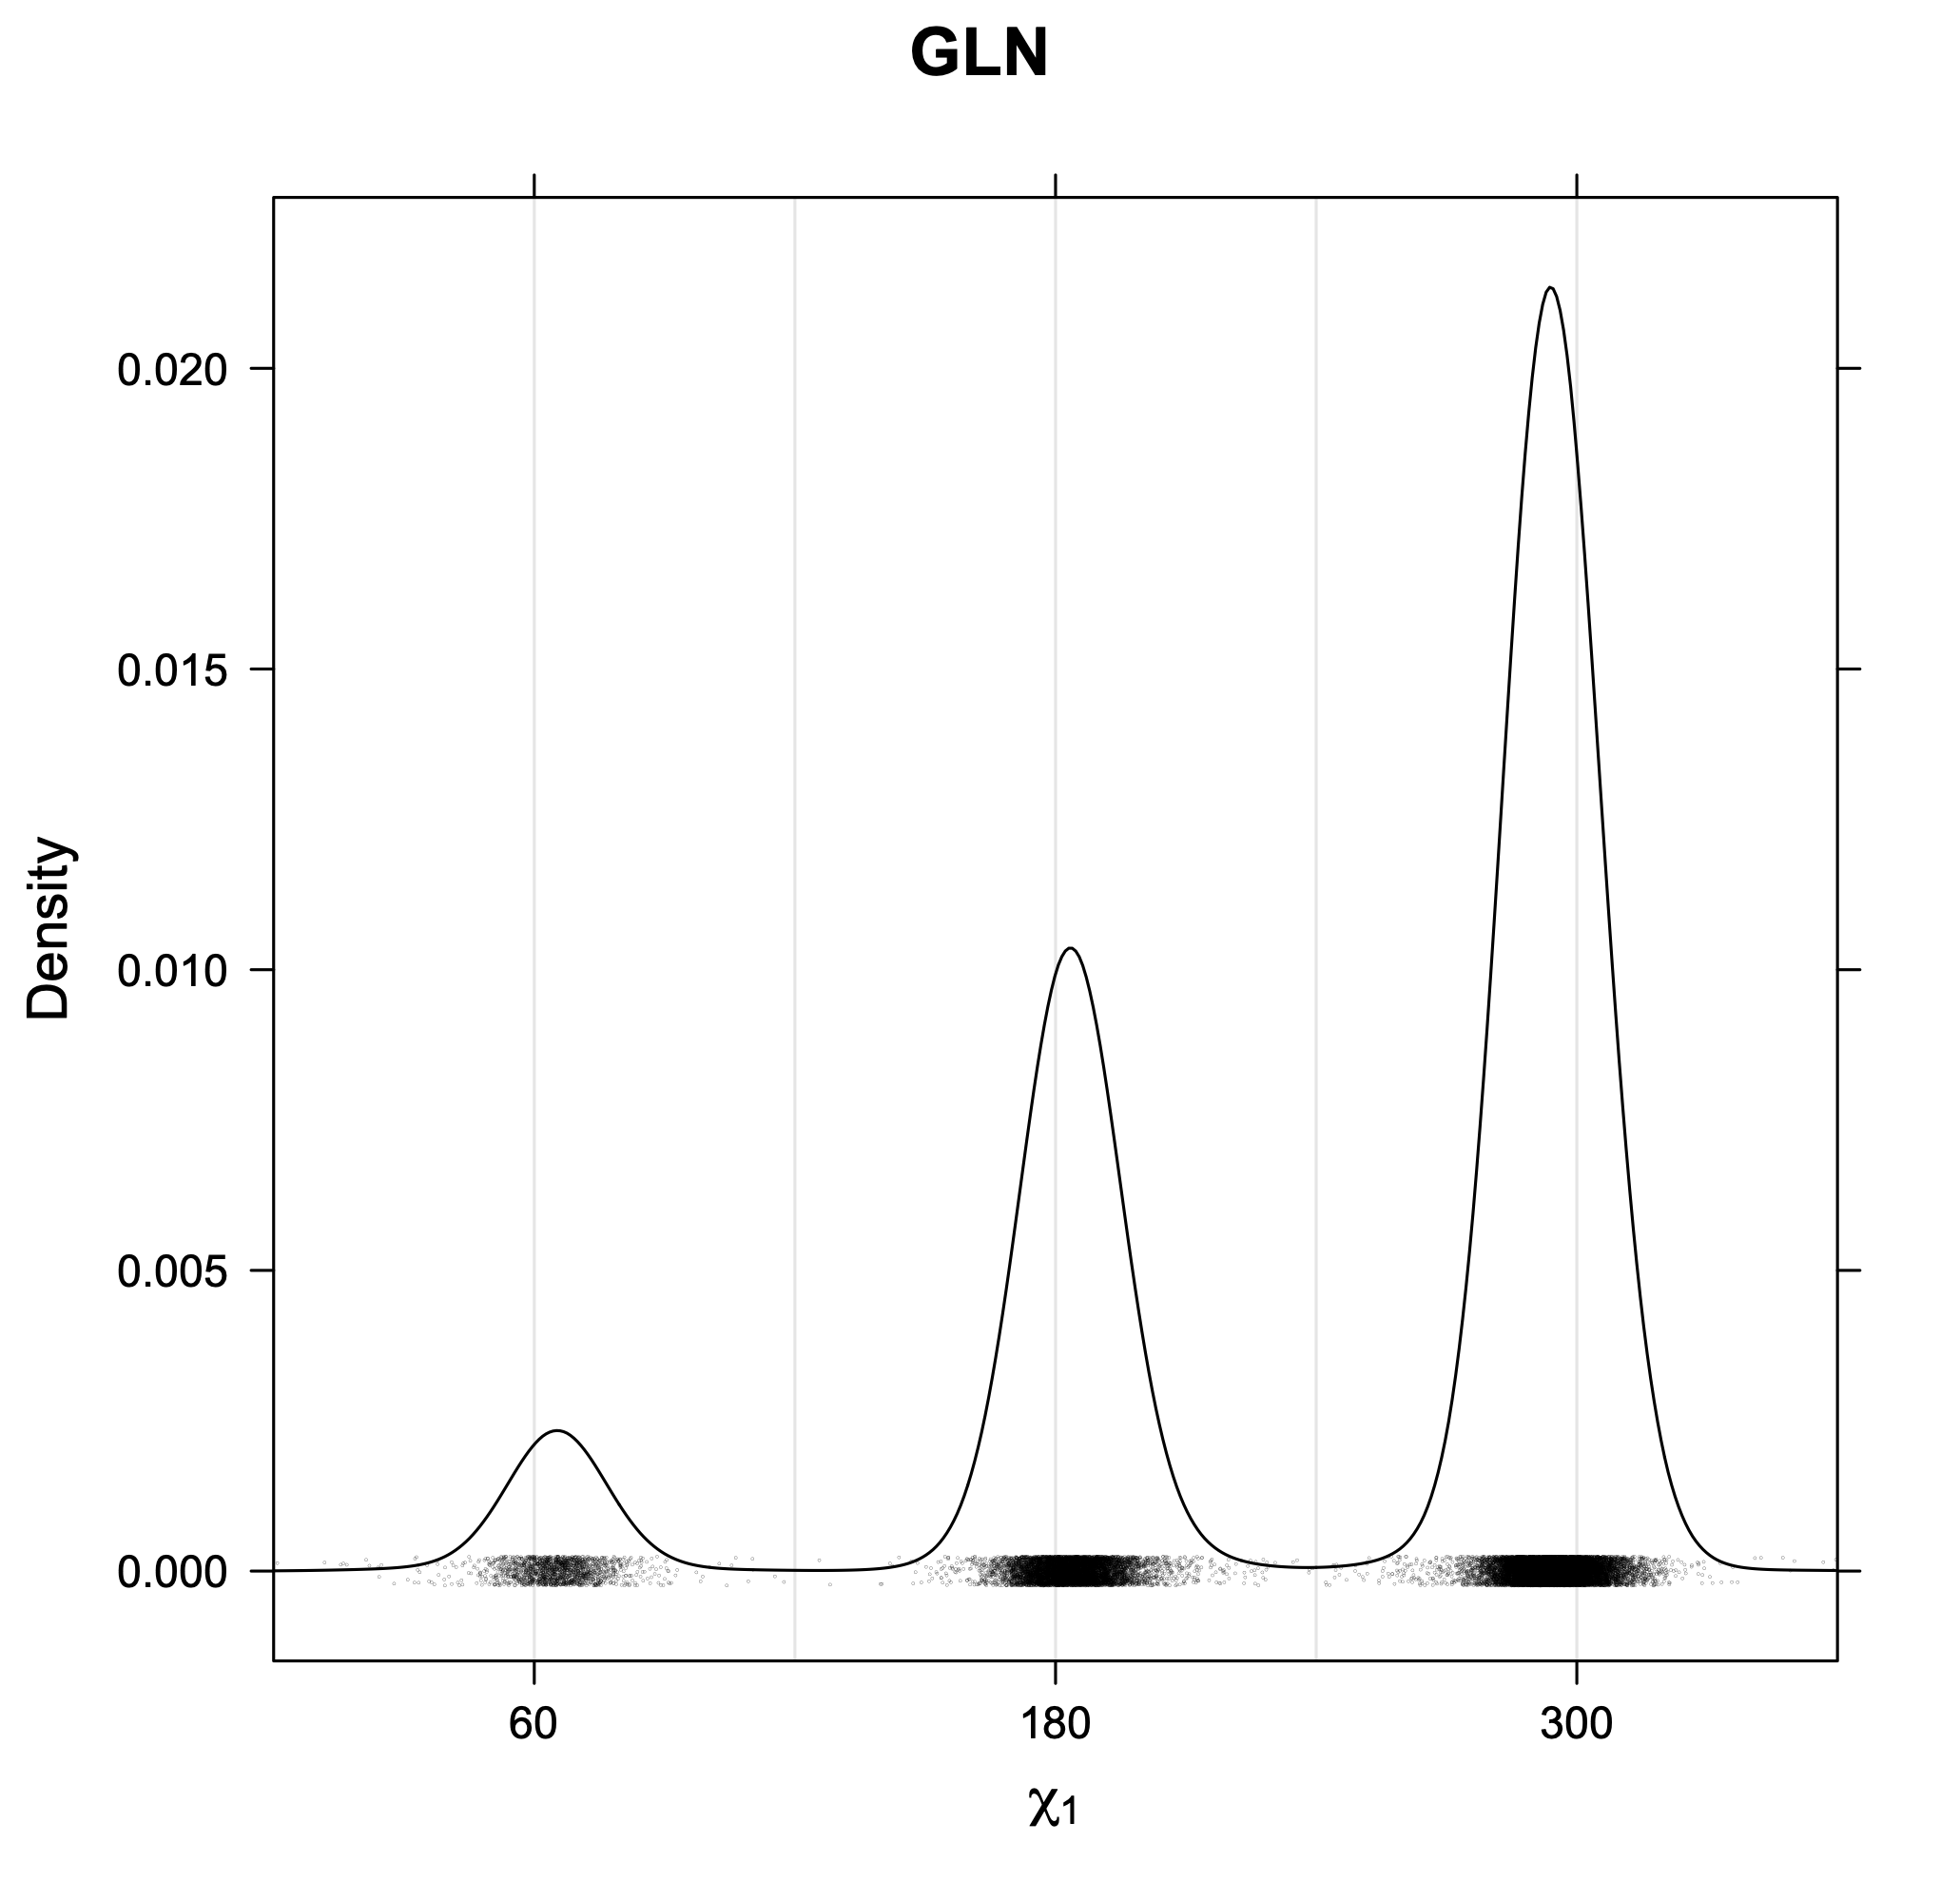
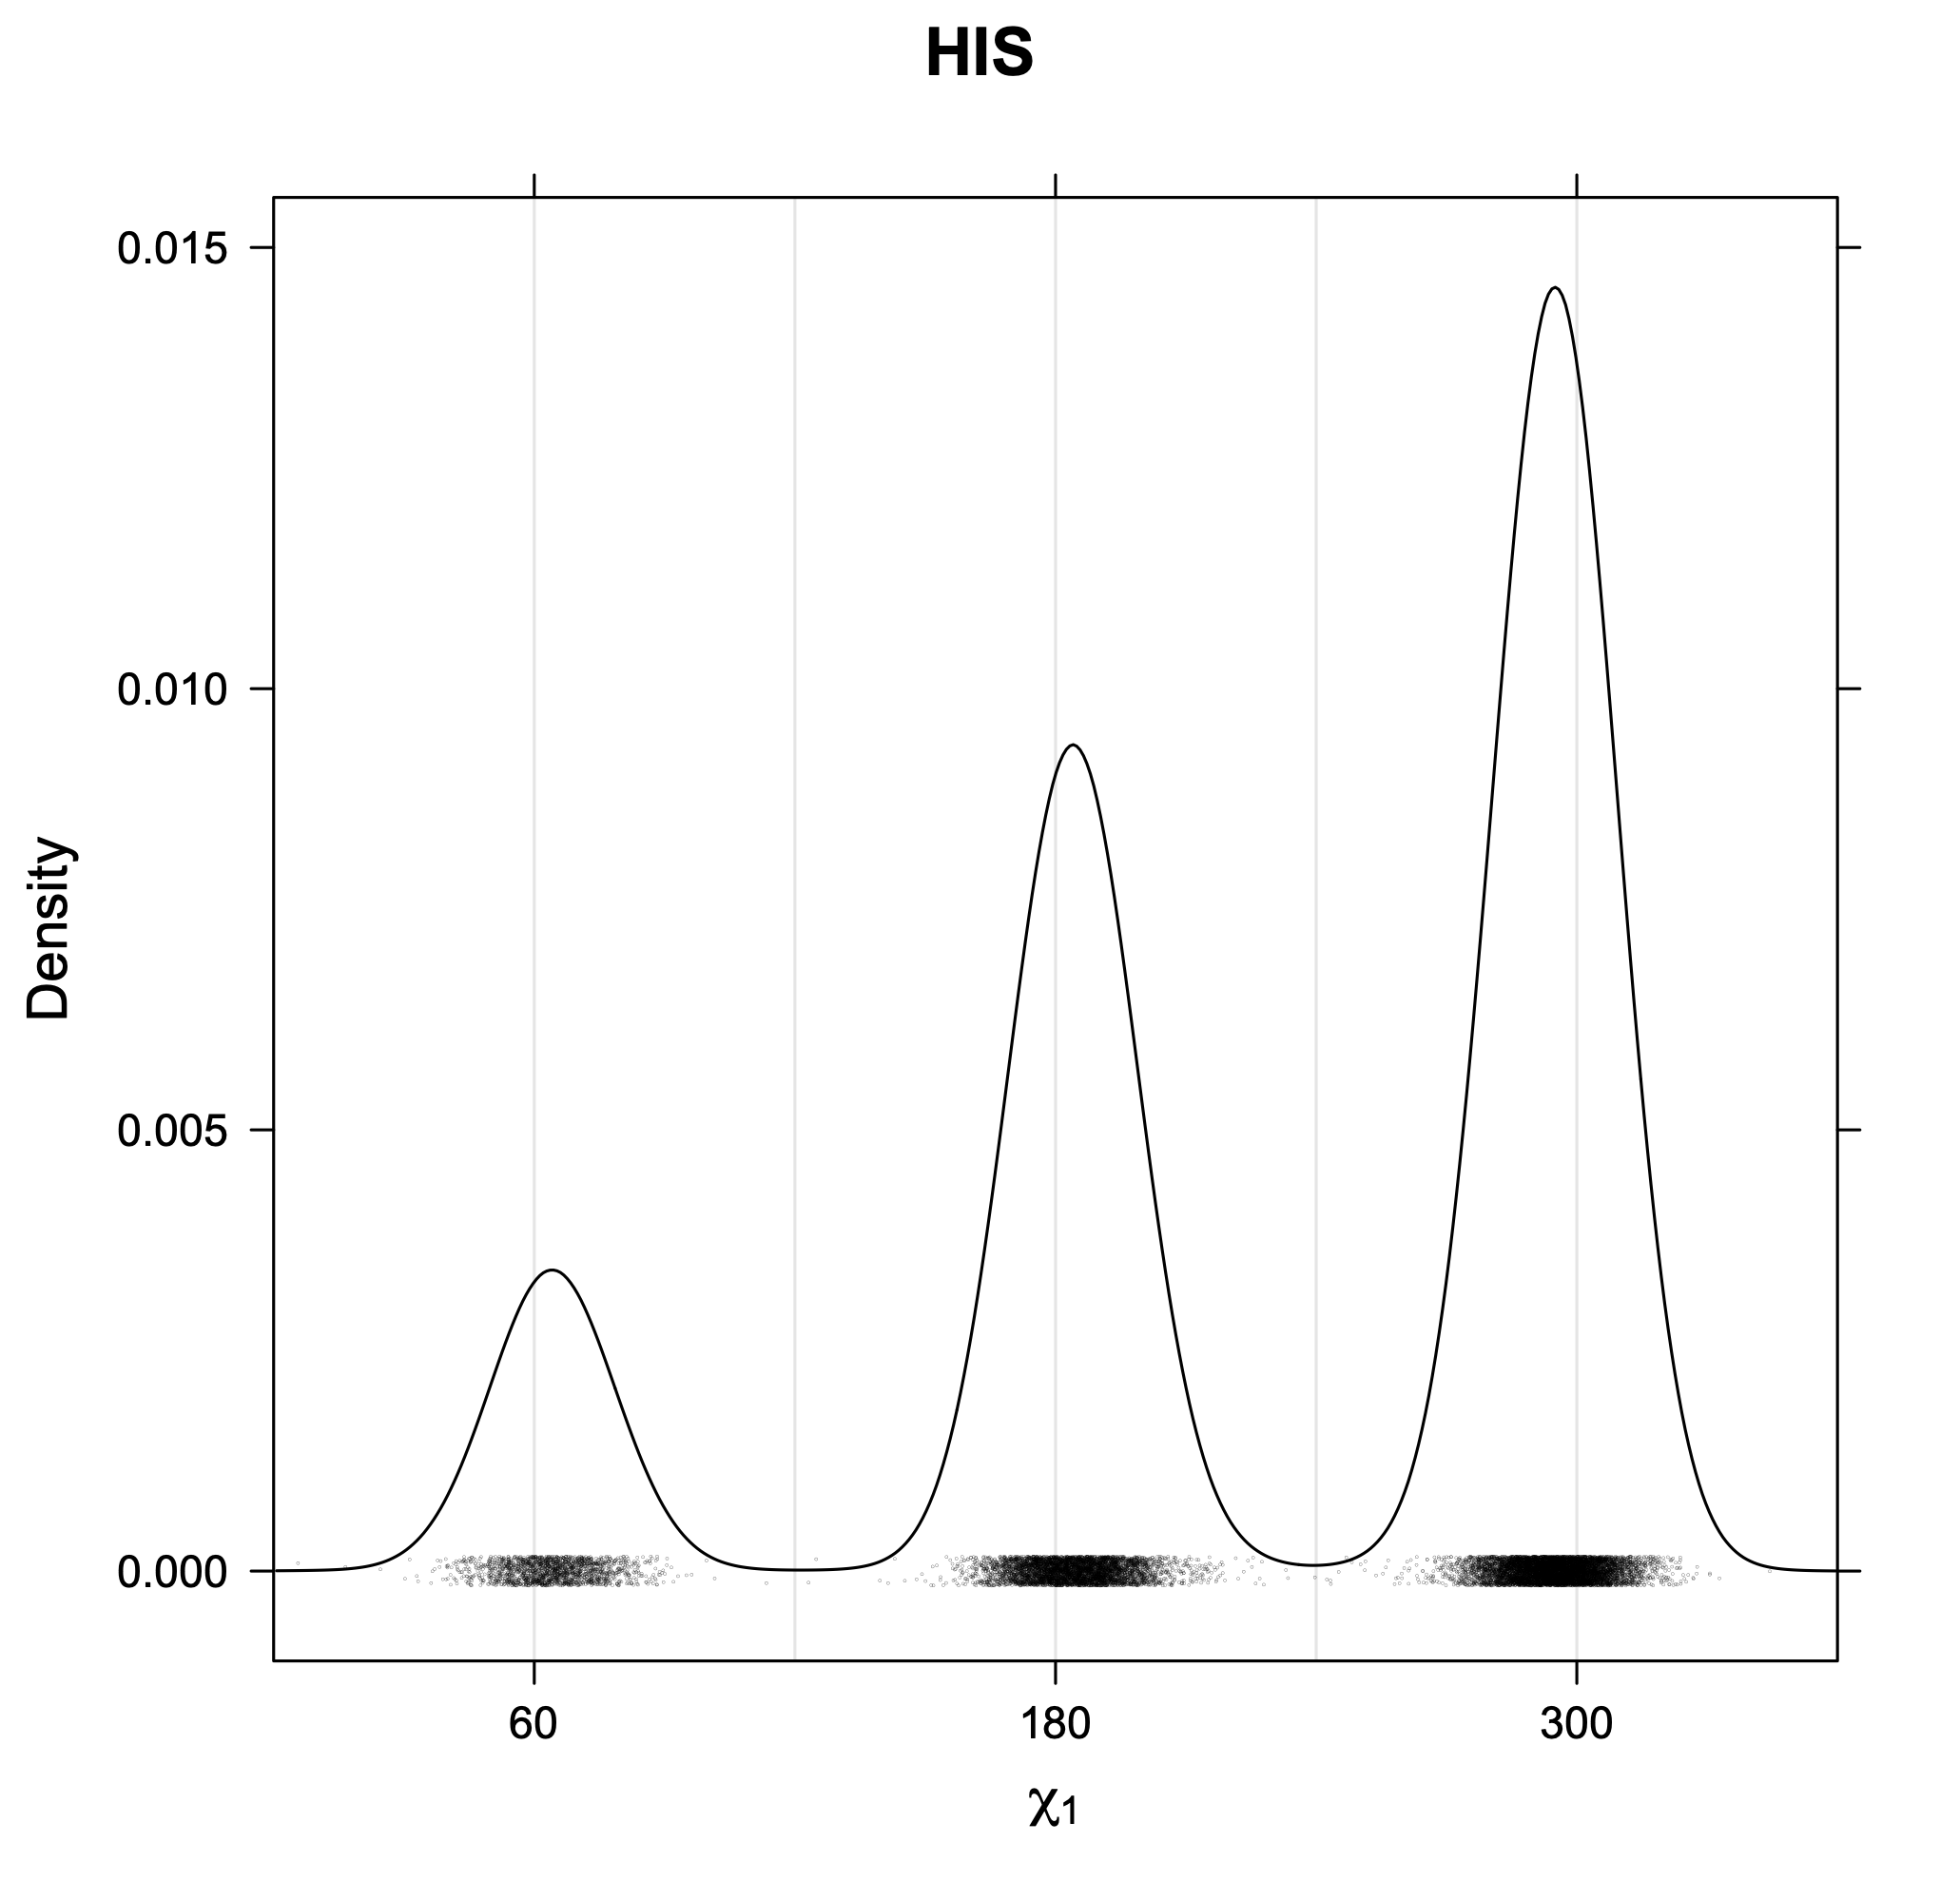
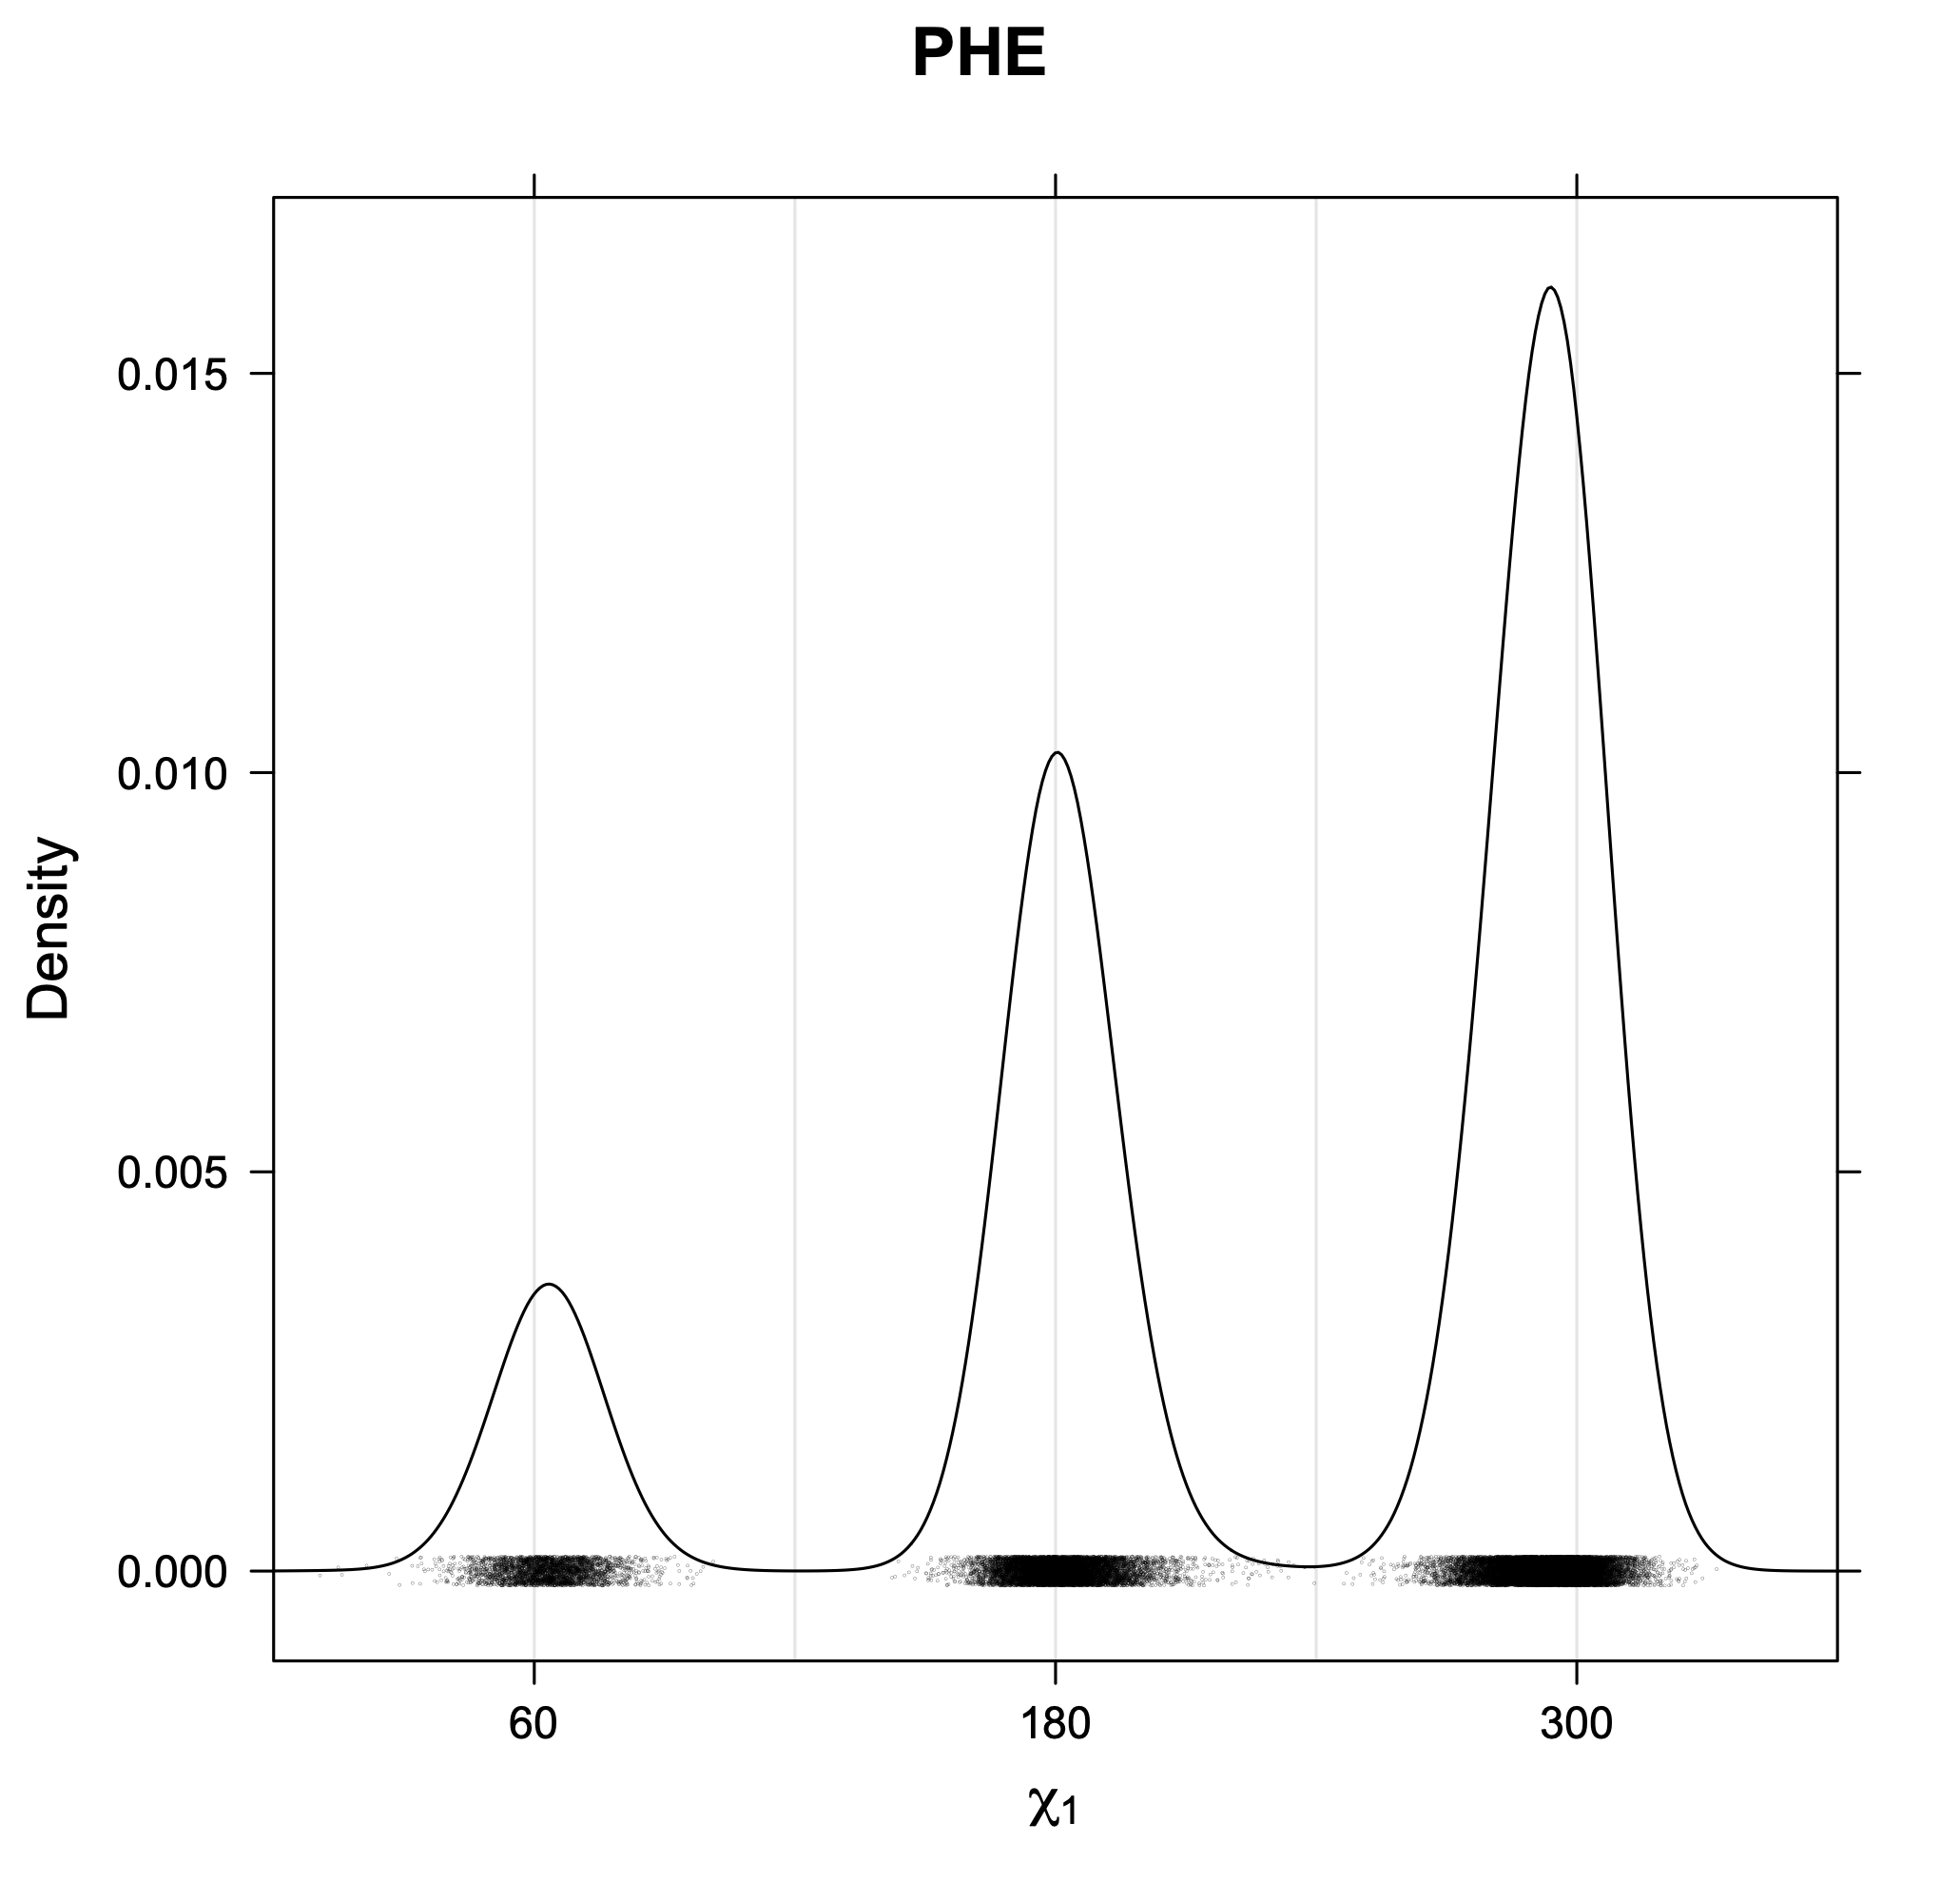
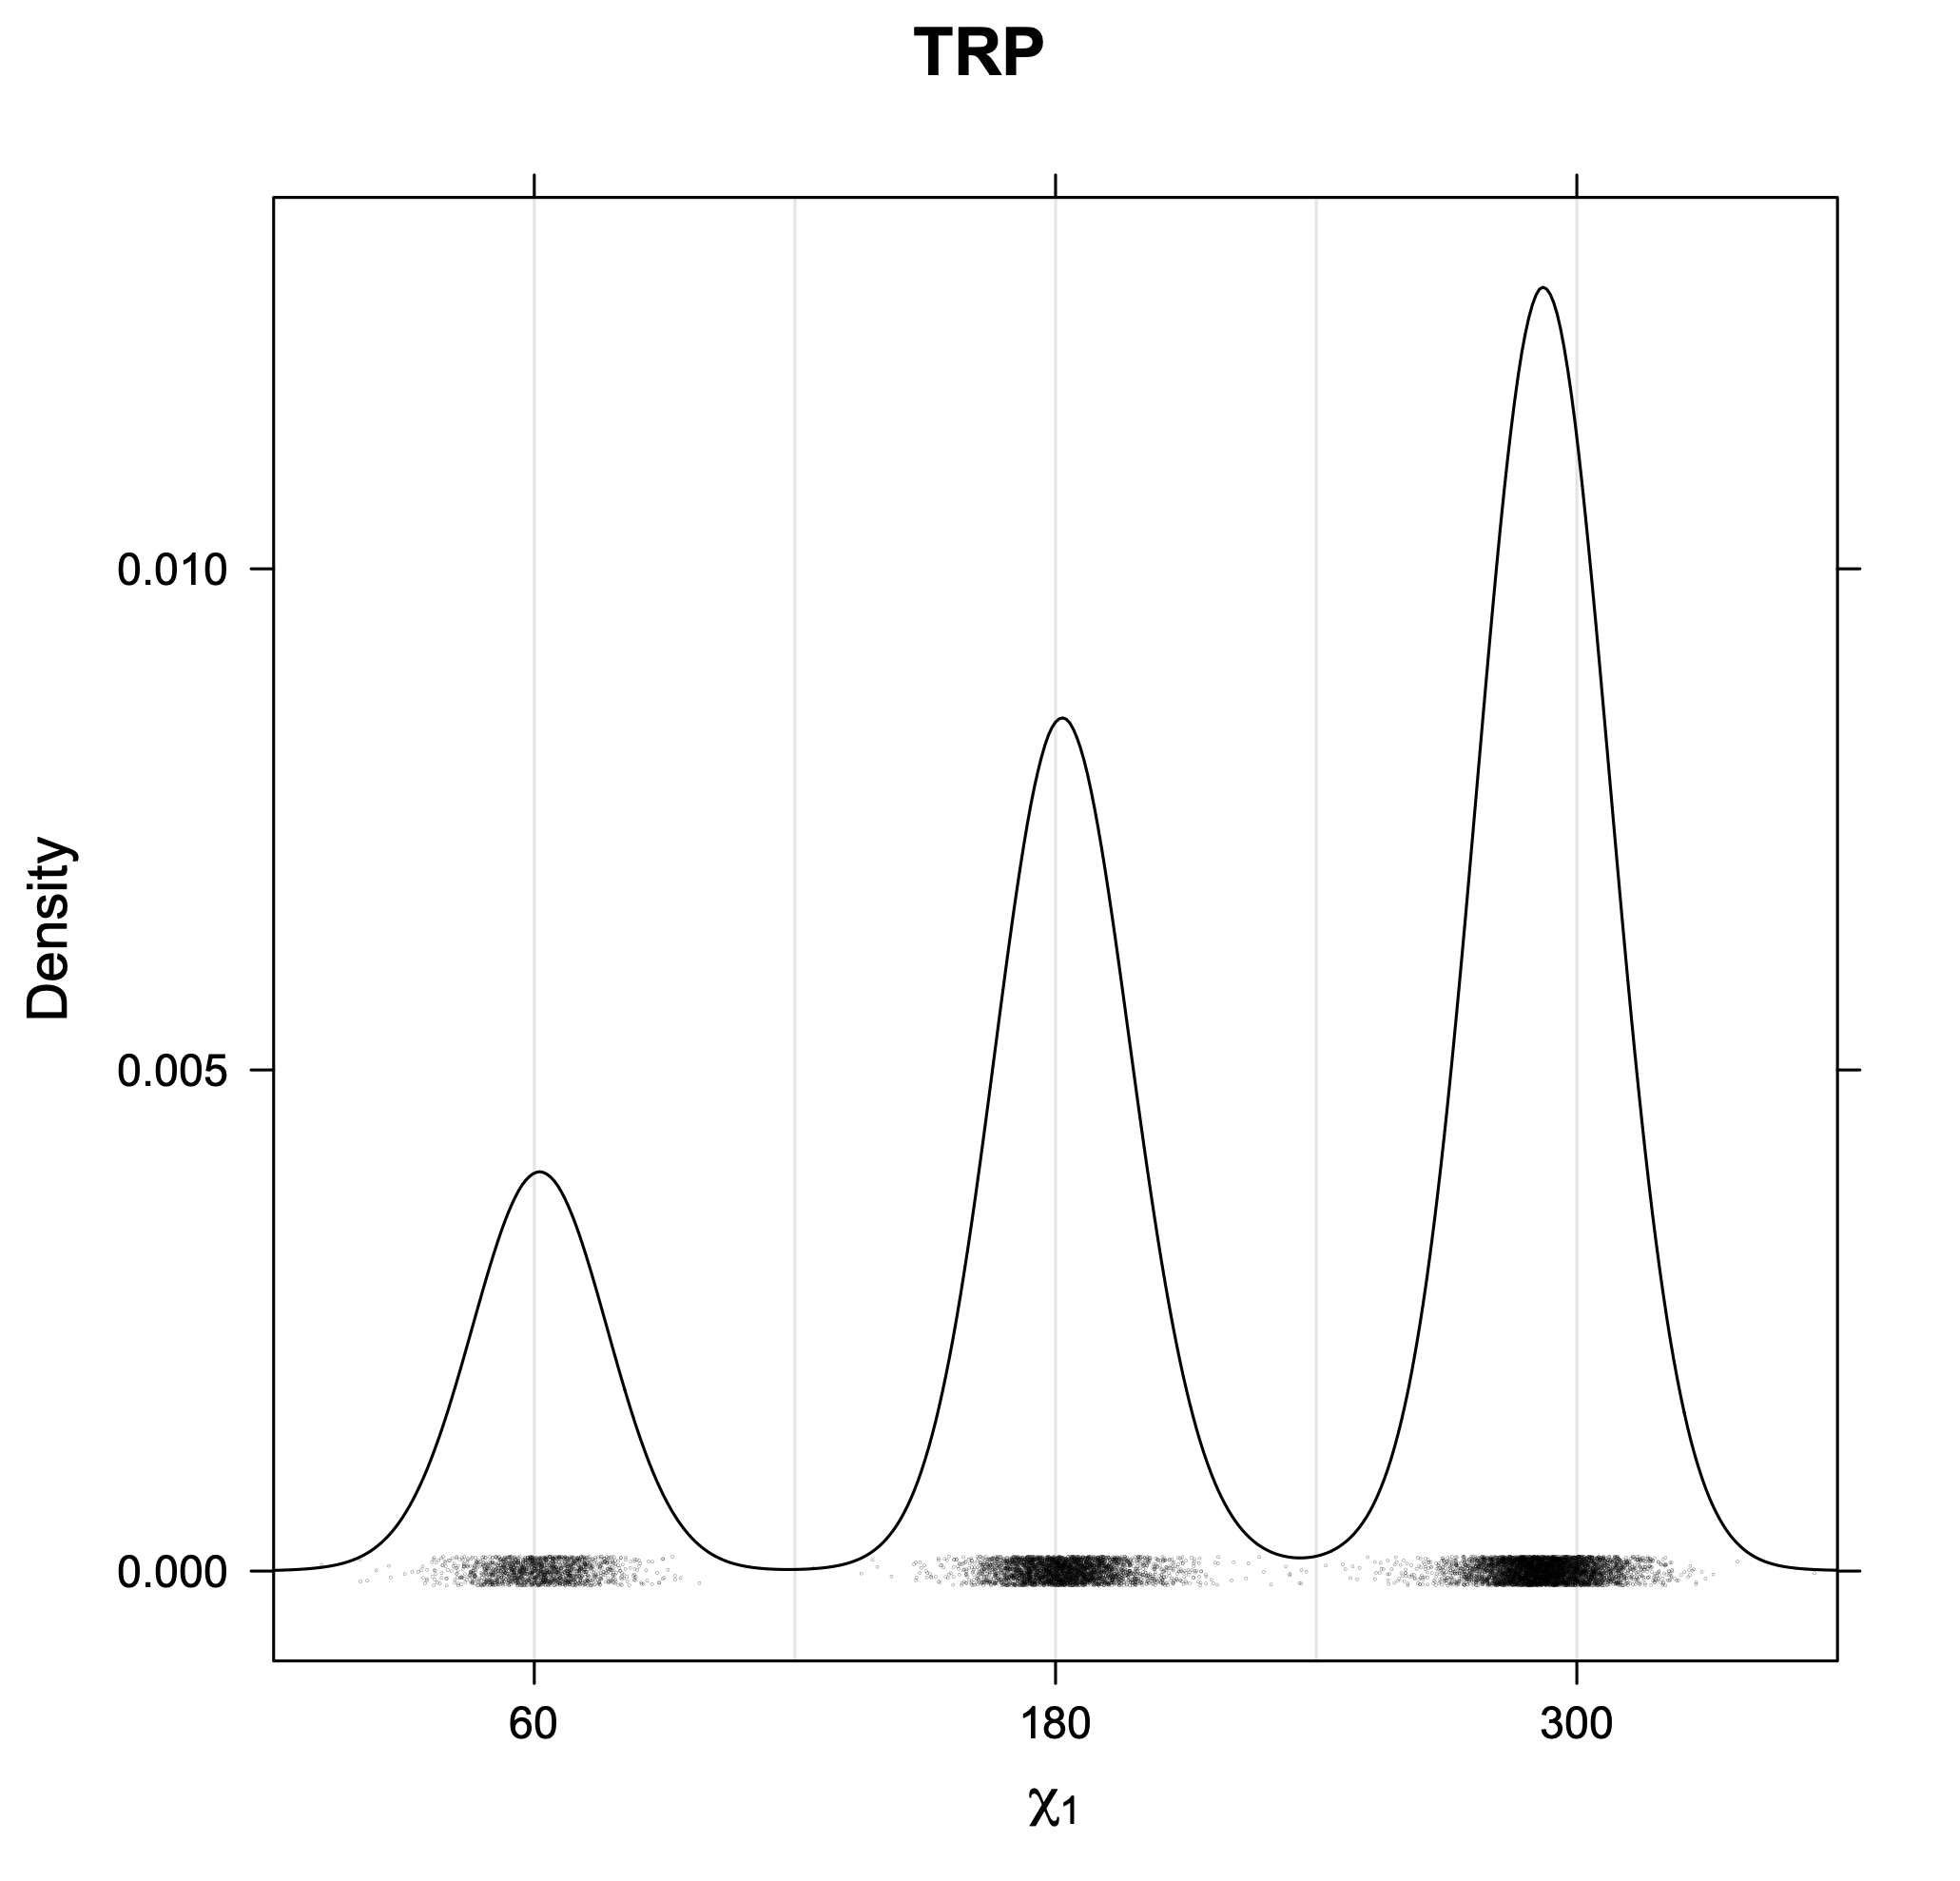
3. Kernel density estimates of χ1
The following figures provide kernel density estimates of the χ1 dihedral angle for each residue type.


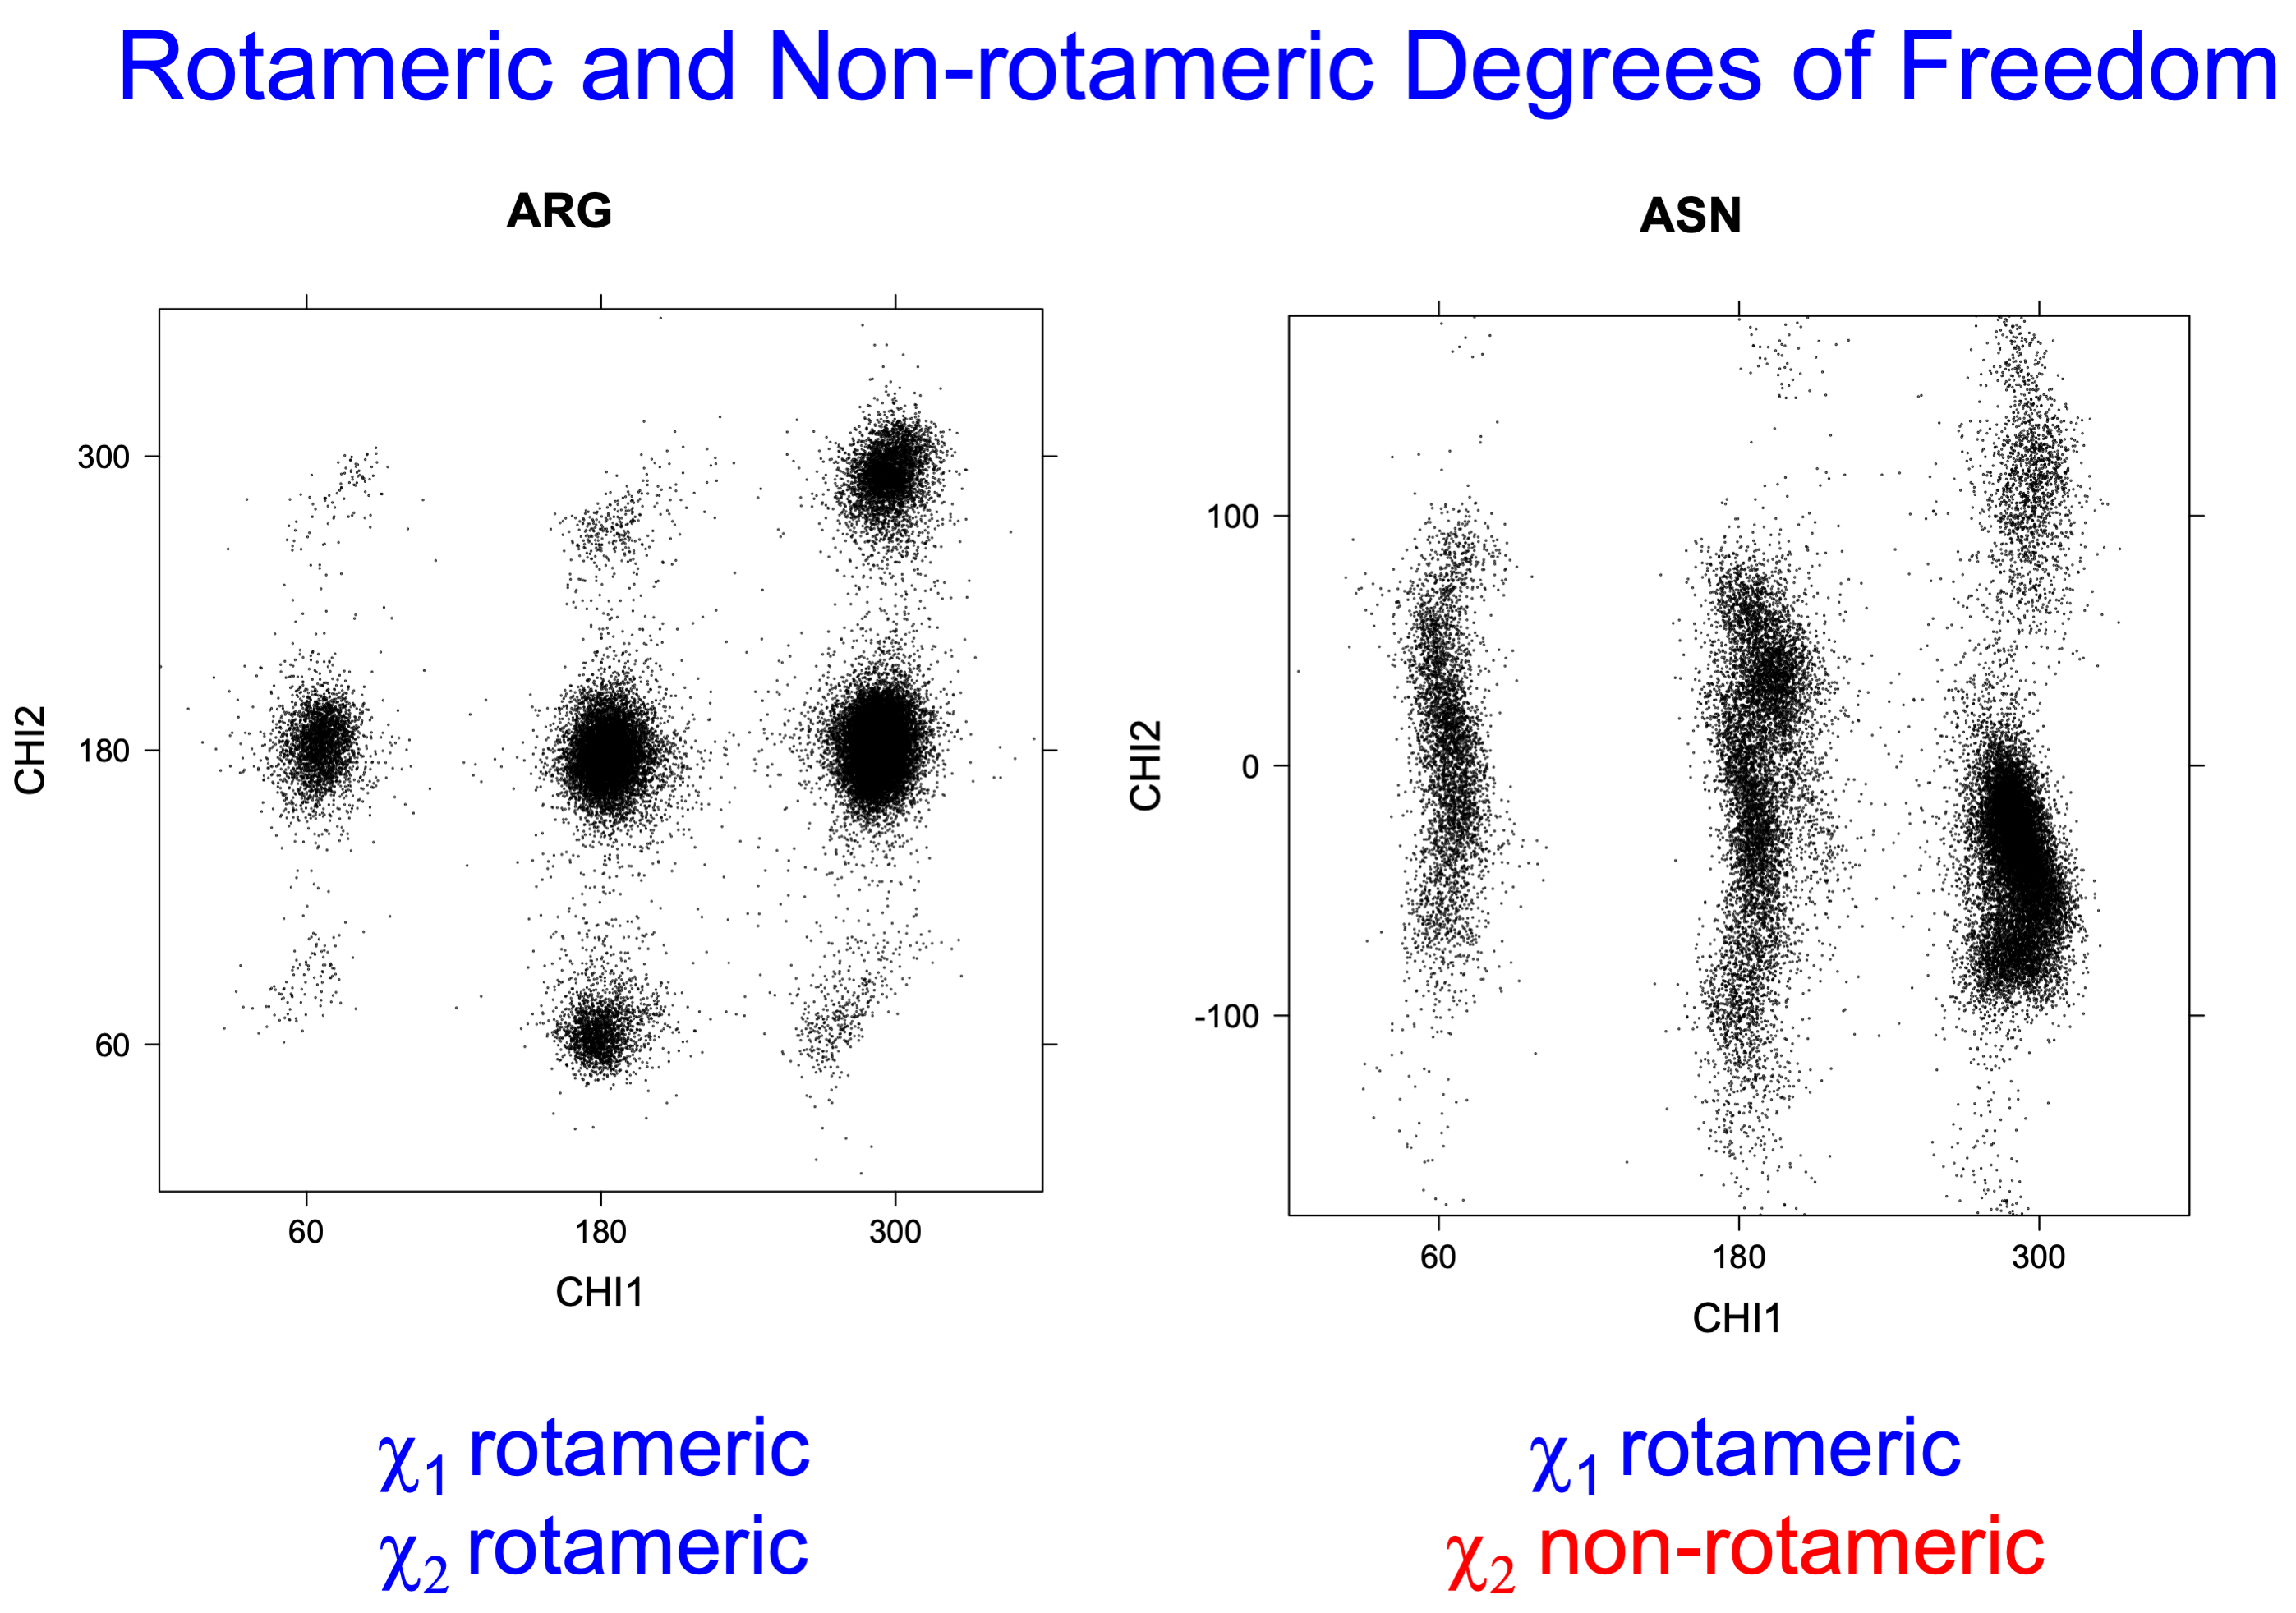
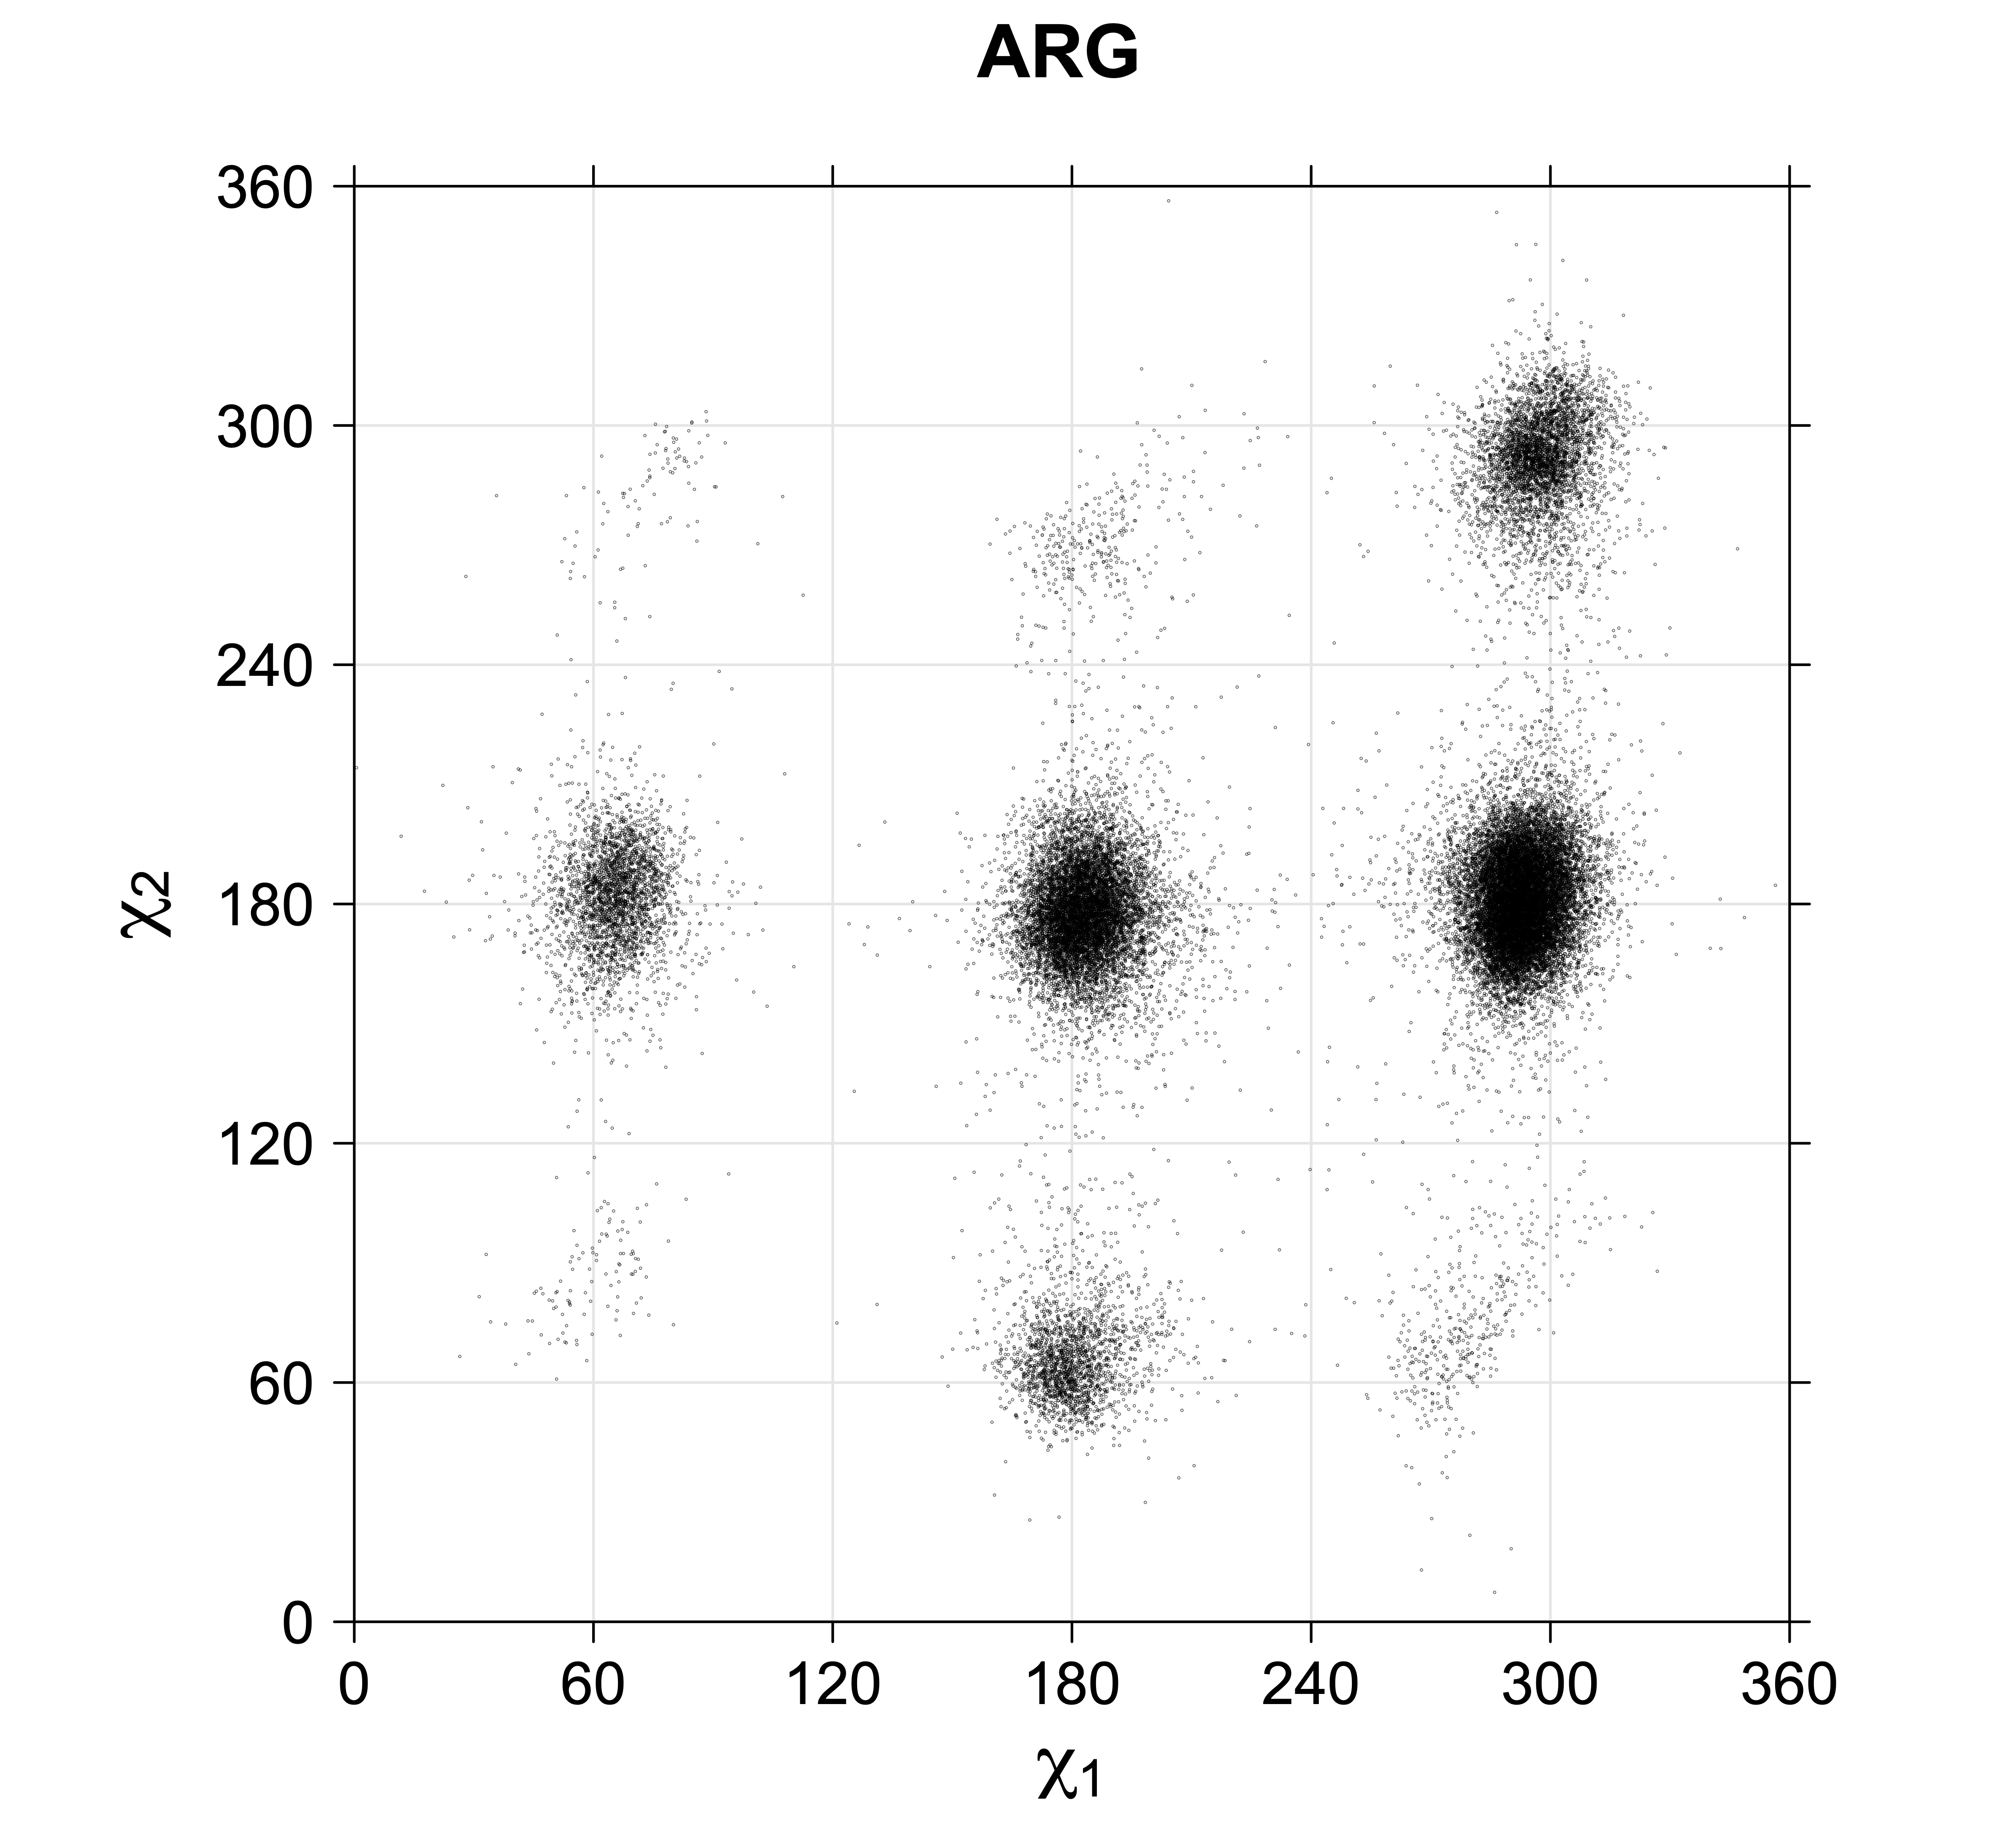
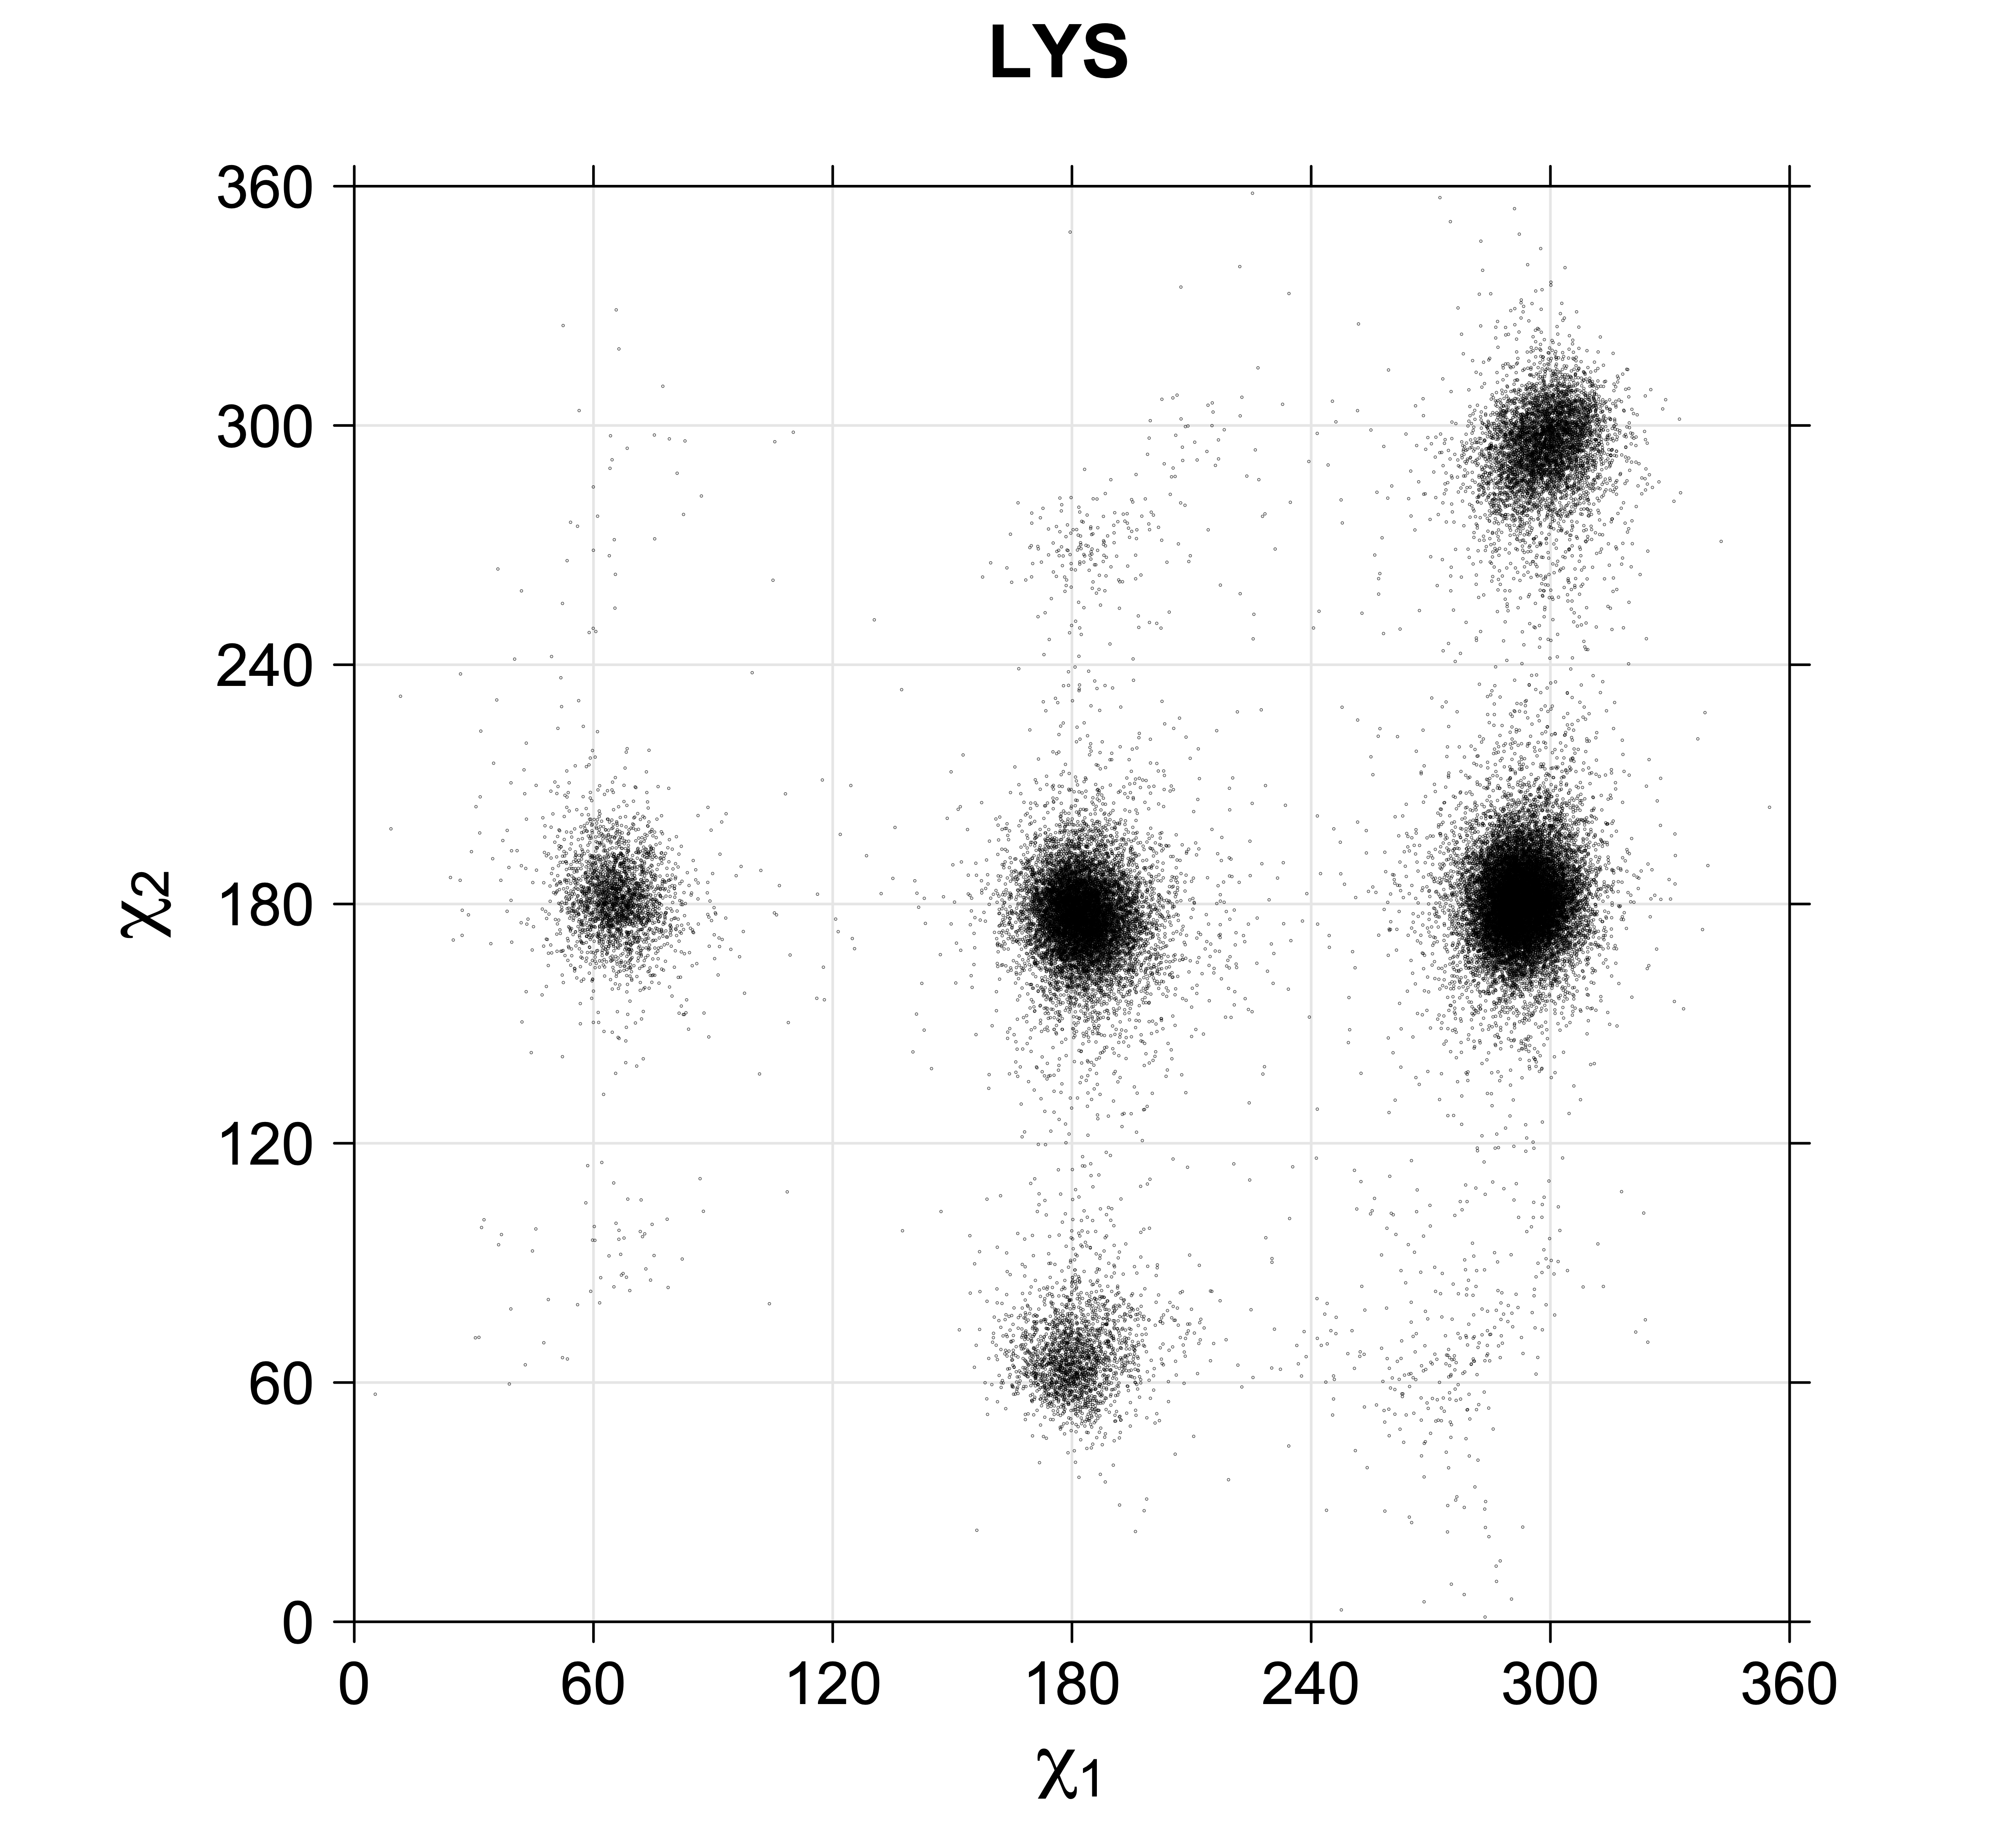
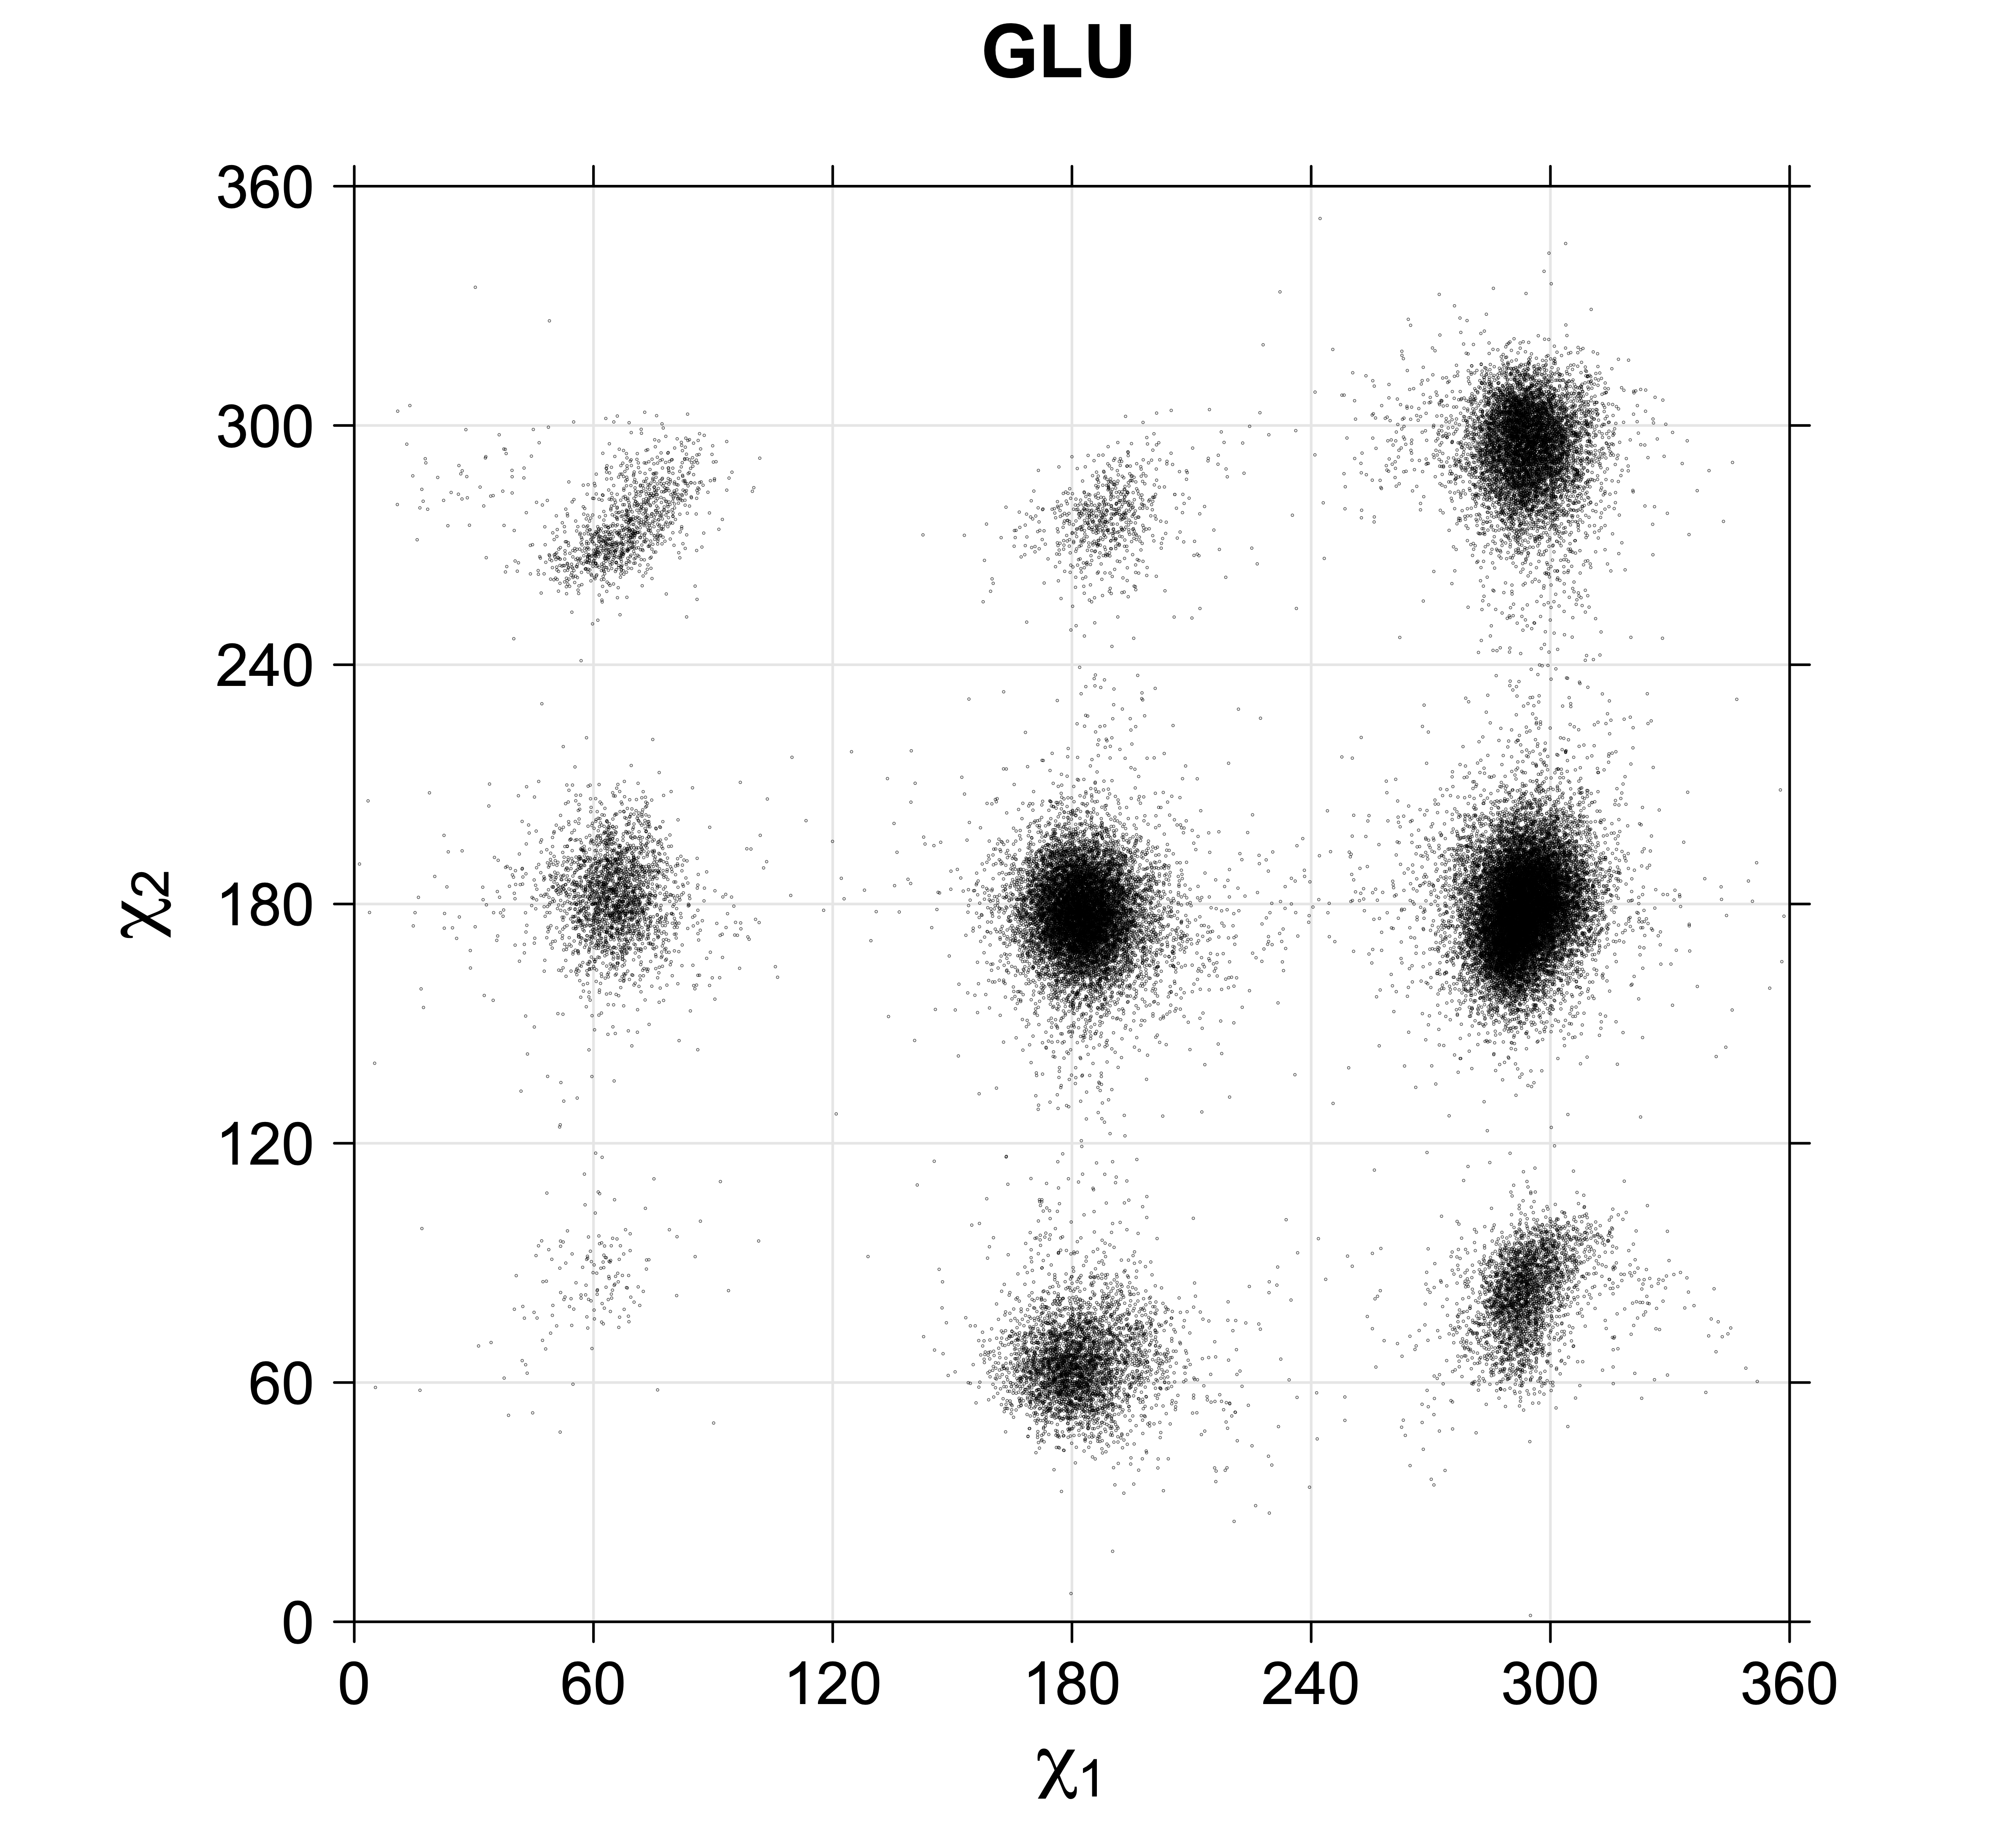
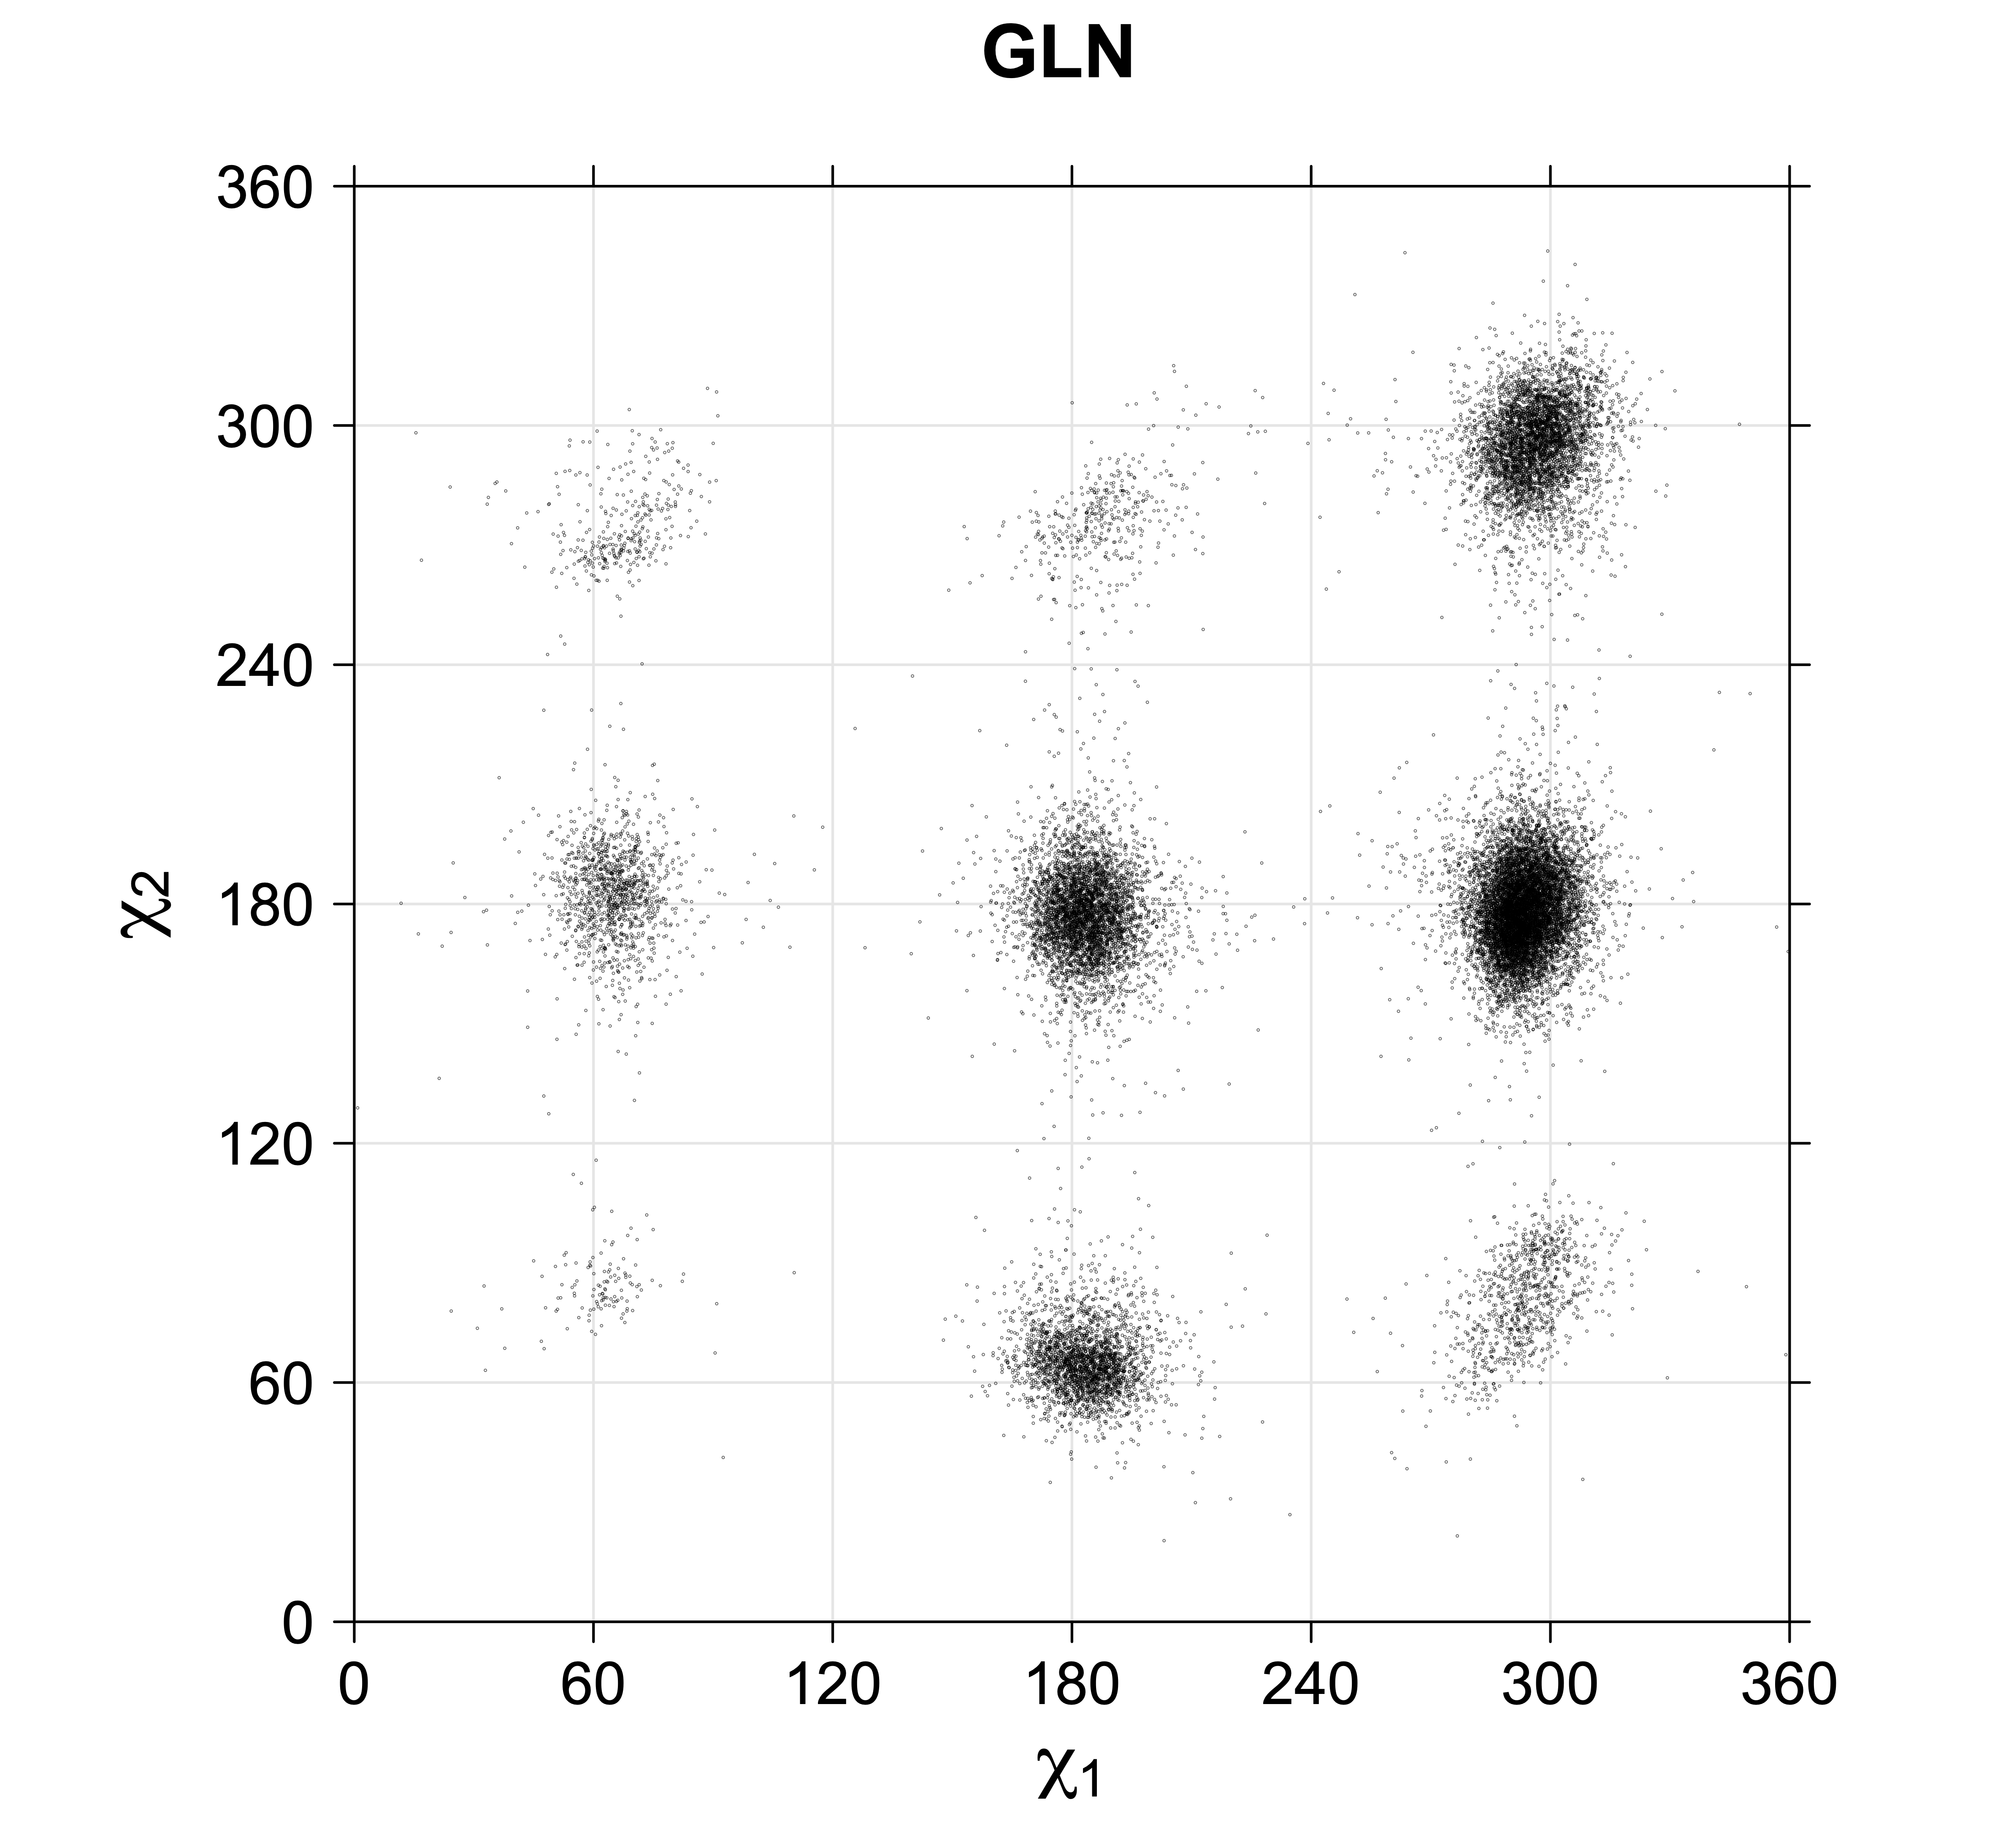
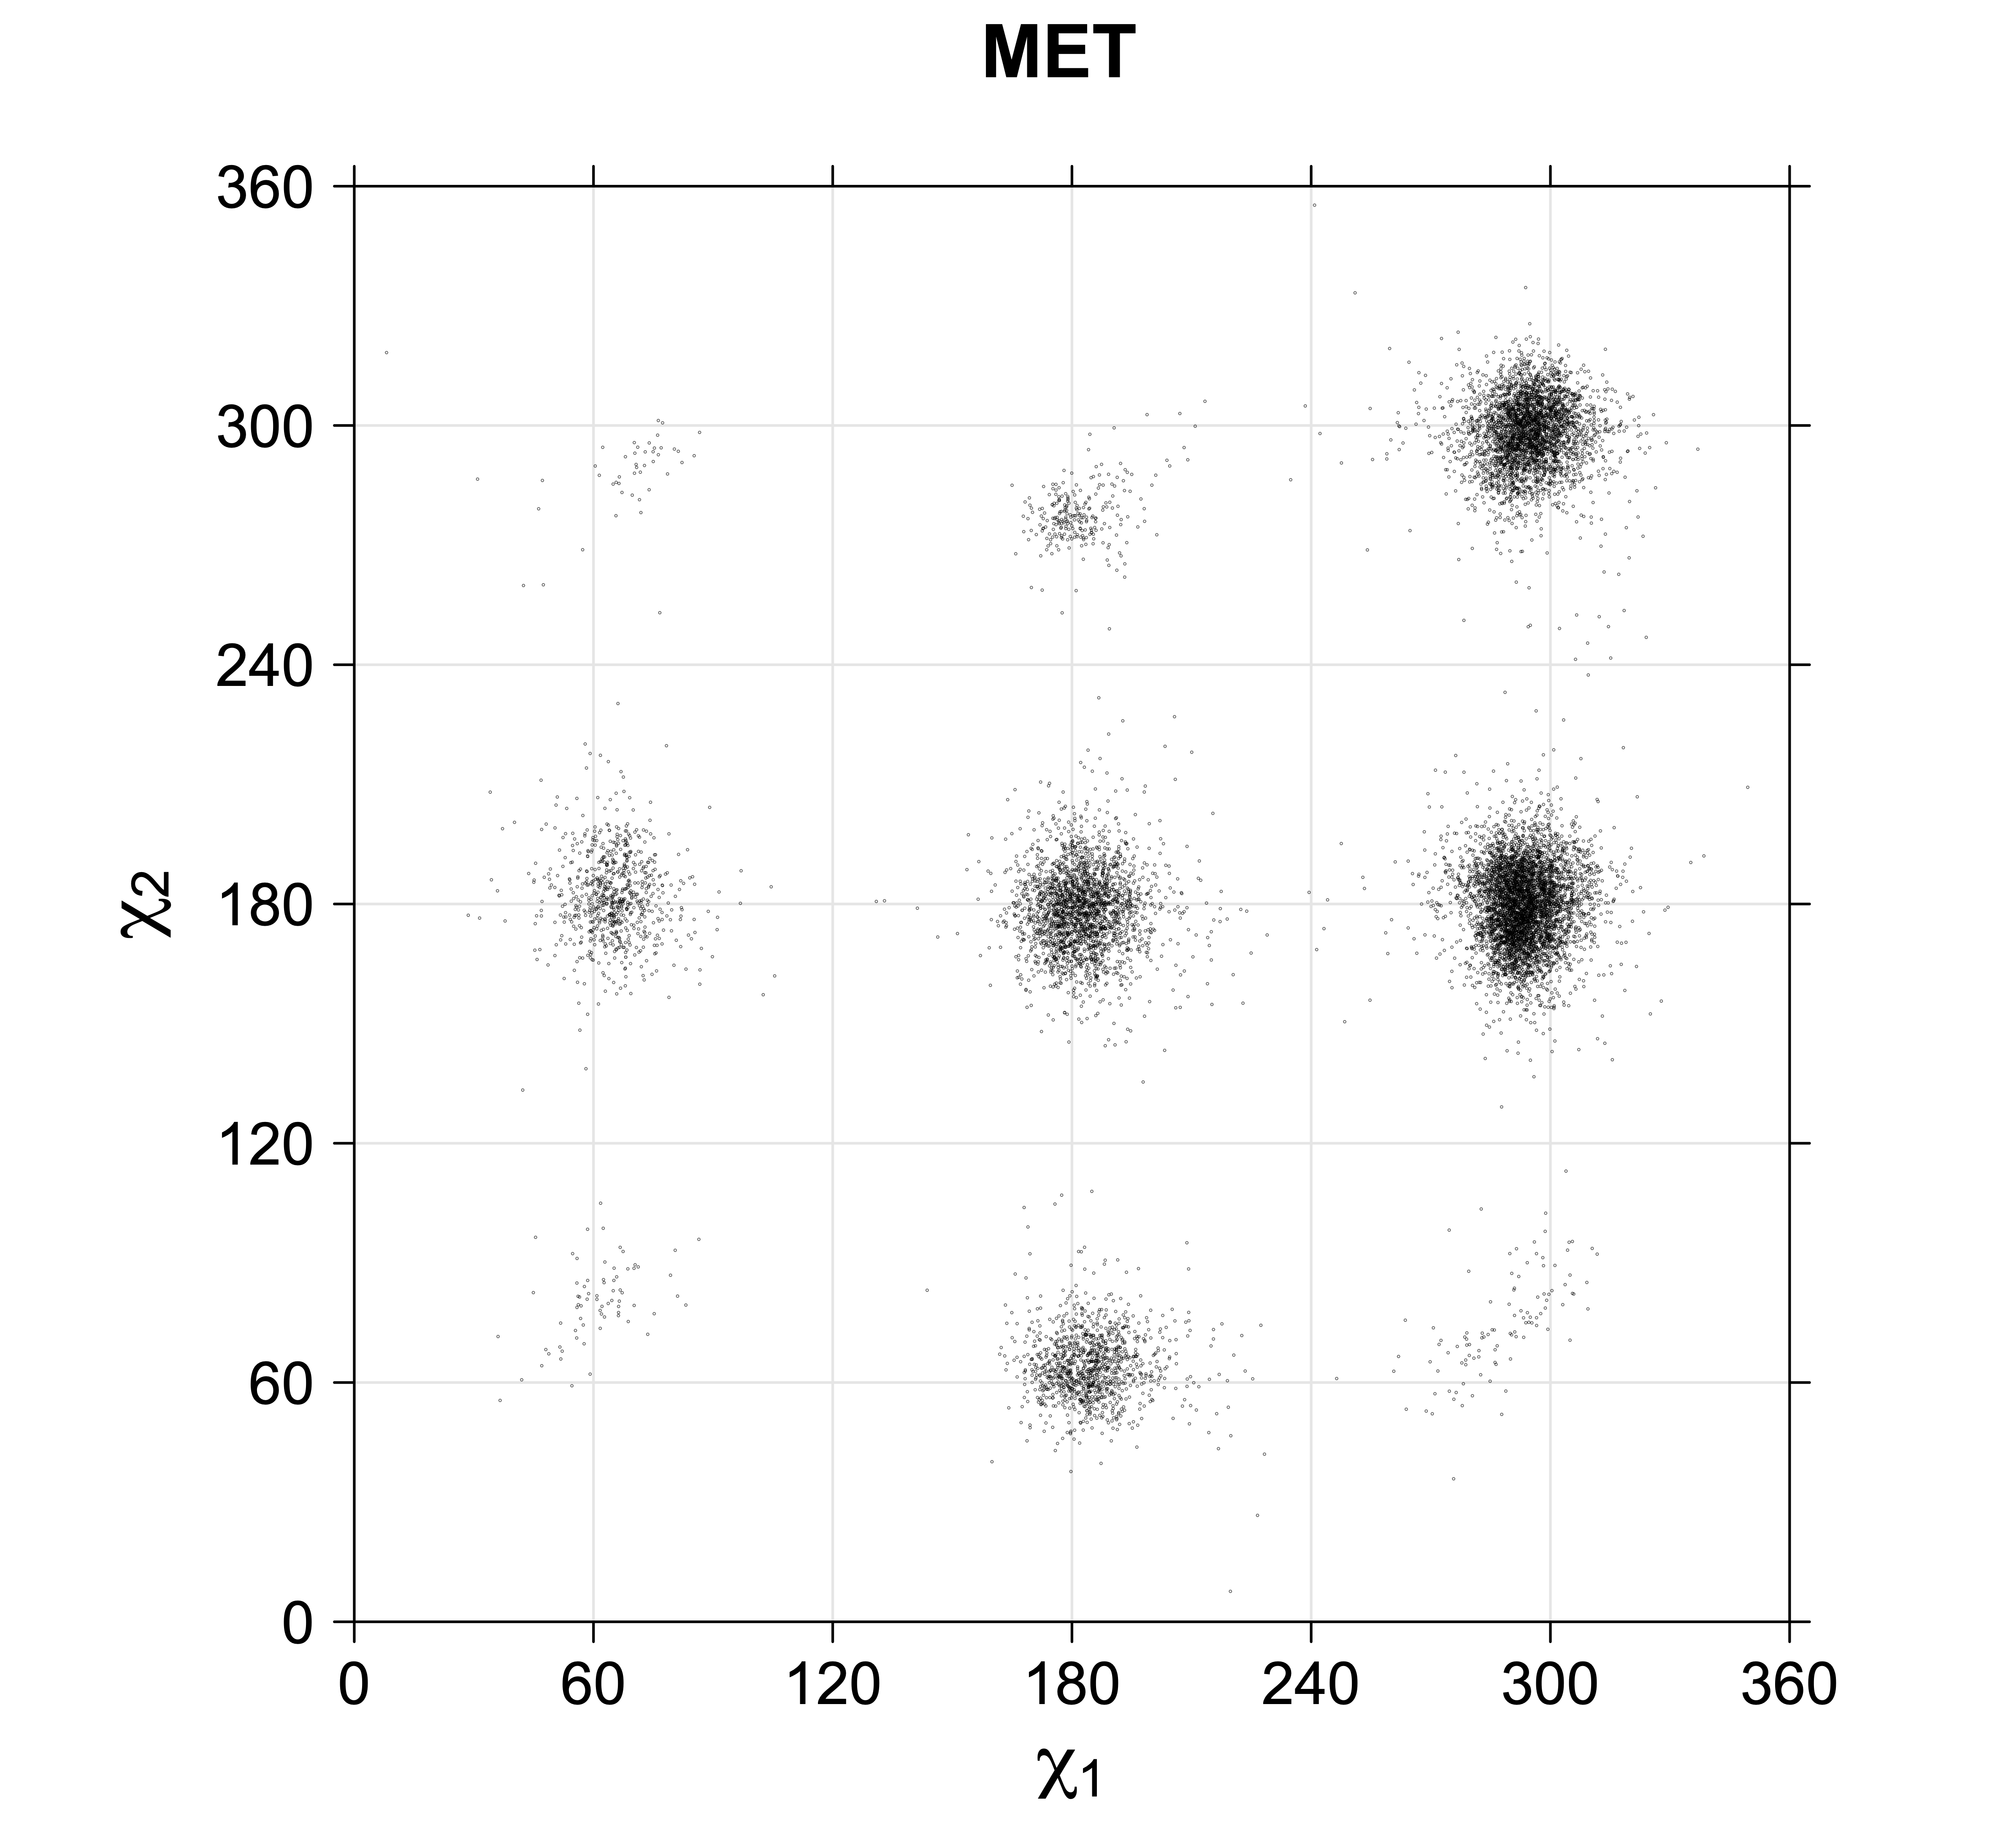
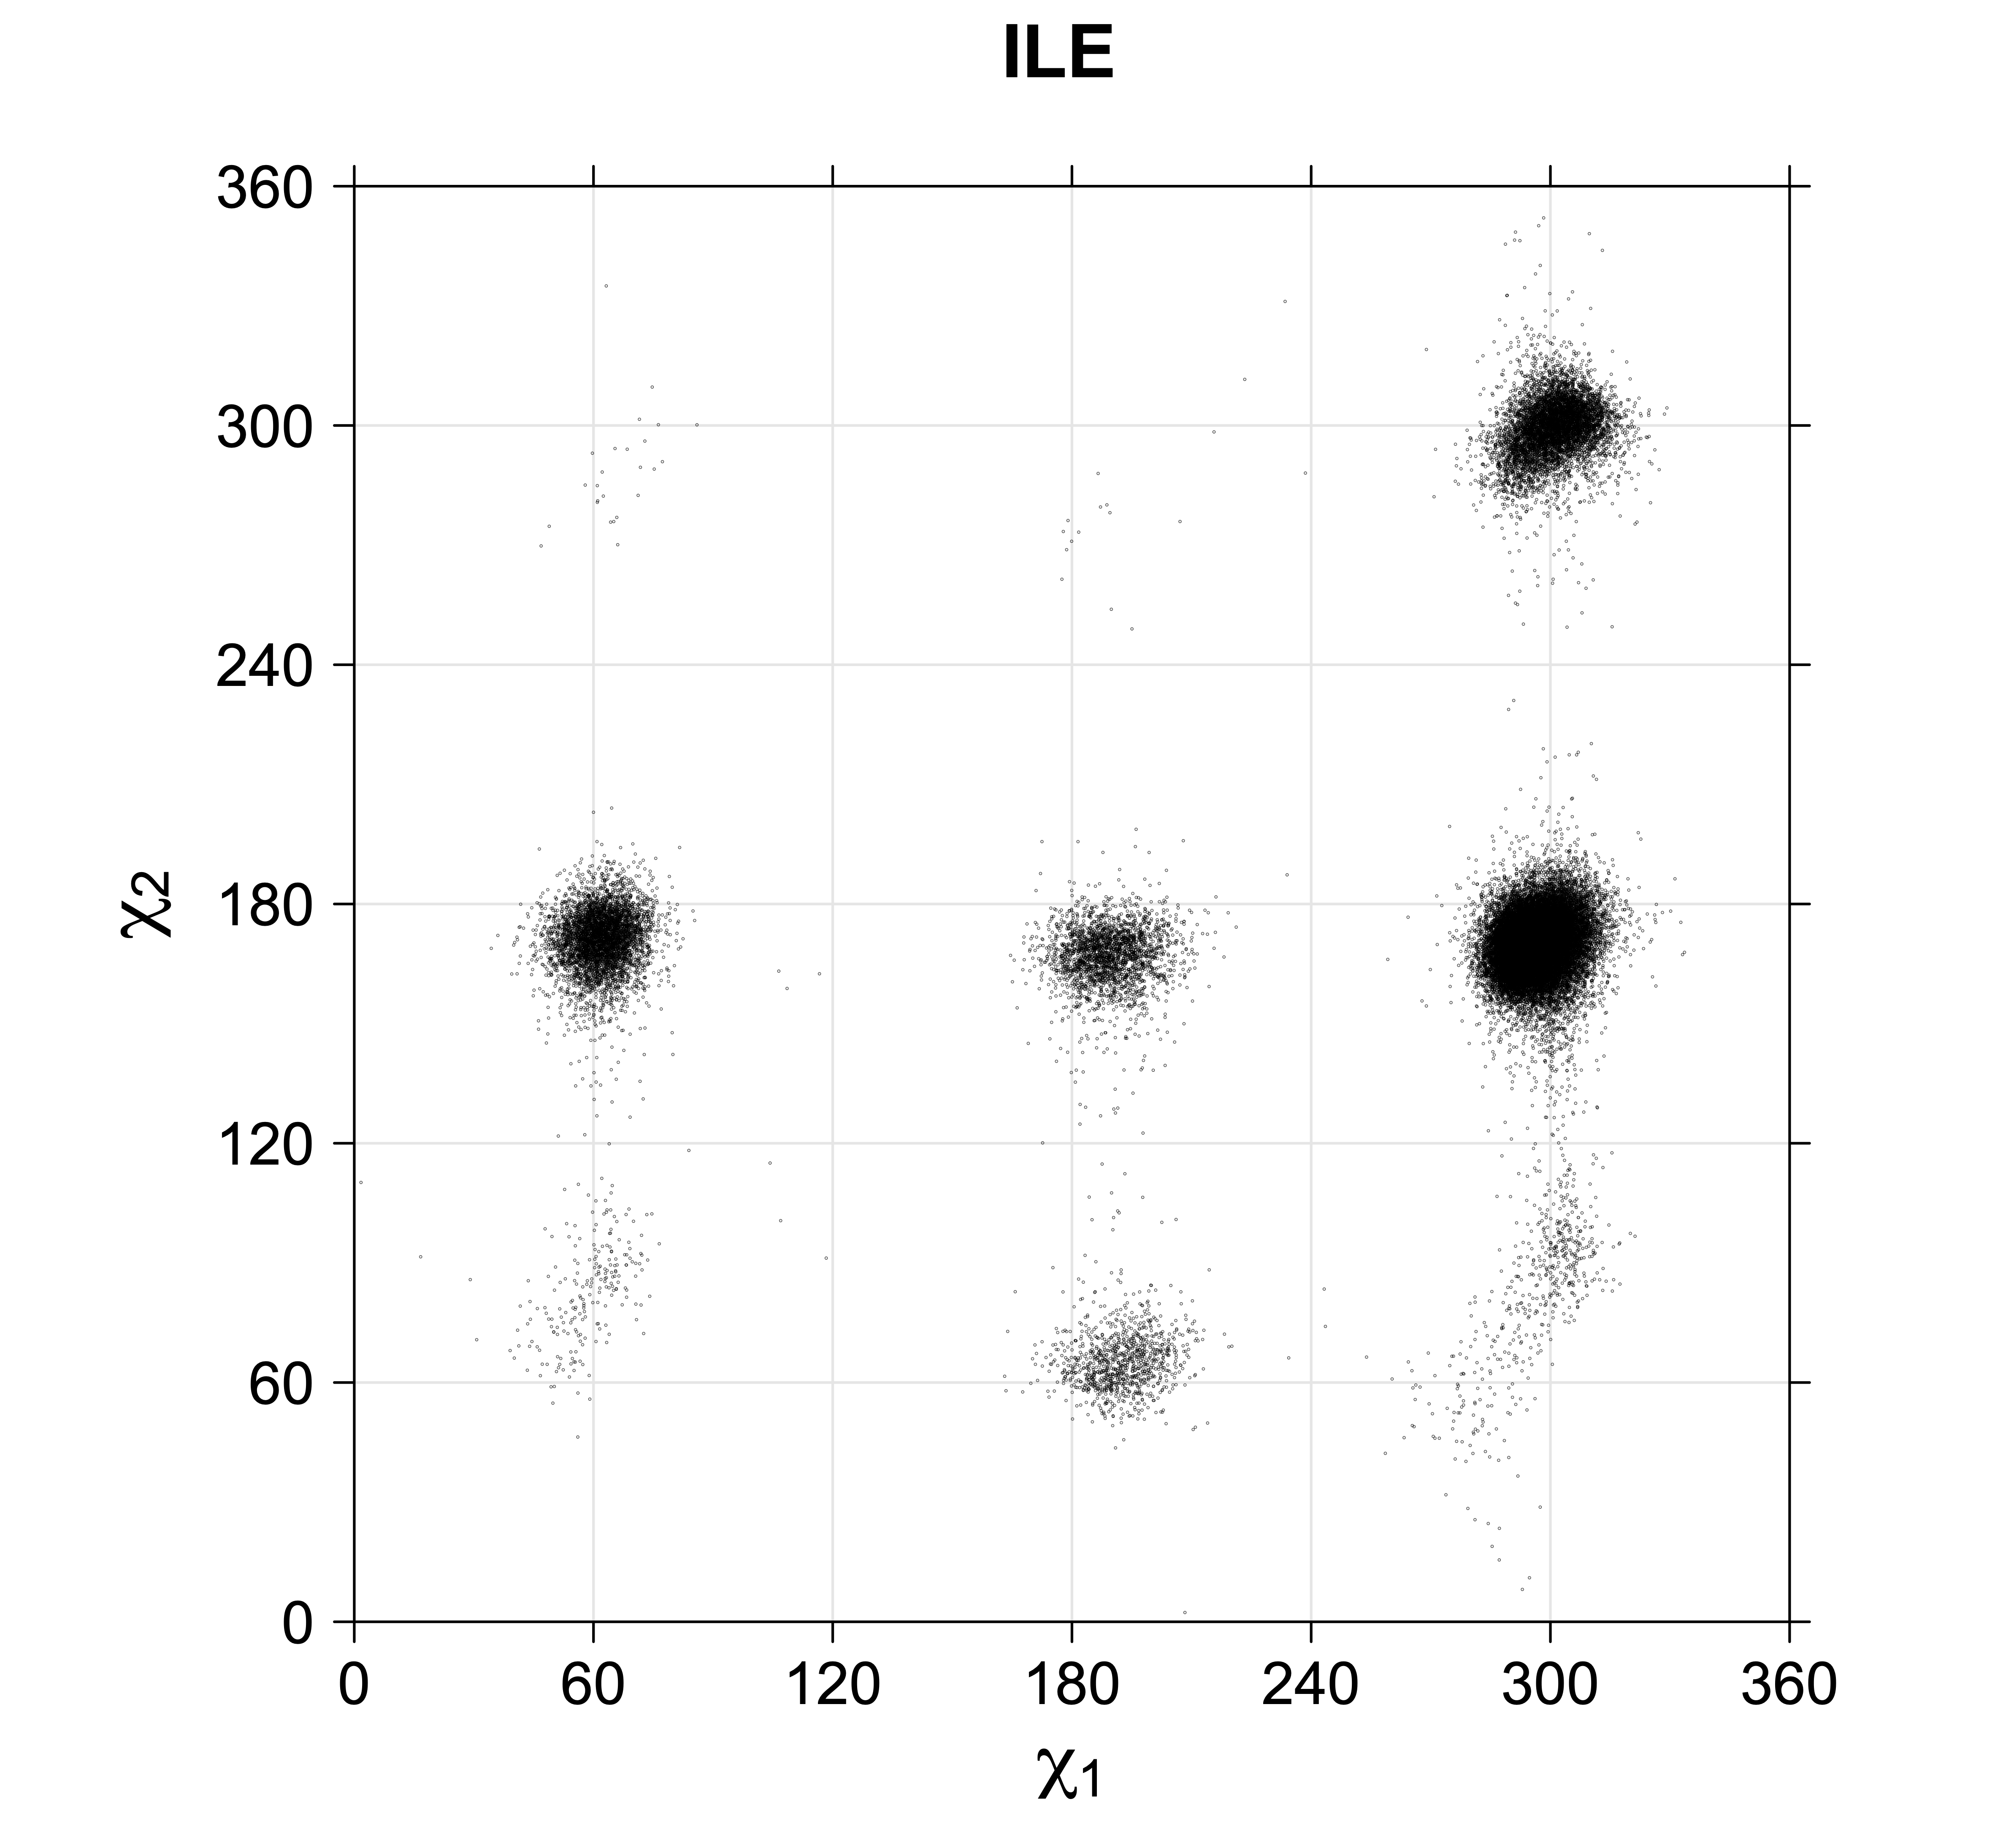
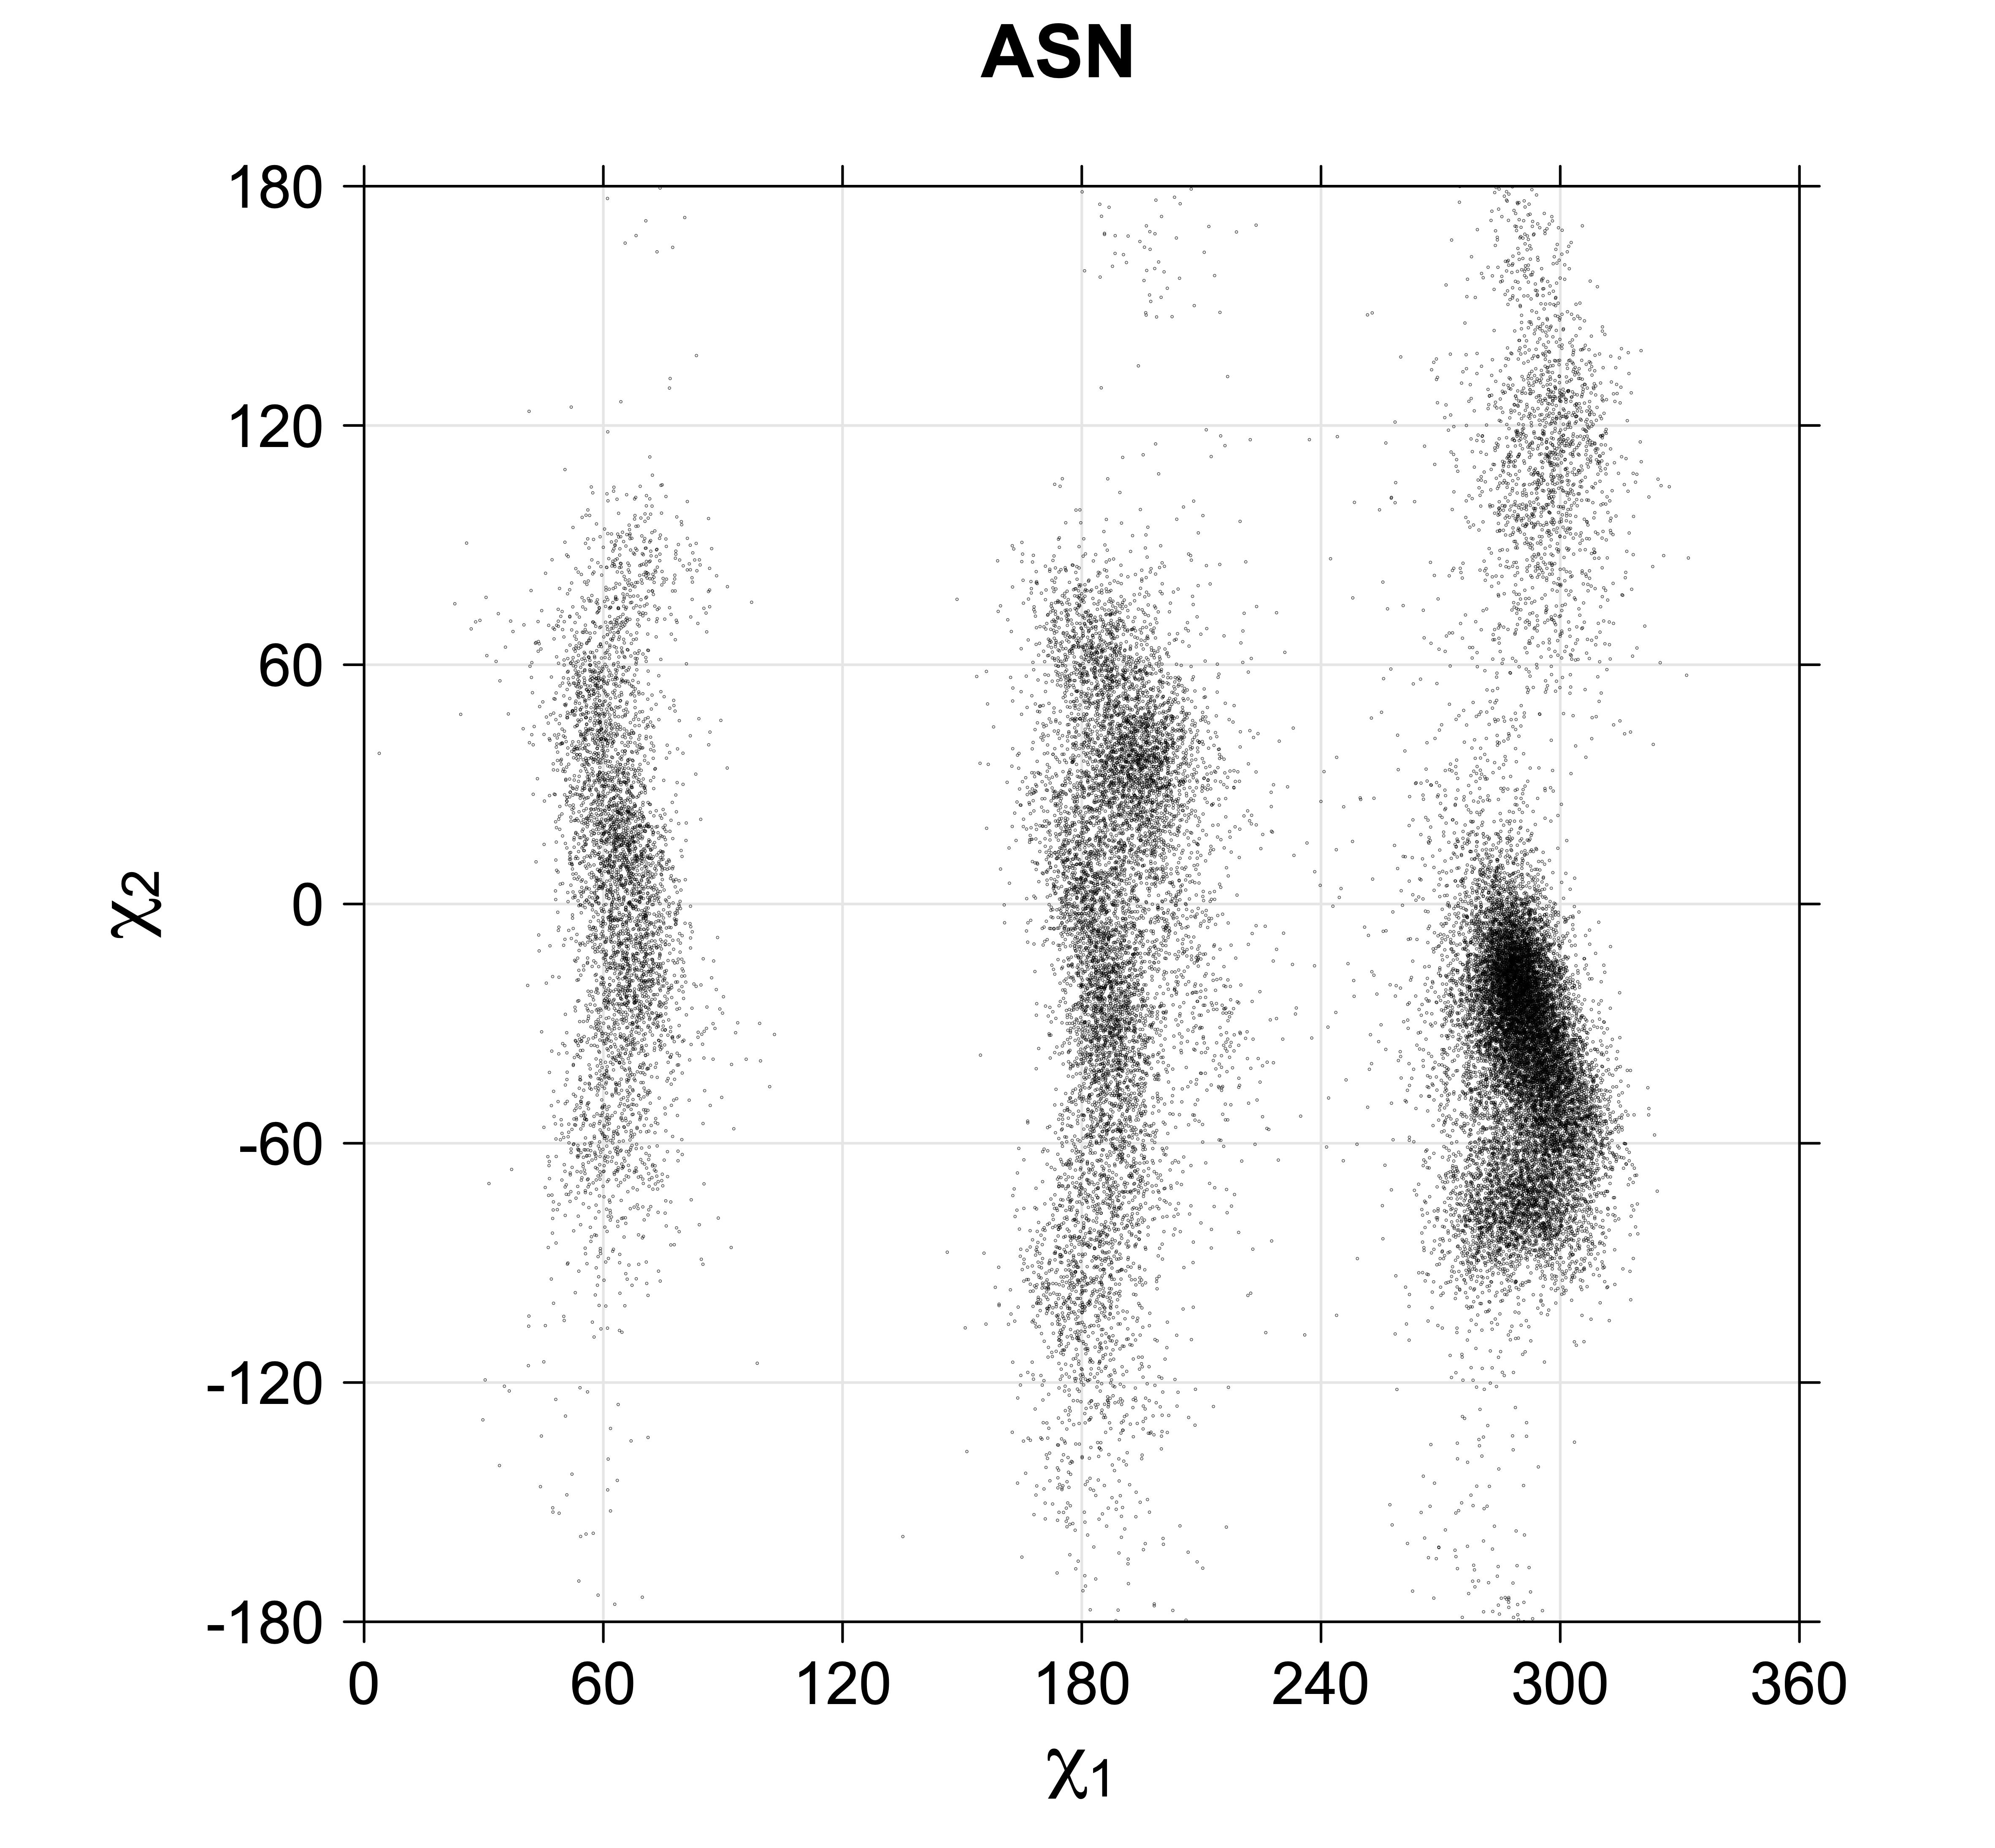
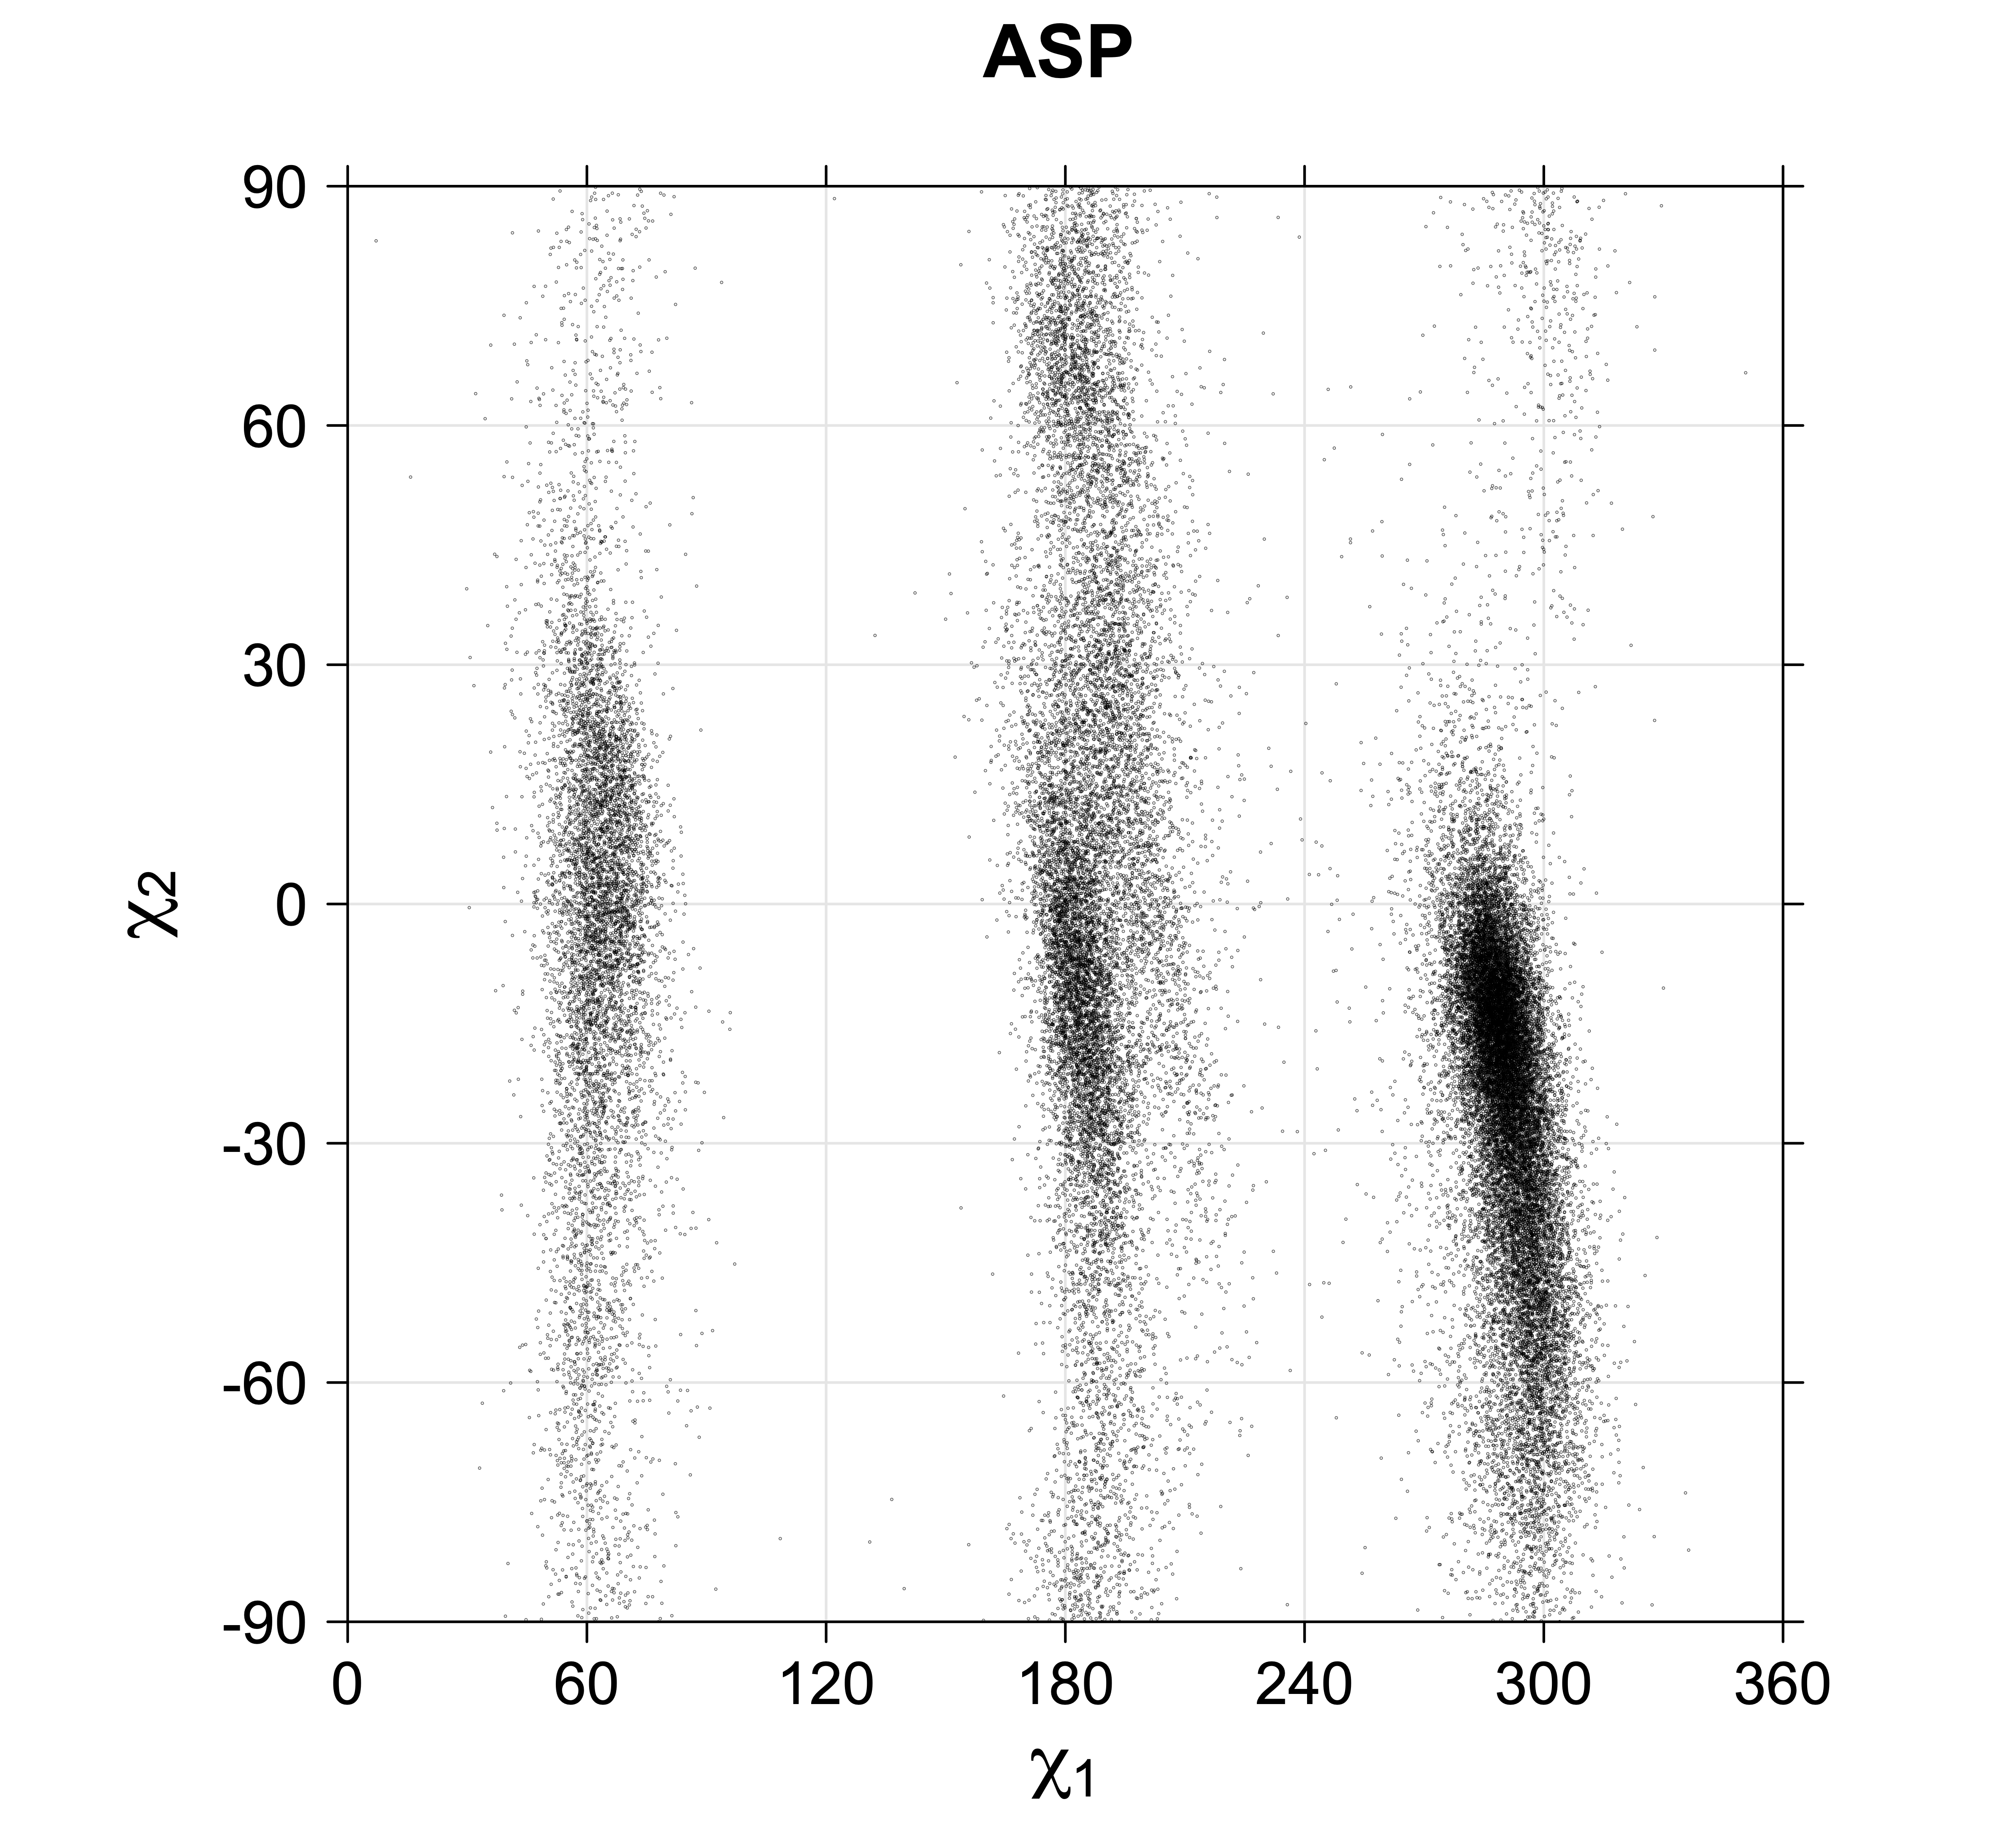
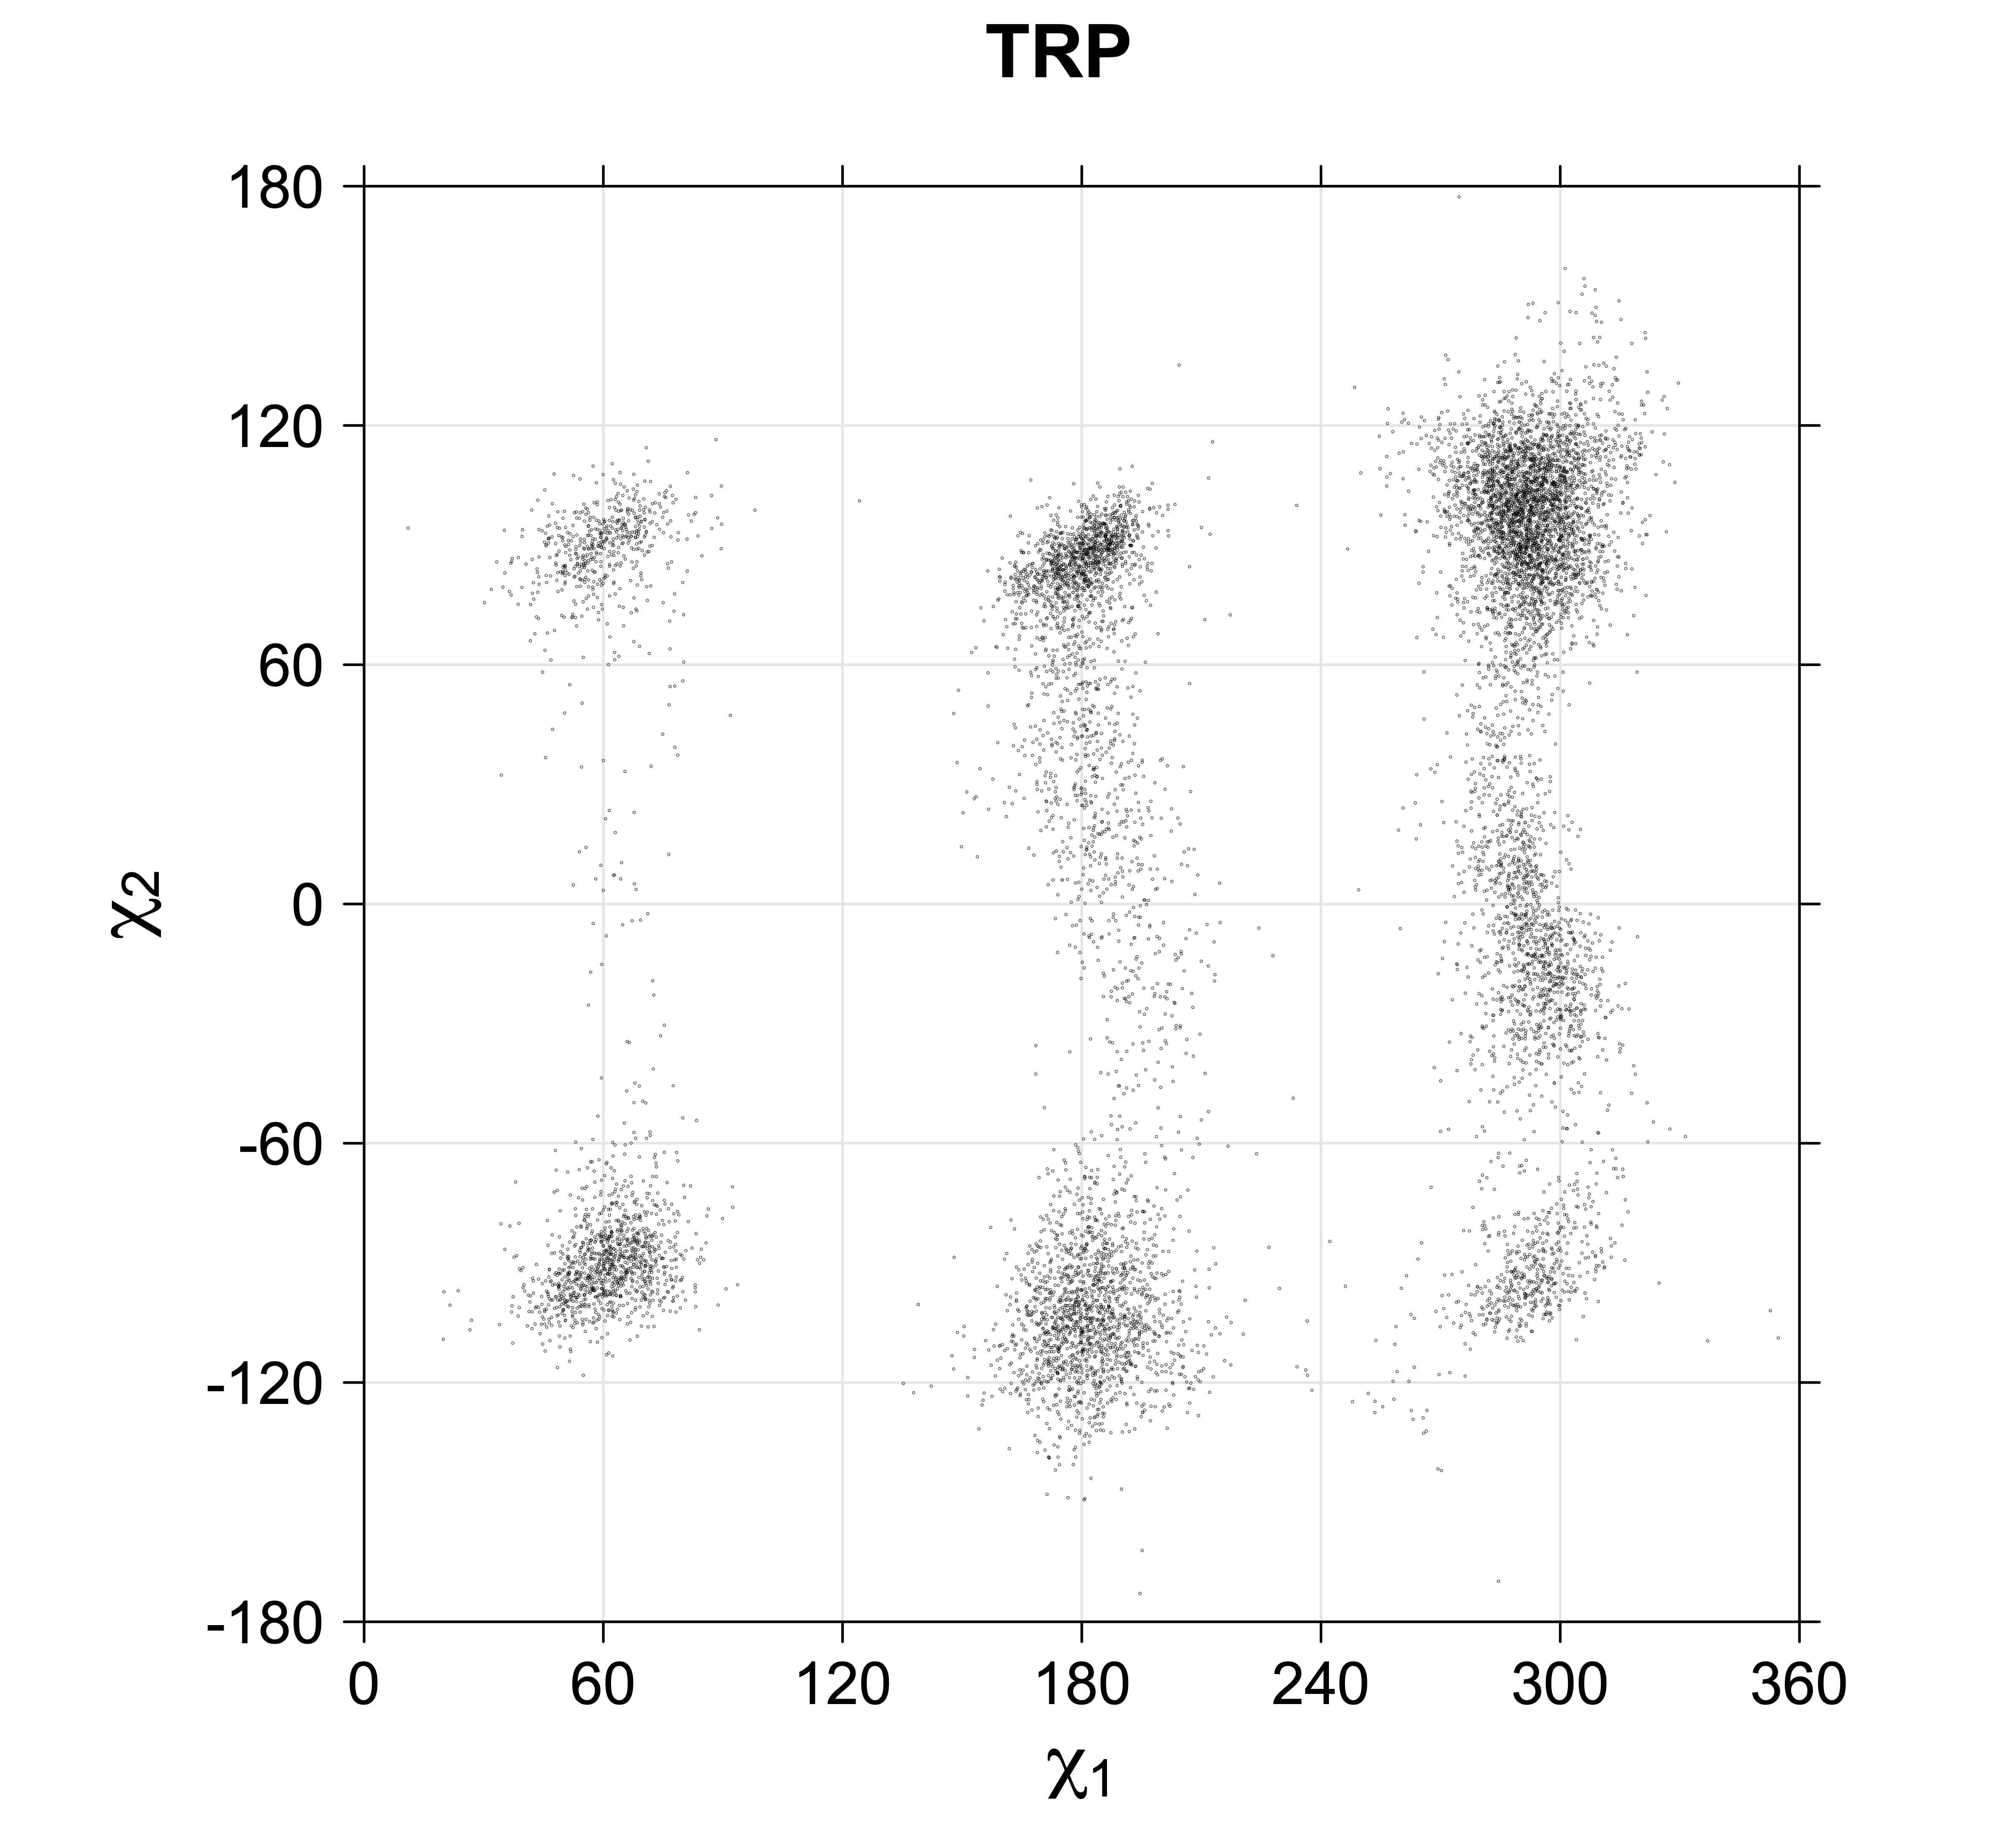
4. Scatterplots of χ angles for rotameric and non-rotameric degrees of freedom
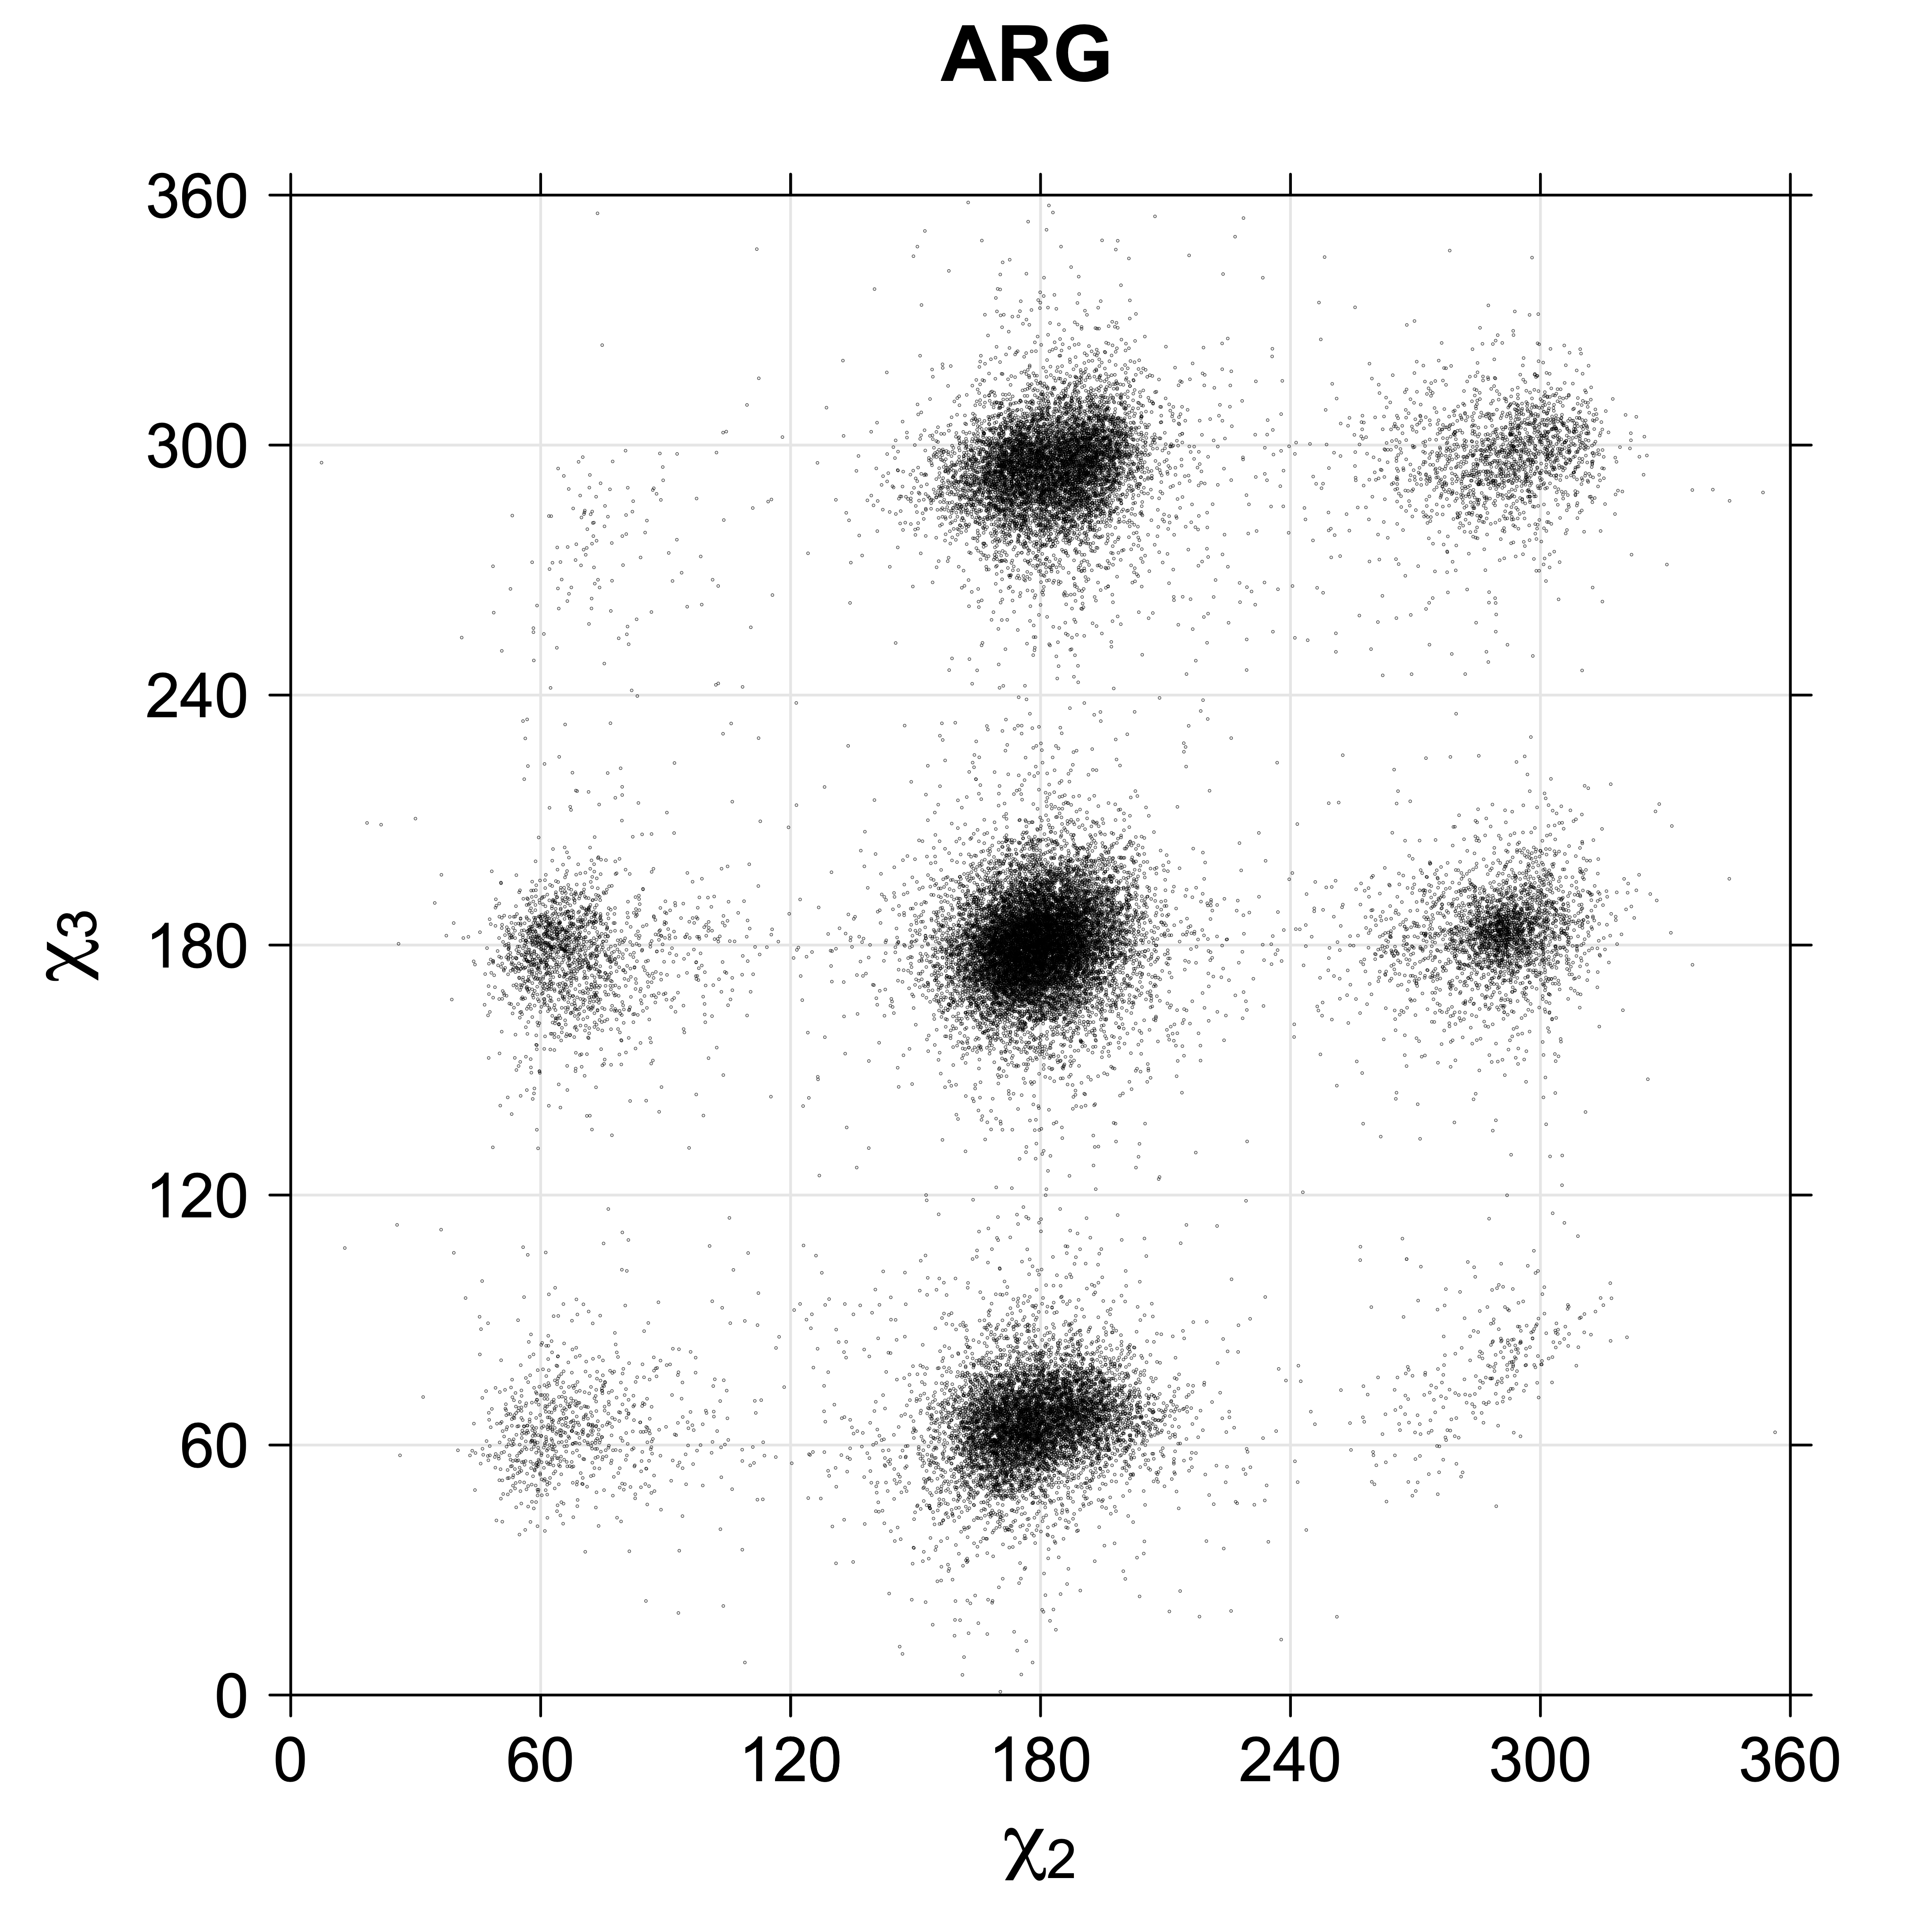
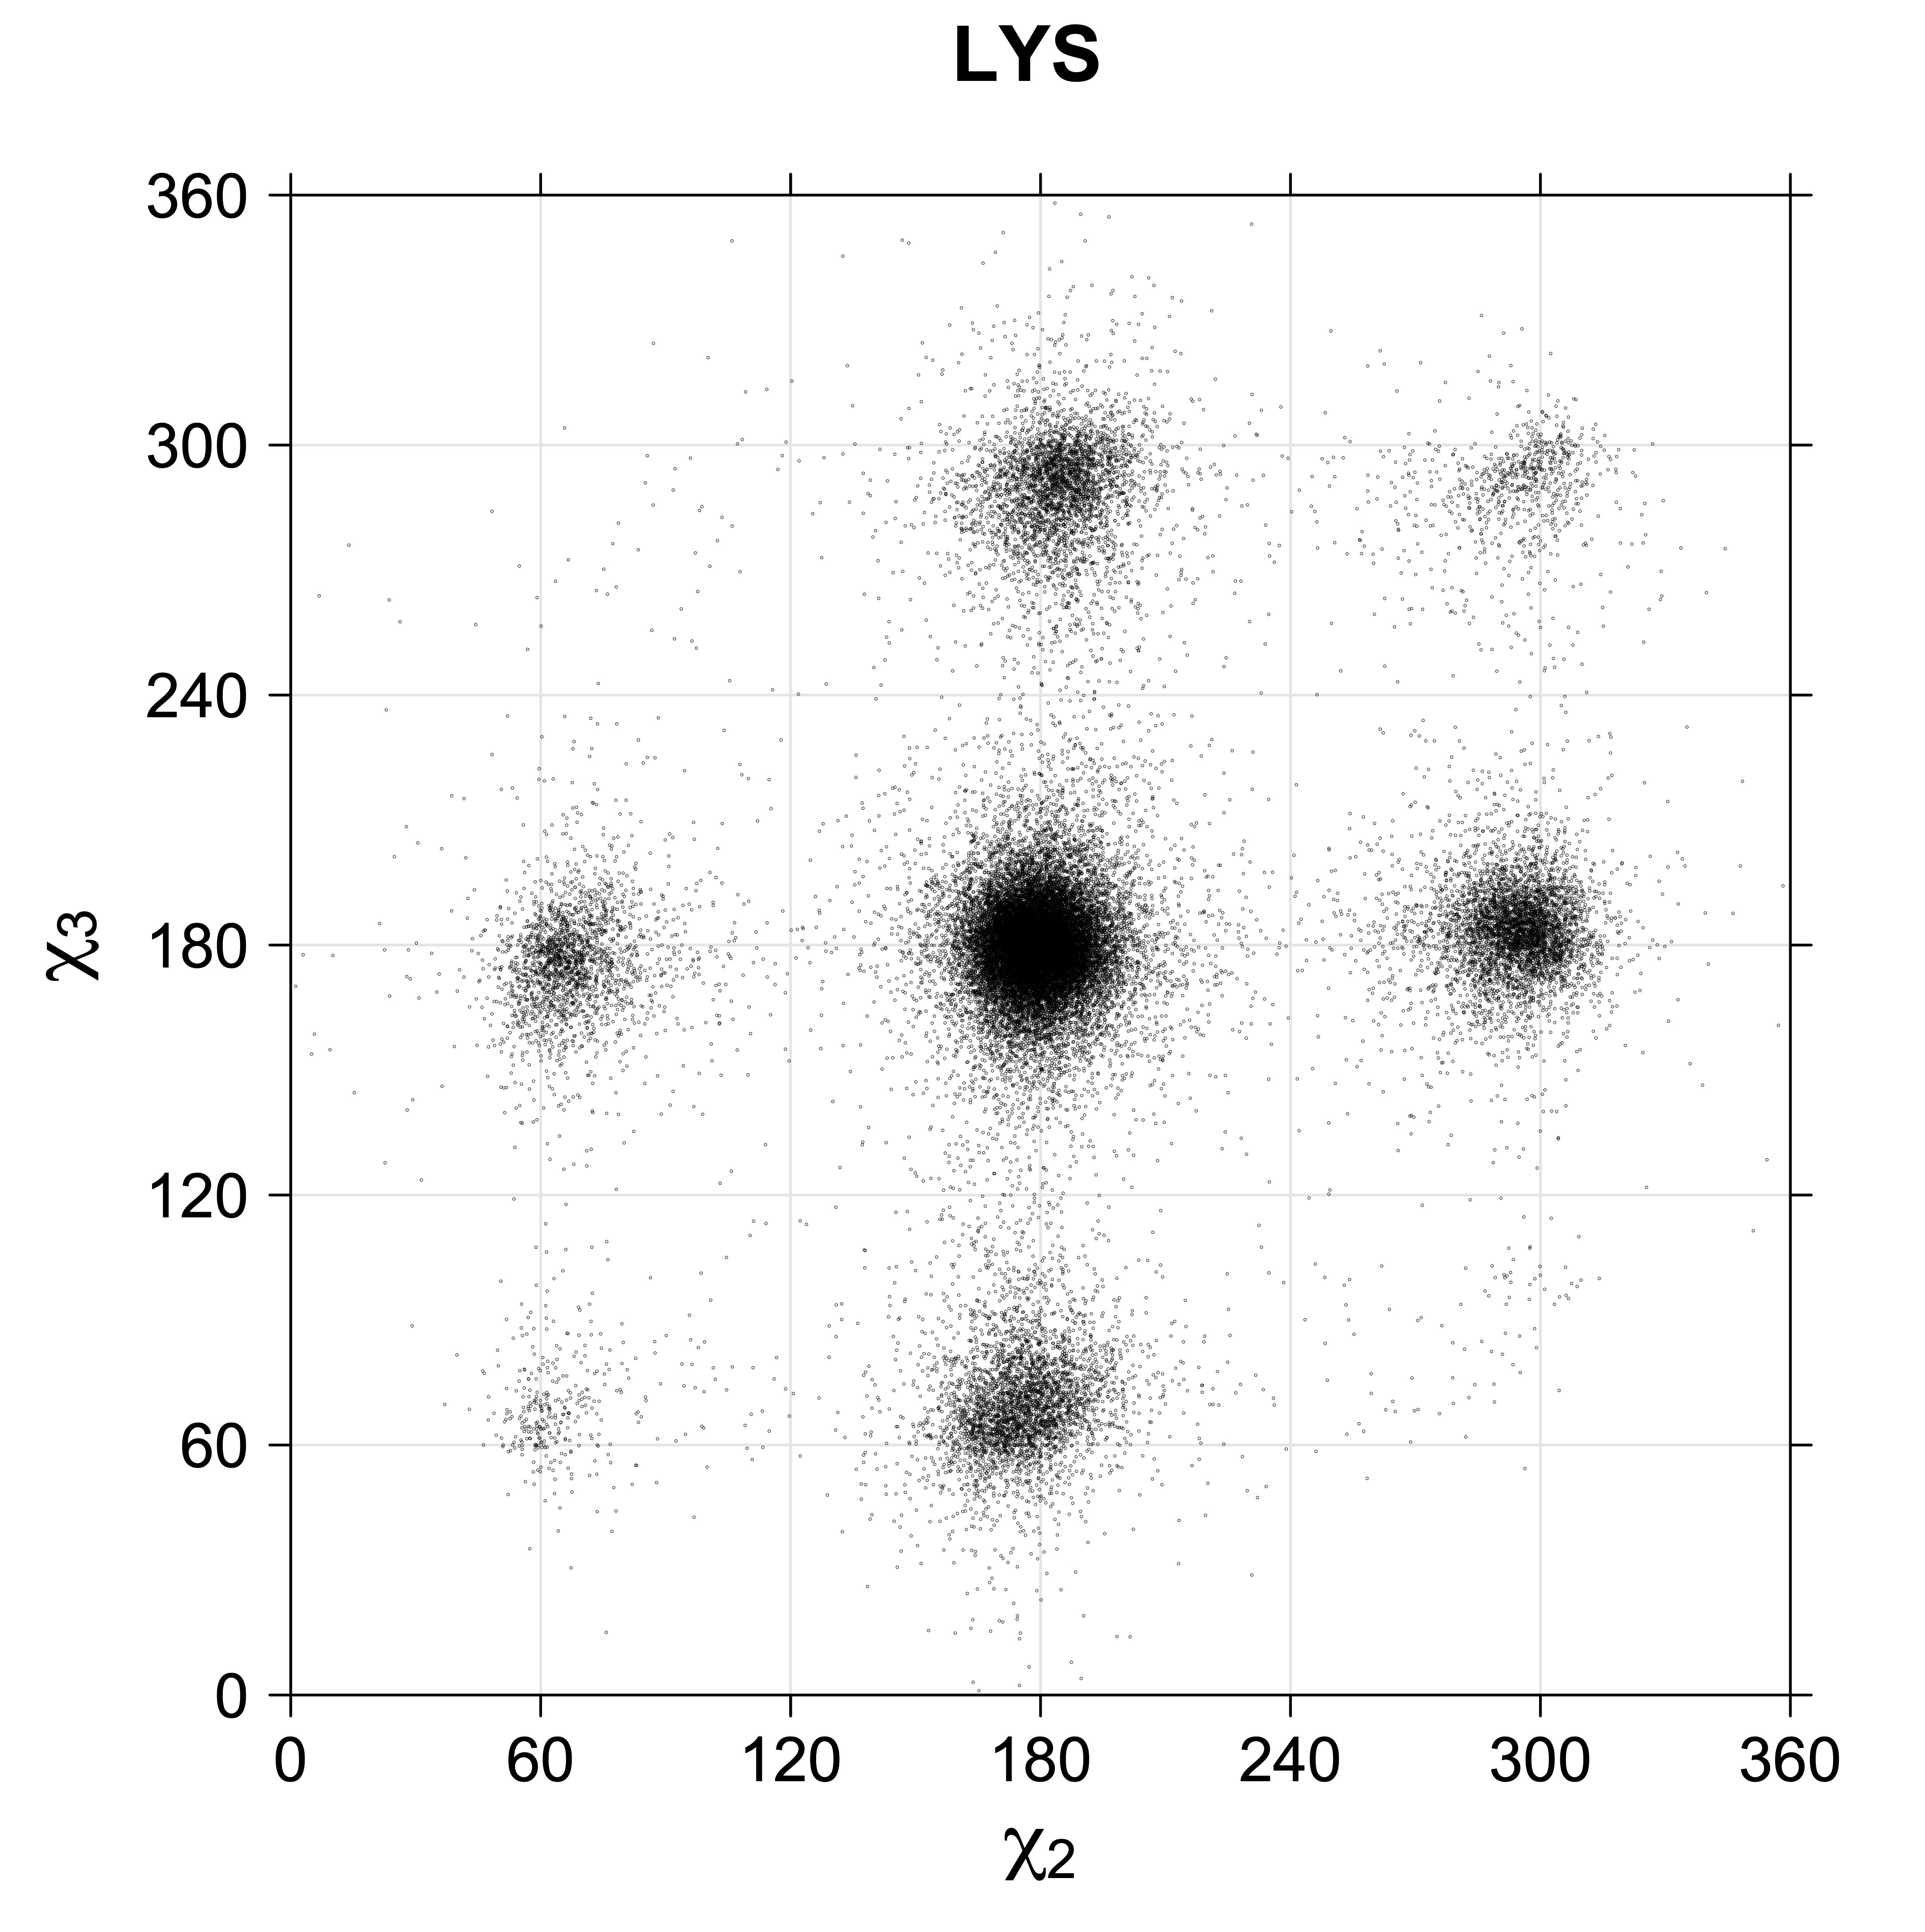
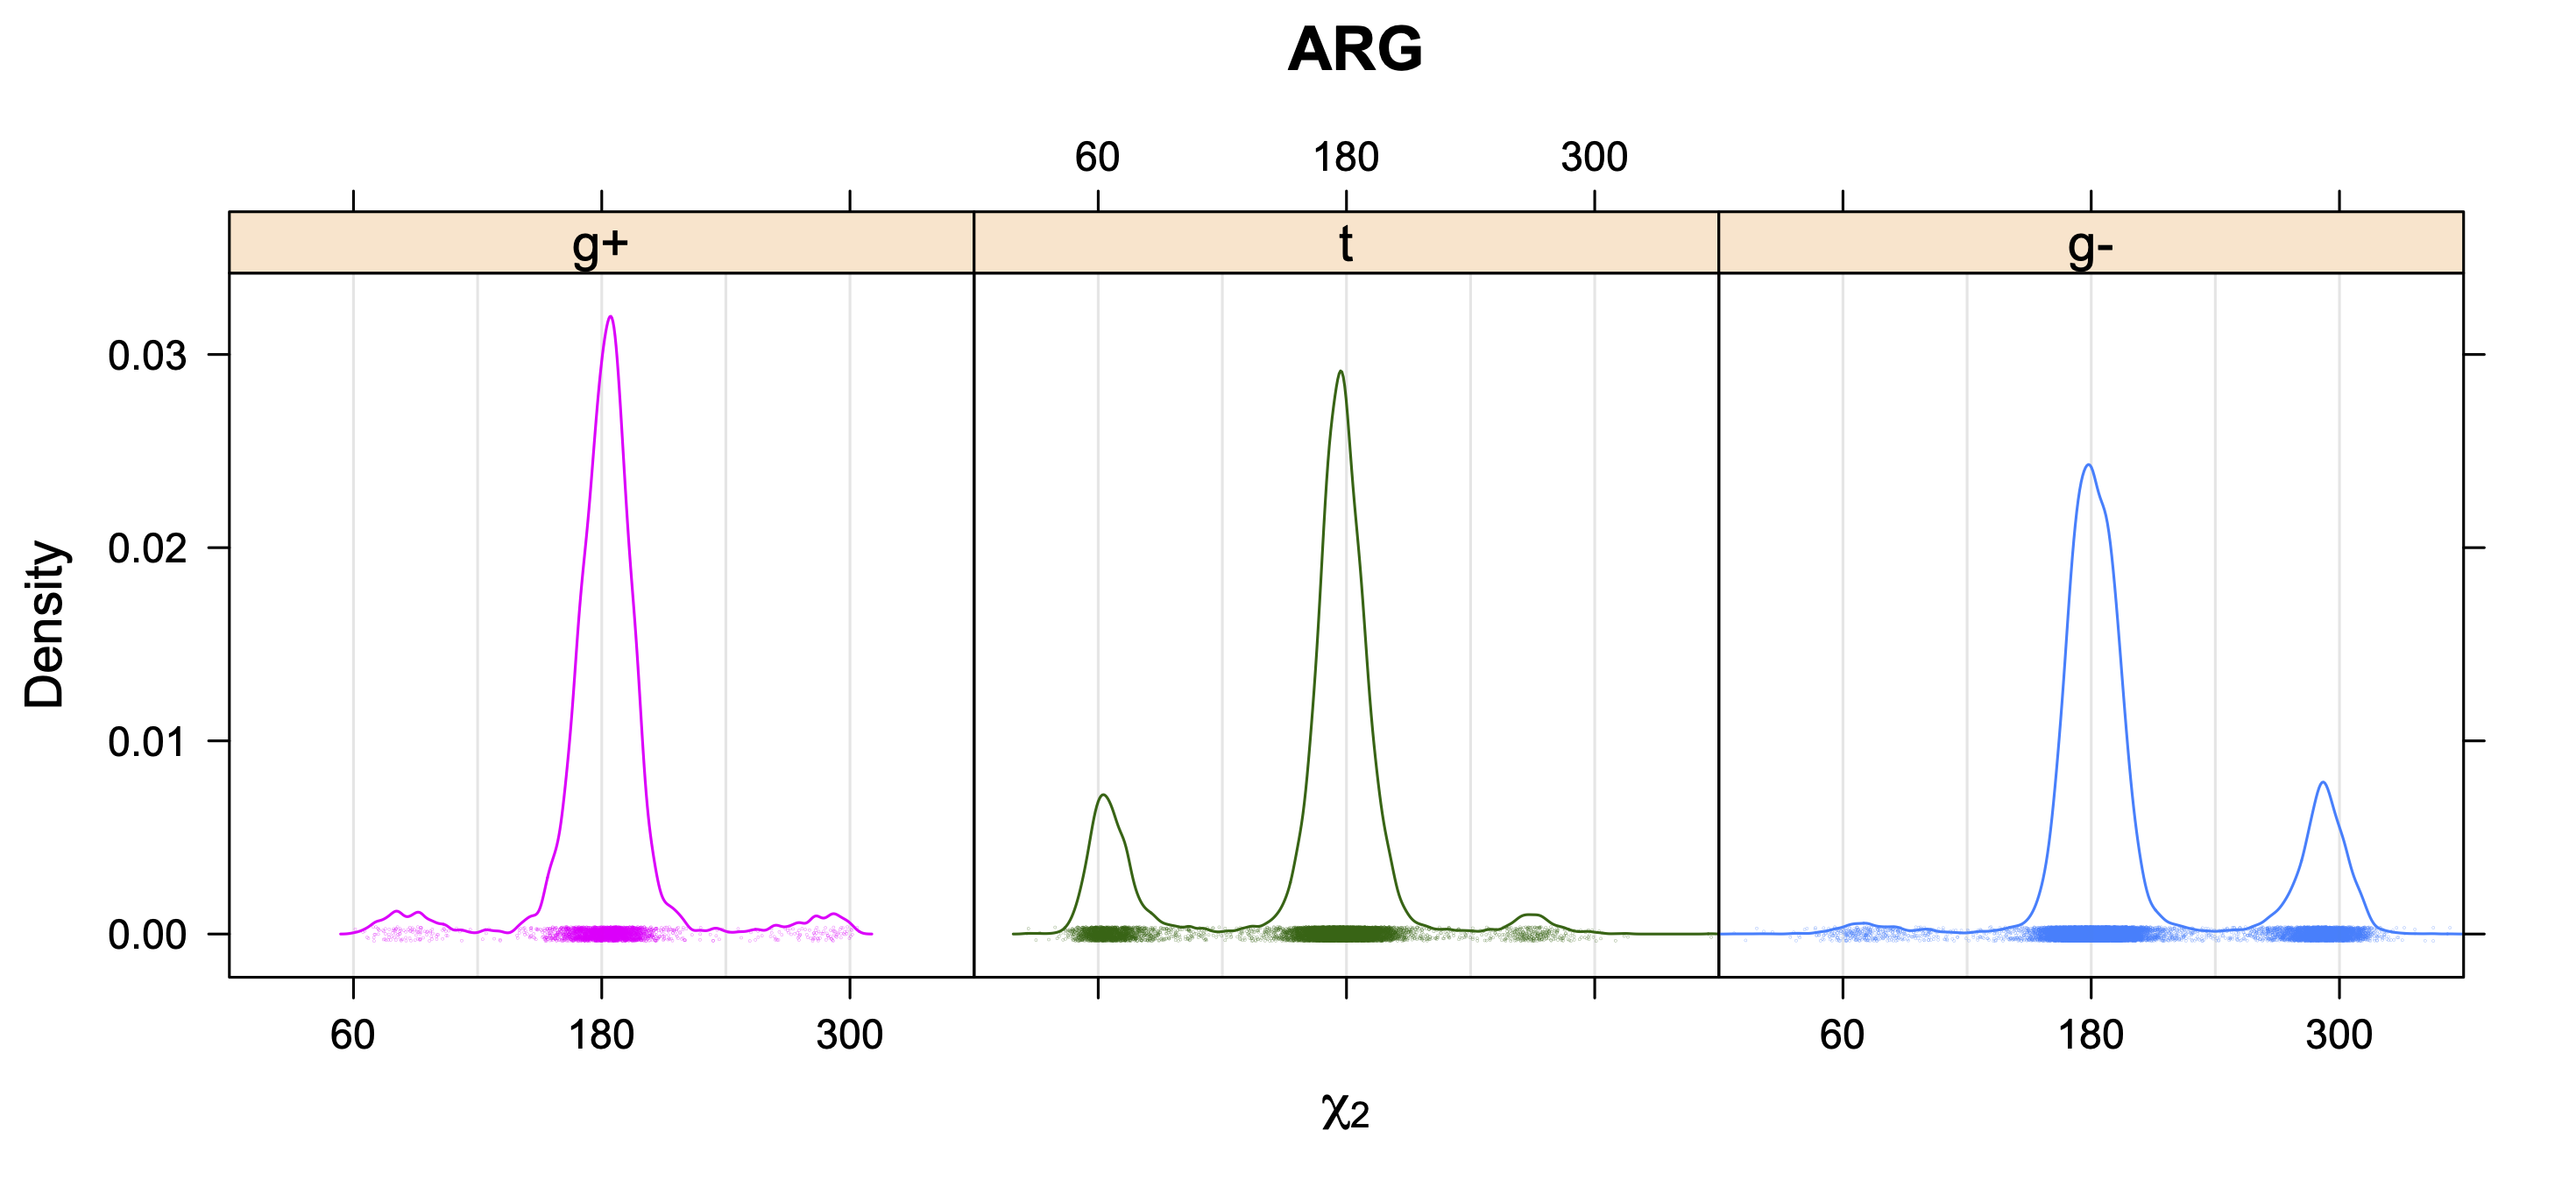
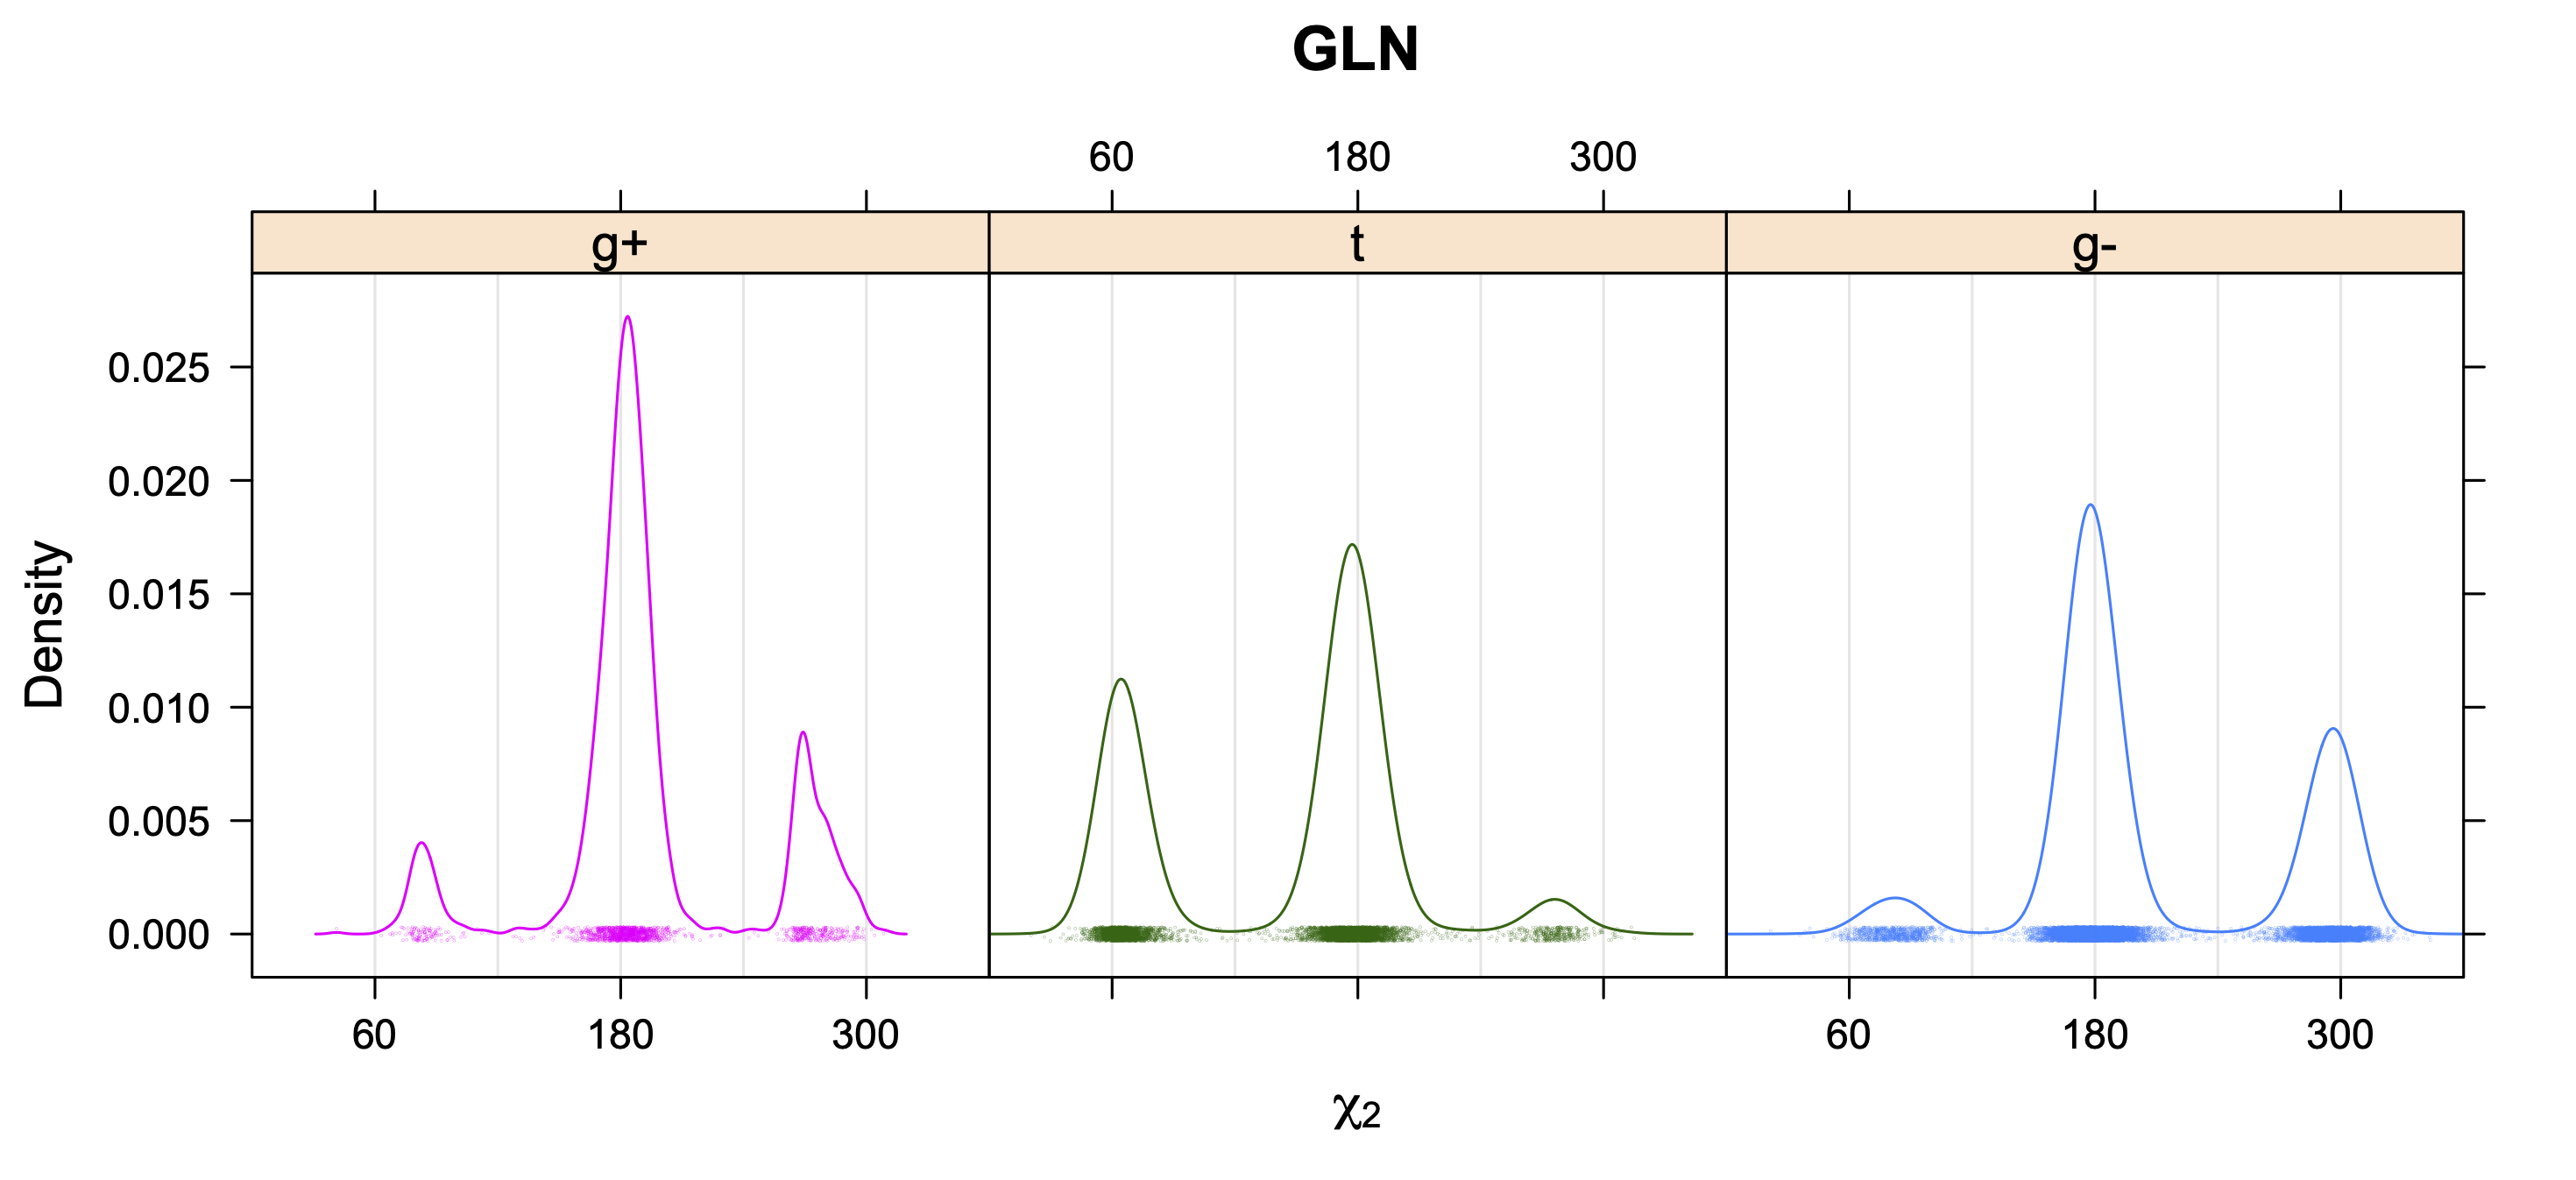
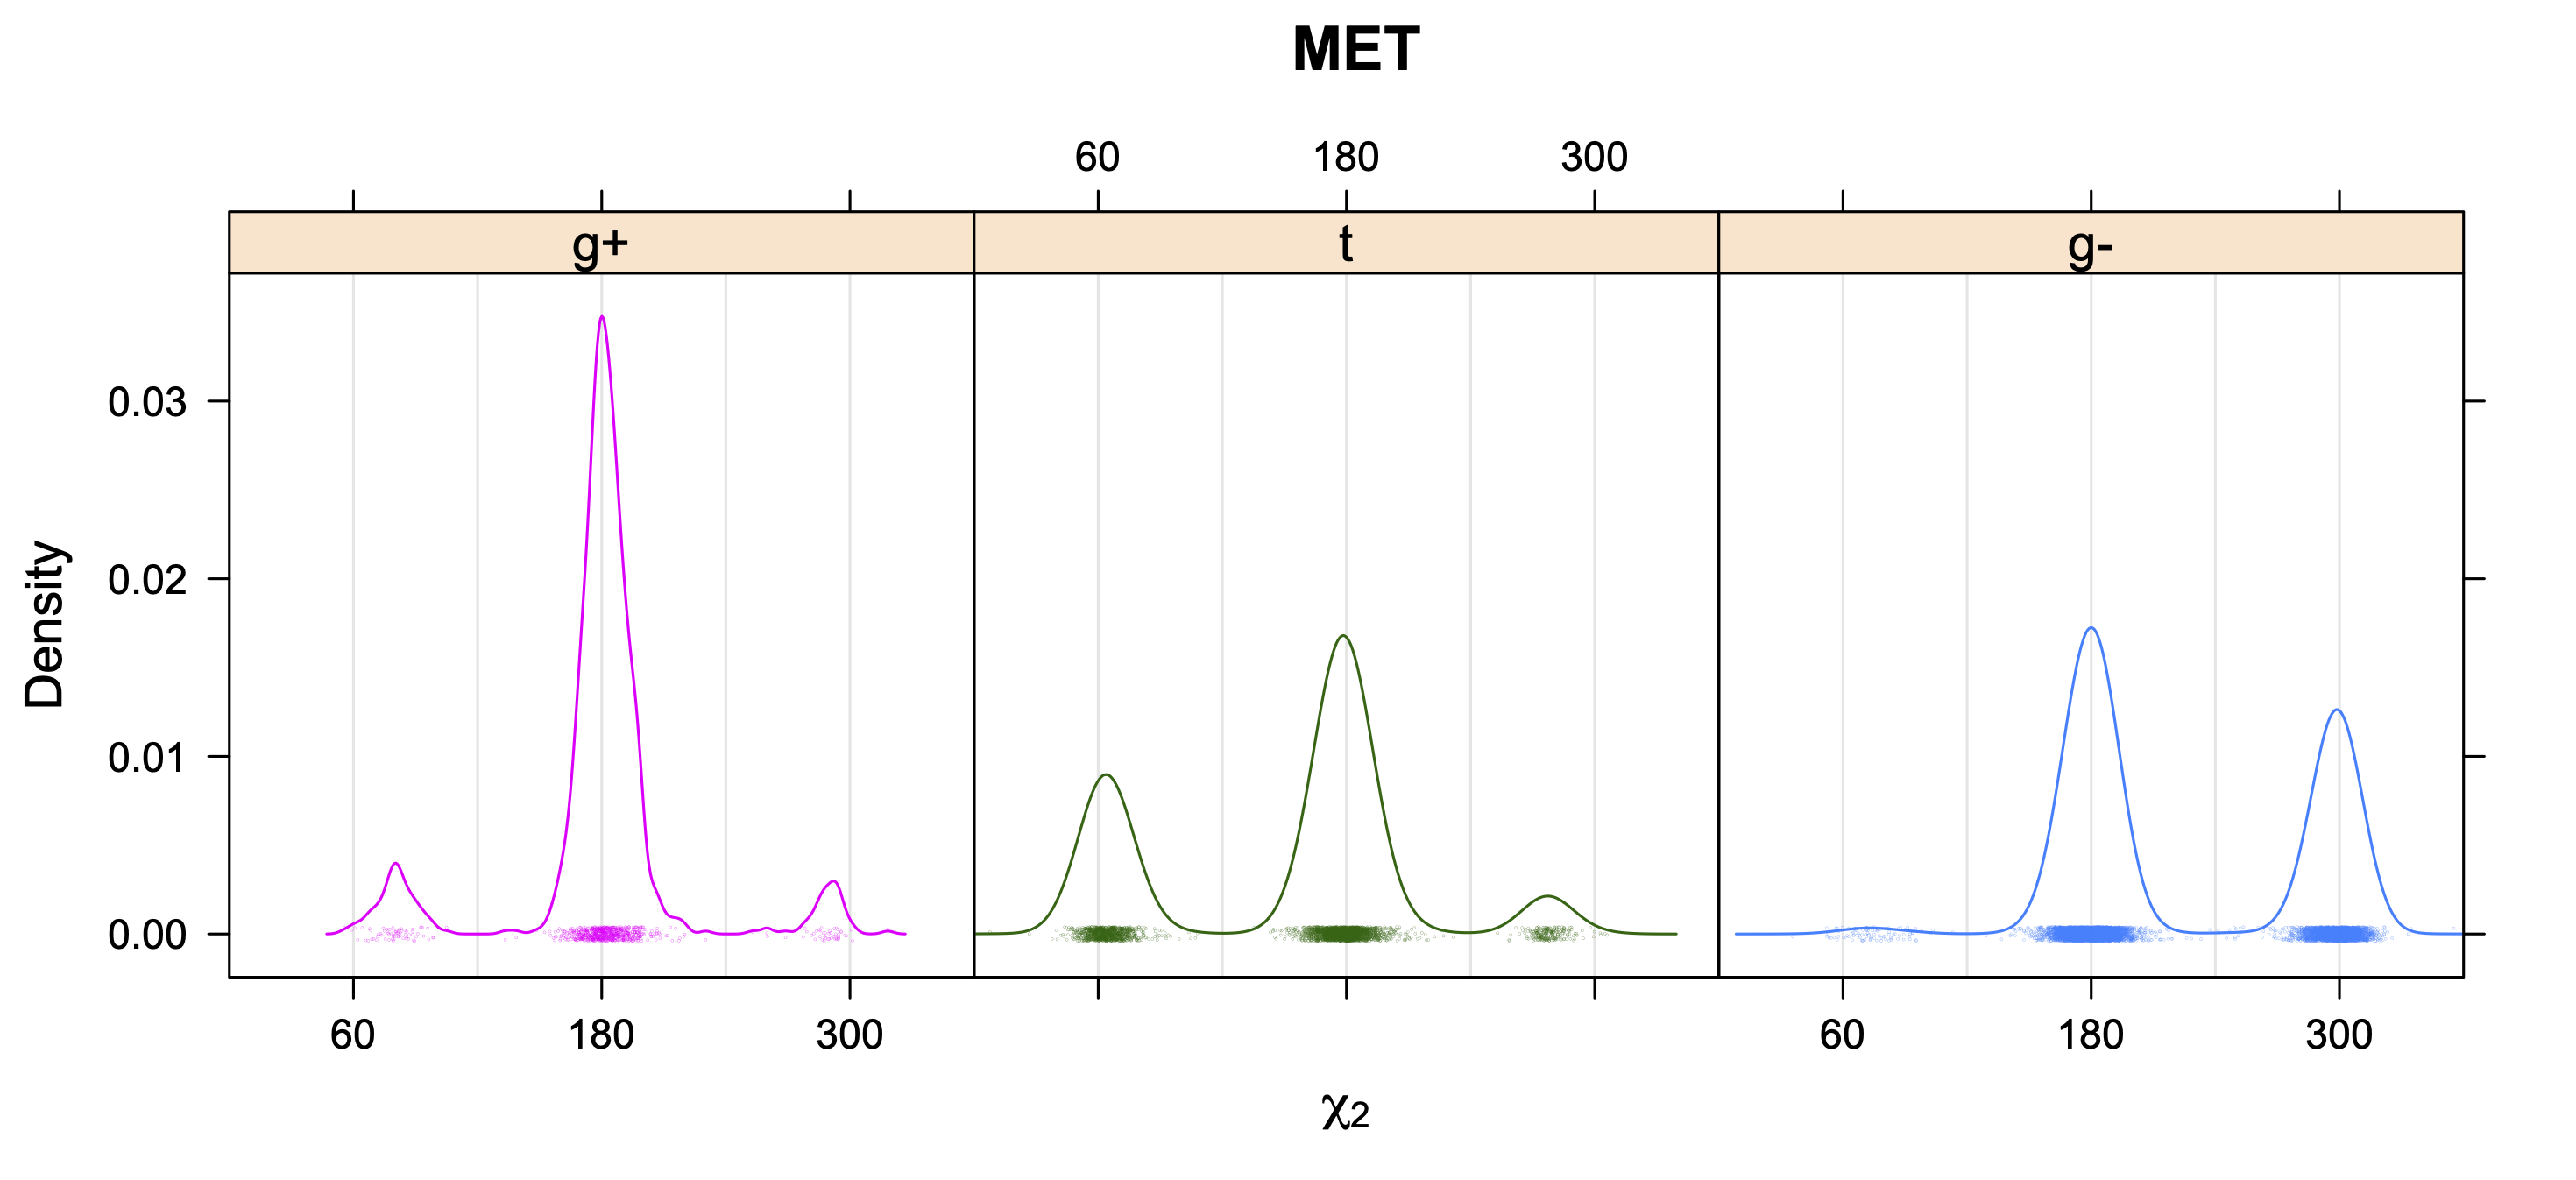
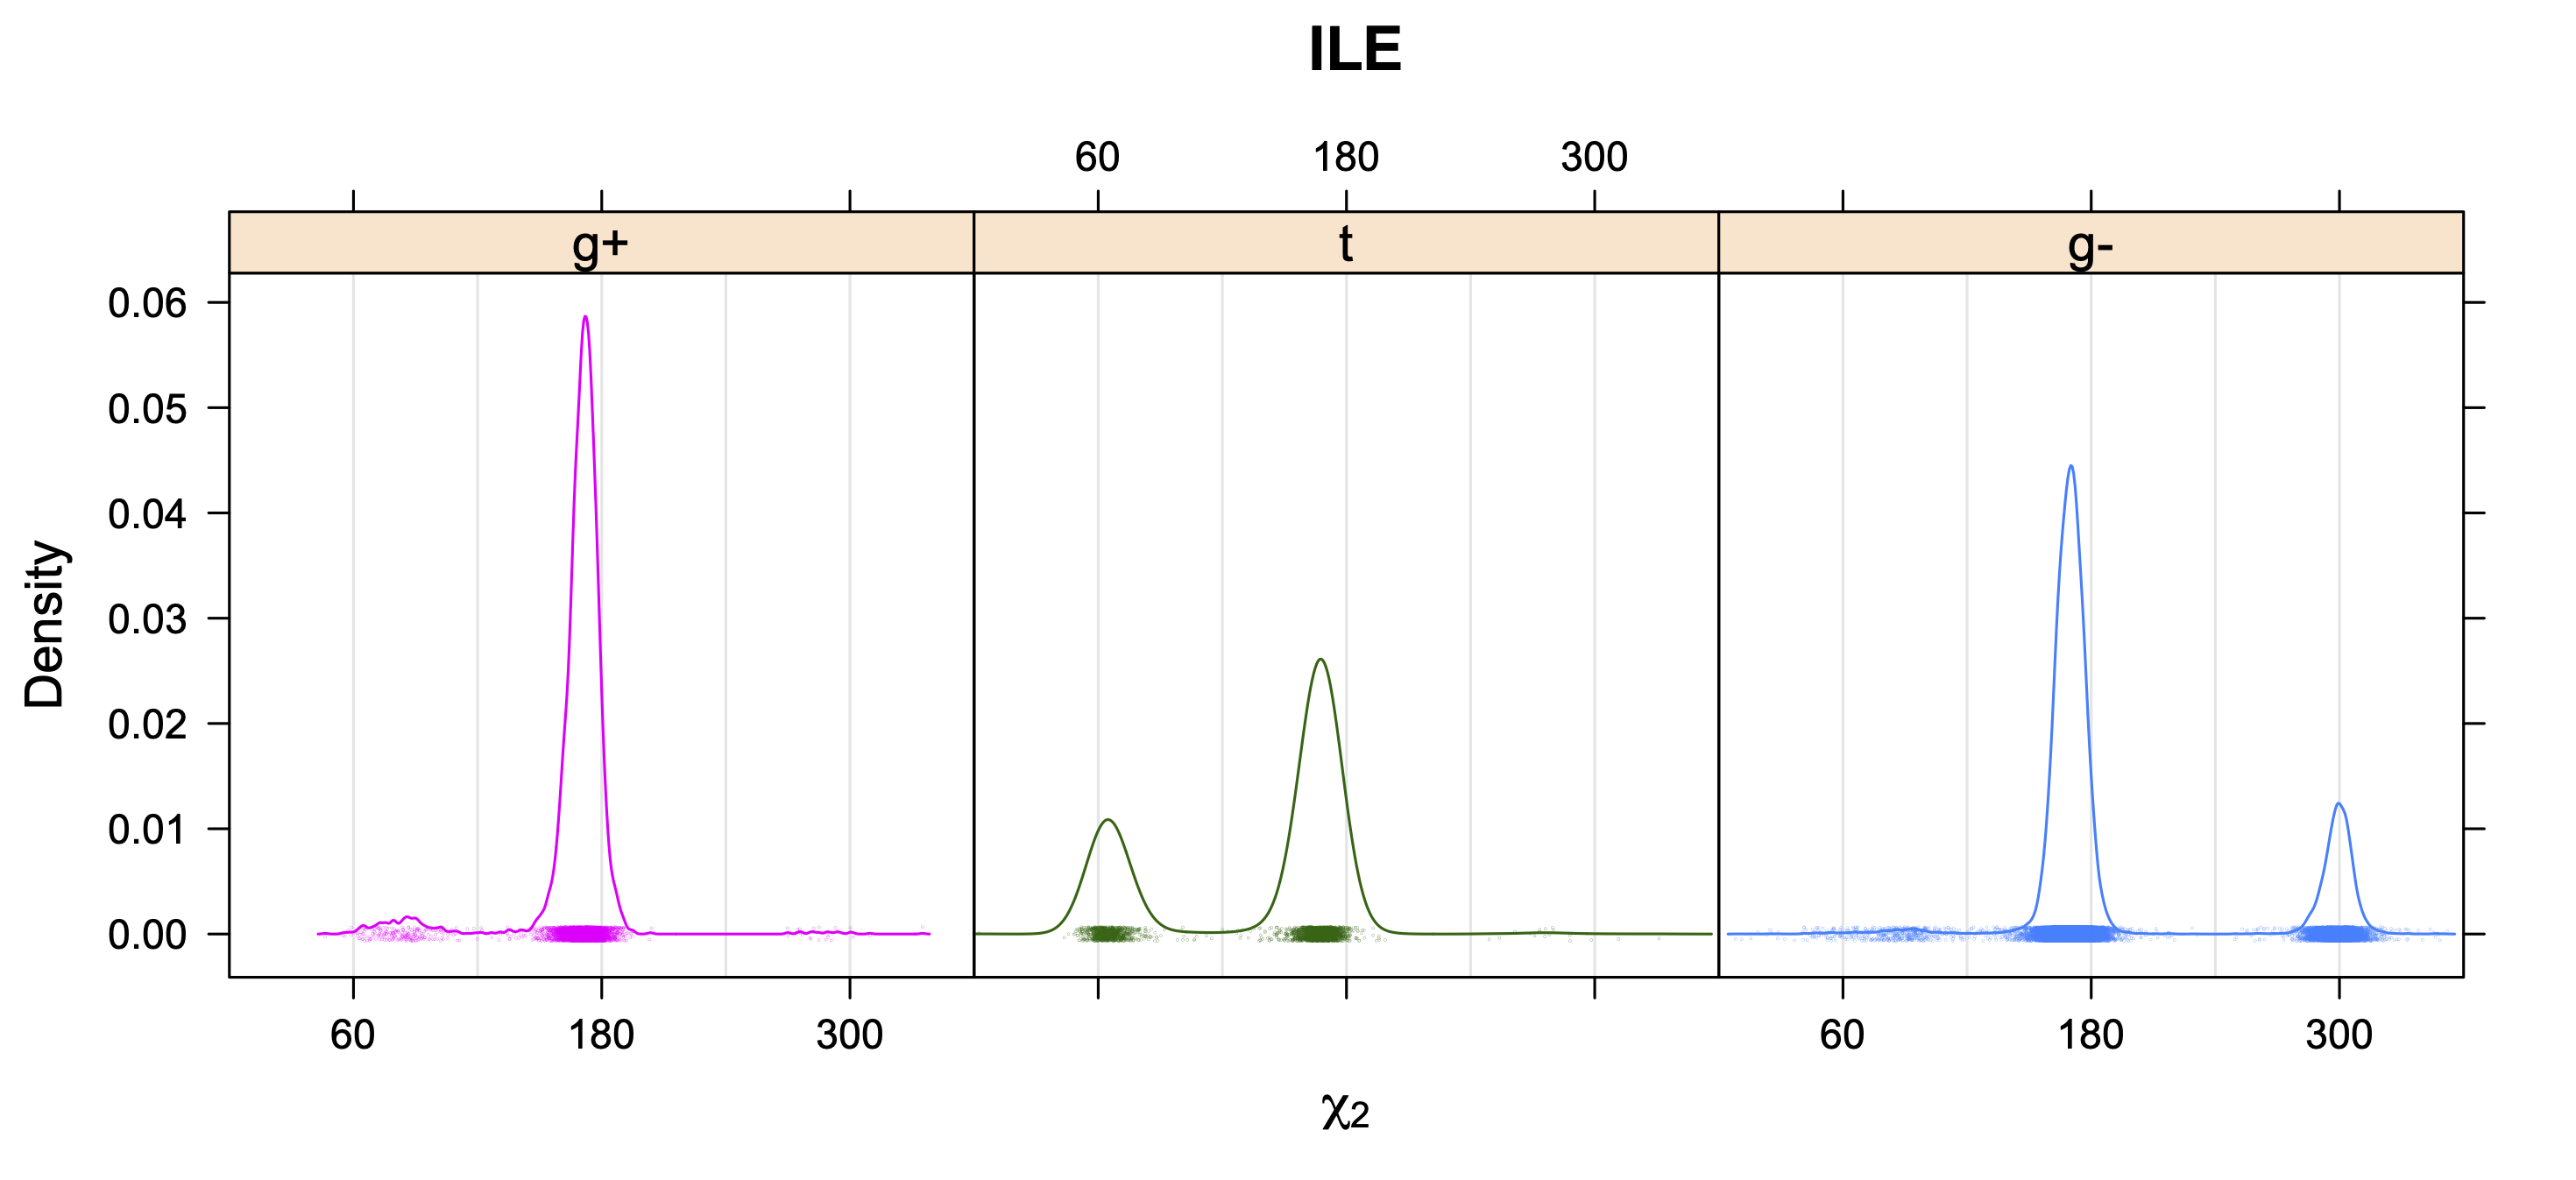
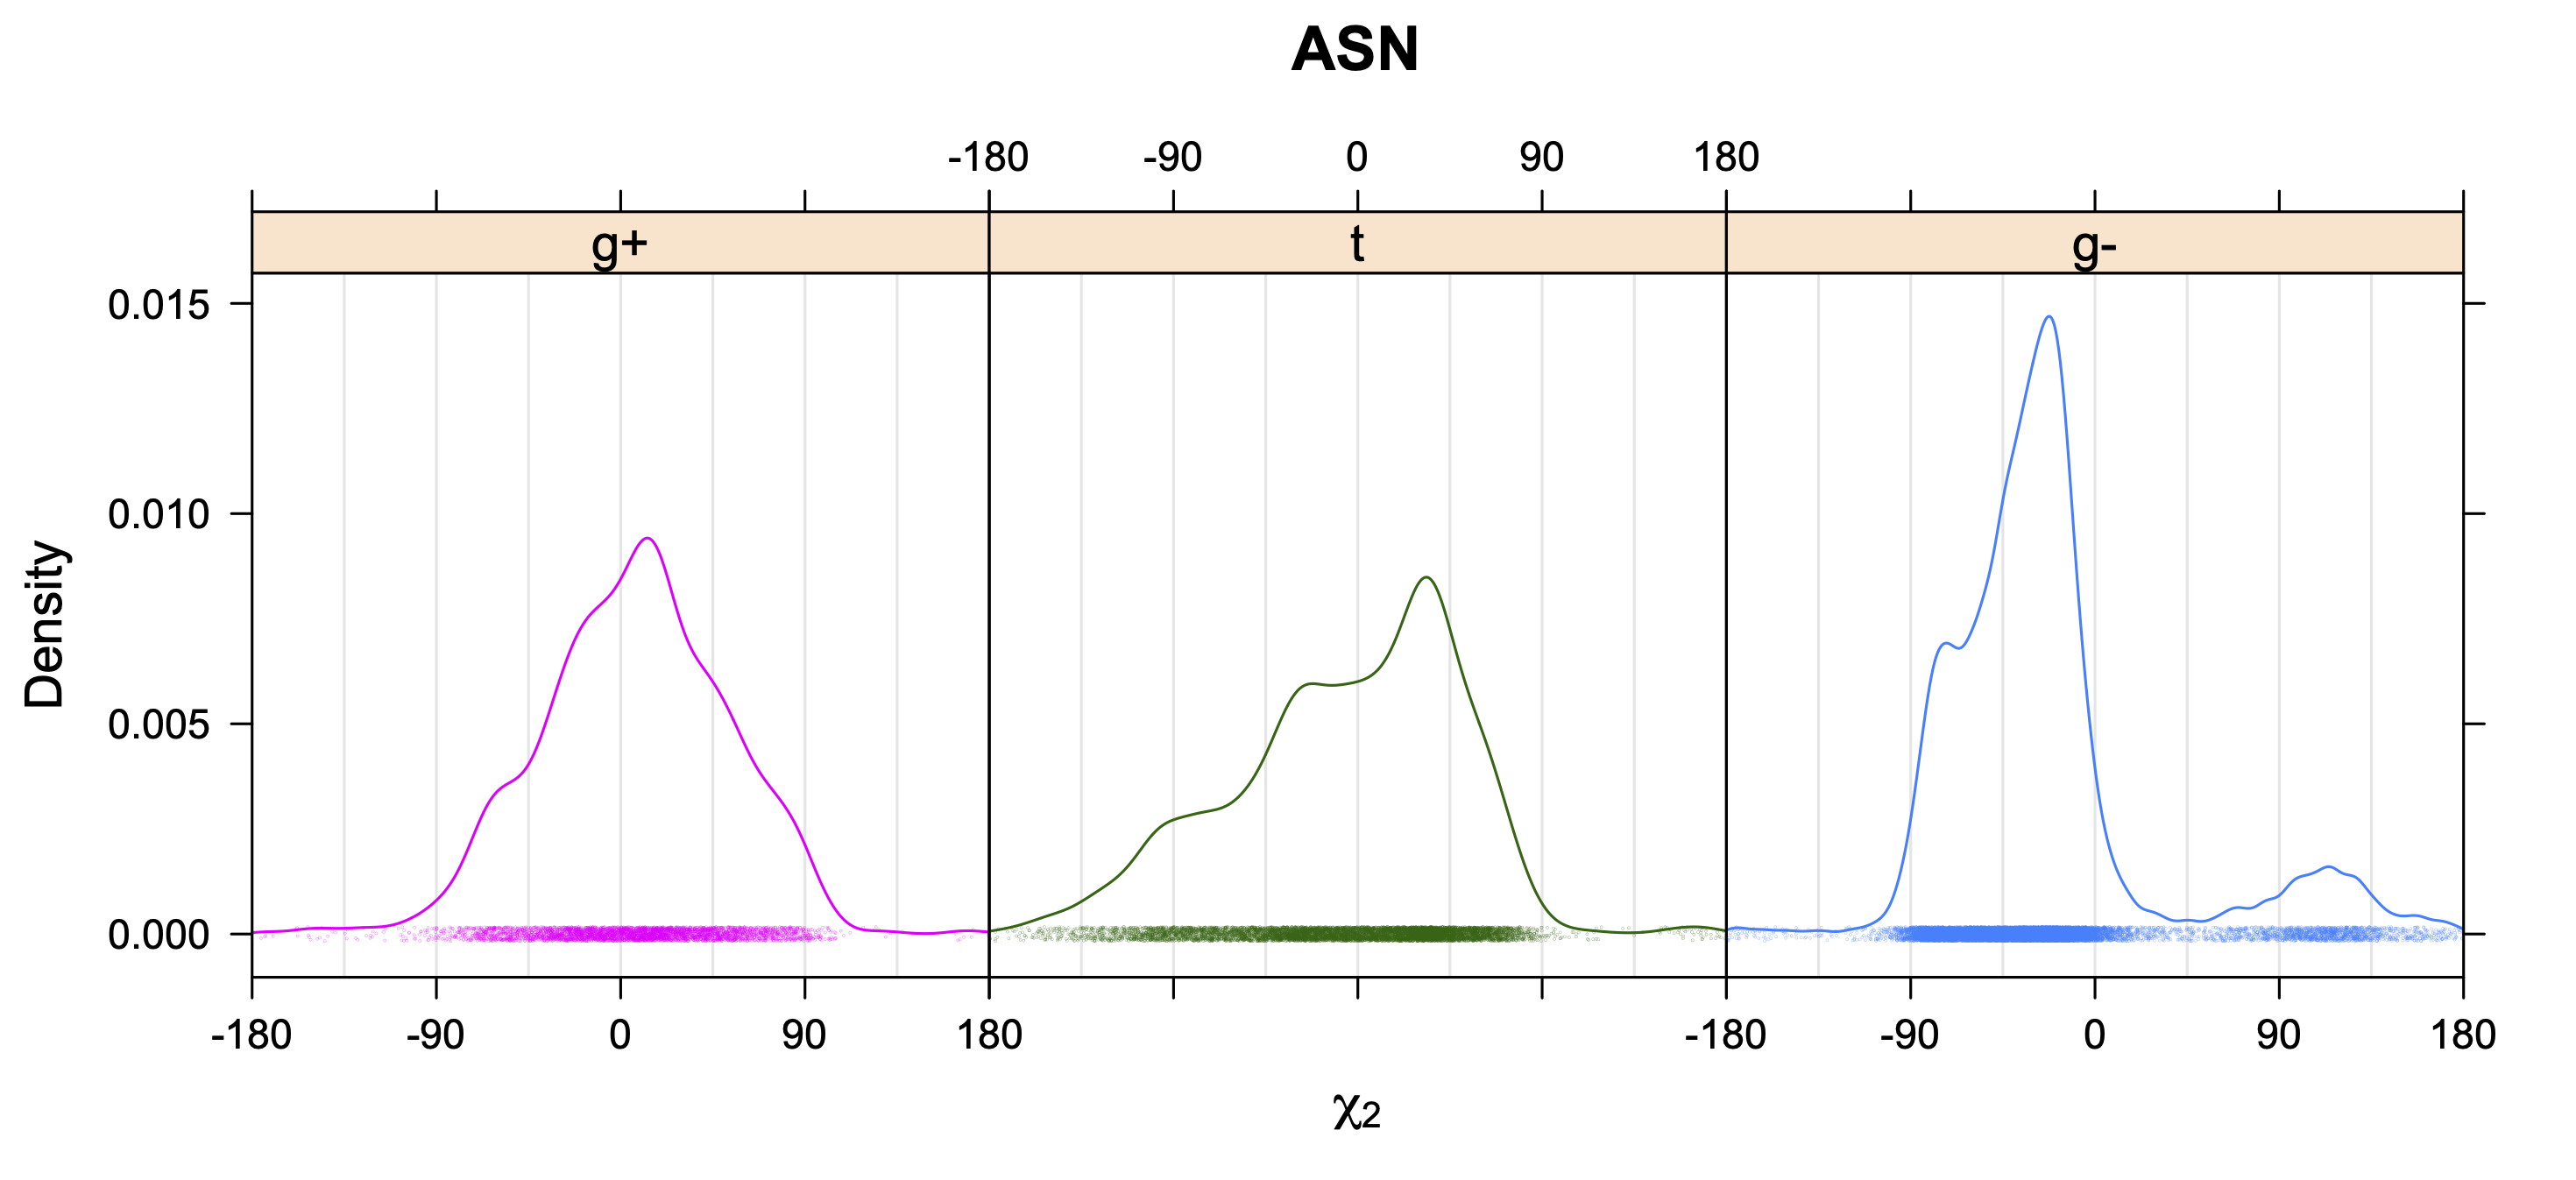
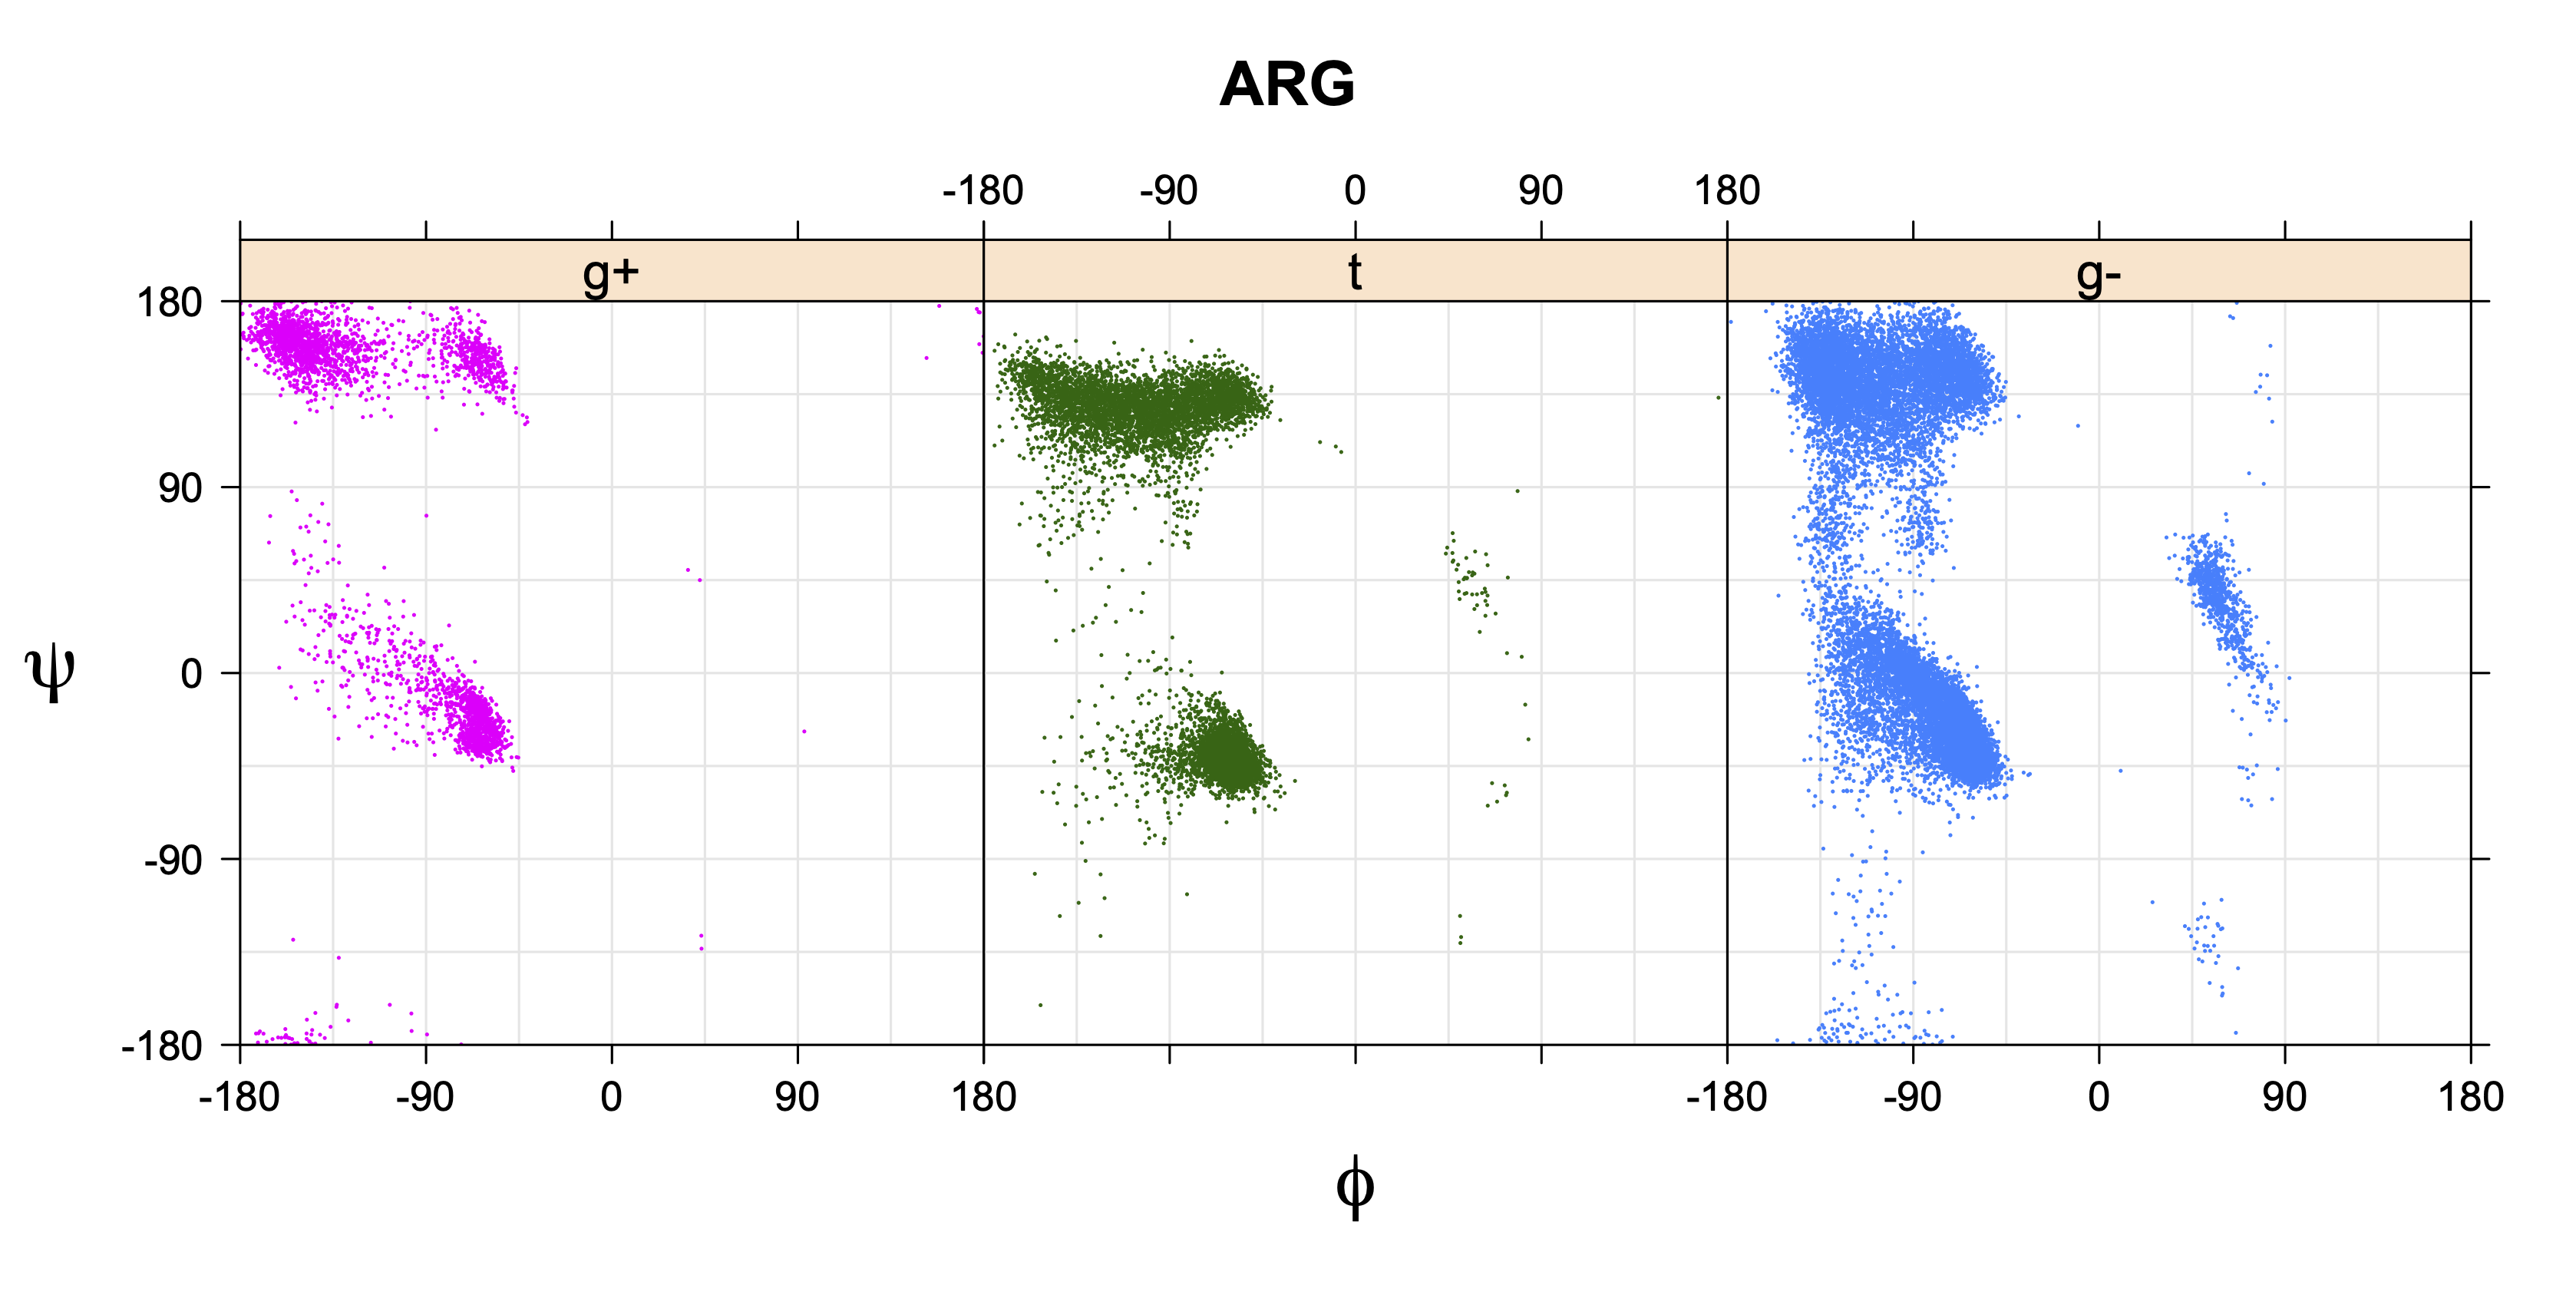
While χ1 is always rotameric, the χ2 distributions of Asn, Asp, Phe, Tyr, His, and Trp and the χ3 distributions of Glu and Gln are non-rotameric. The difference can be observed in the χ1,χ2 scatterplots of Arg and Asn. The χ1,χ2 values for Arg occur in nine bins corresponding to the g+,t,g- rotamers of χ1 and χ2 of Arg. The distributions of χ2 for each χ1 rotamer of Asn vary from one another, but all three are broadly distributed (right panel). The plots that follow are the χ2 kernel density estimate for each residue type. For the rotameric χ2, you can see the deviation of χ2 from the common rotameric value (-60°, 180°, 300°) when there are syn-pentane interactions (e.g., for {g+,g+}, {g+,g-}, {t,g-}, {g-,g+} conformations). For example, for Arg, in the left panel, the first peak for {g+,g+} is at χ2 of around 90°.
Scatterplots of χ1,χ2 angle pairs for rotameric degrees of freedom
For χ1,χ2 rotamers, we expect the {g+,g+}, {g+,g-}, {t,g-}, and {g-,g+} rotamers to be low in population.
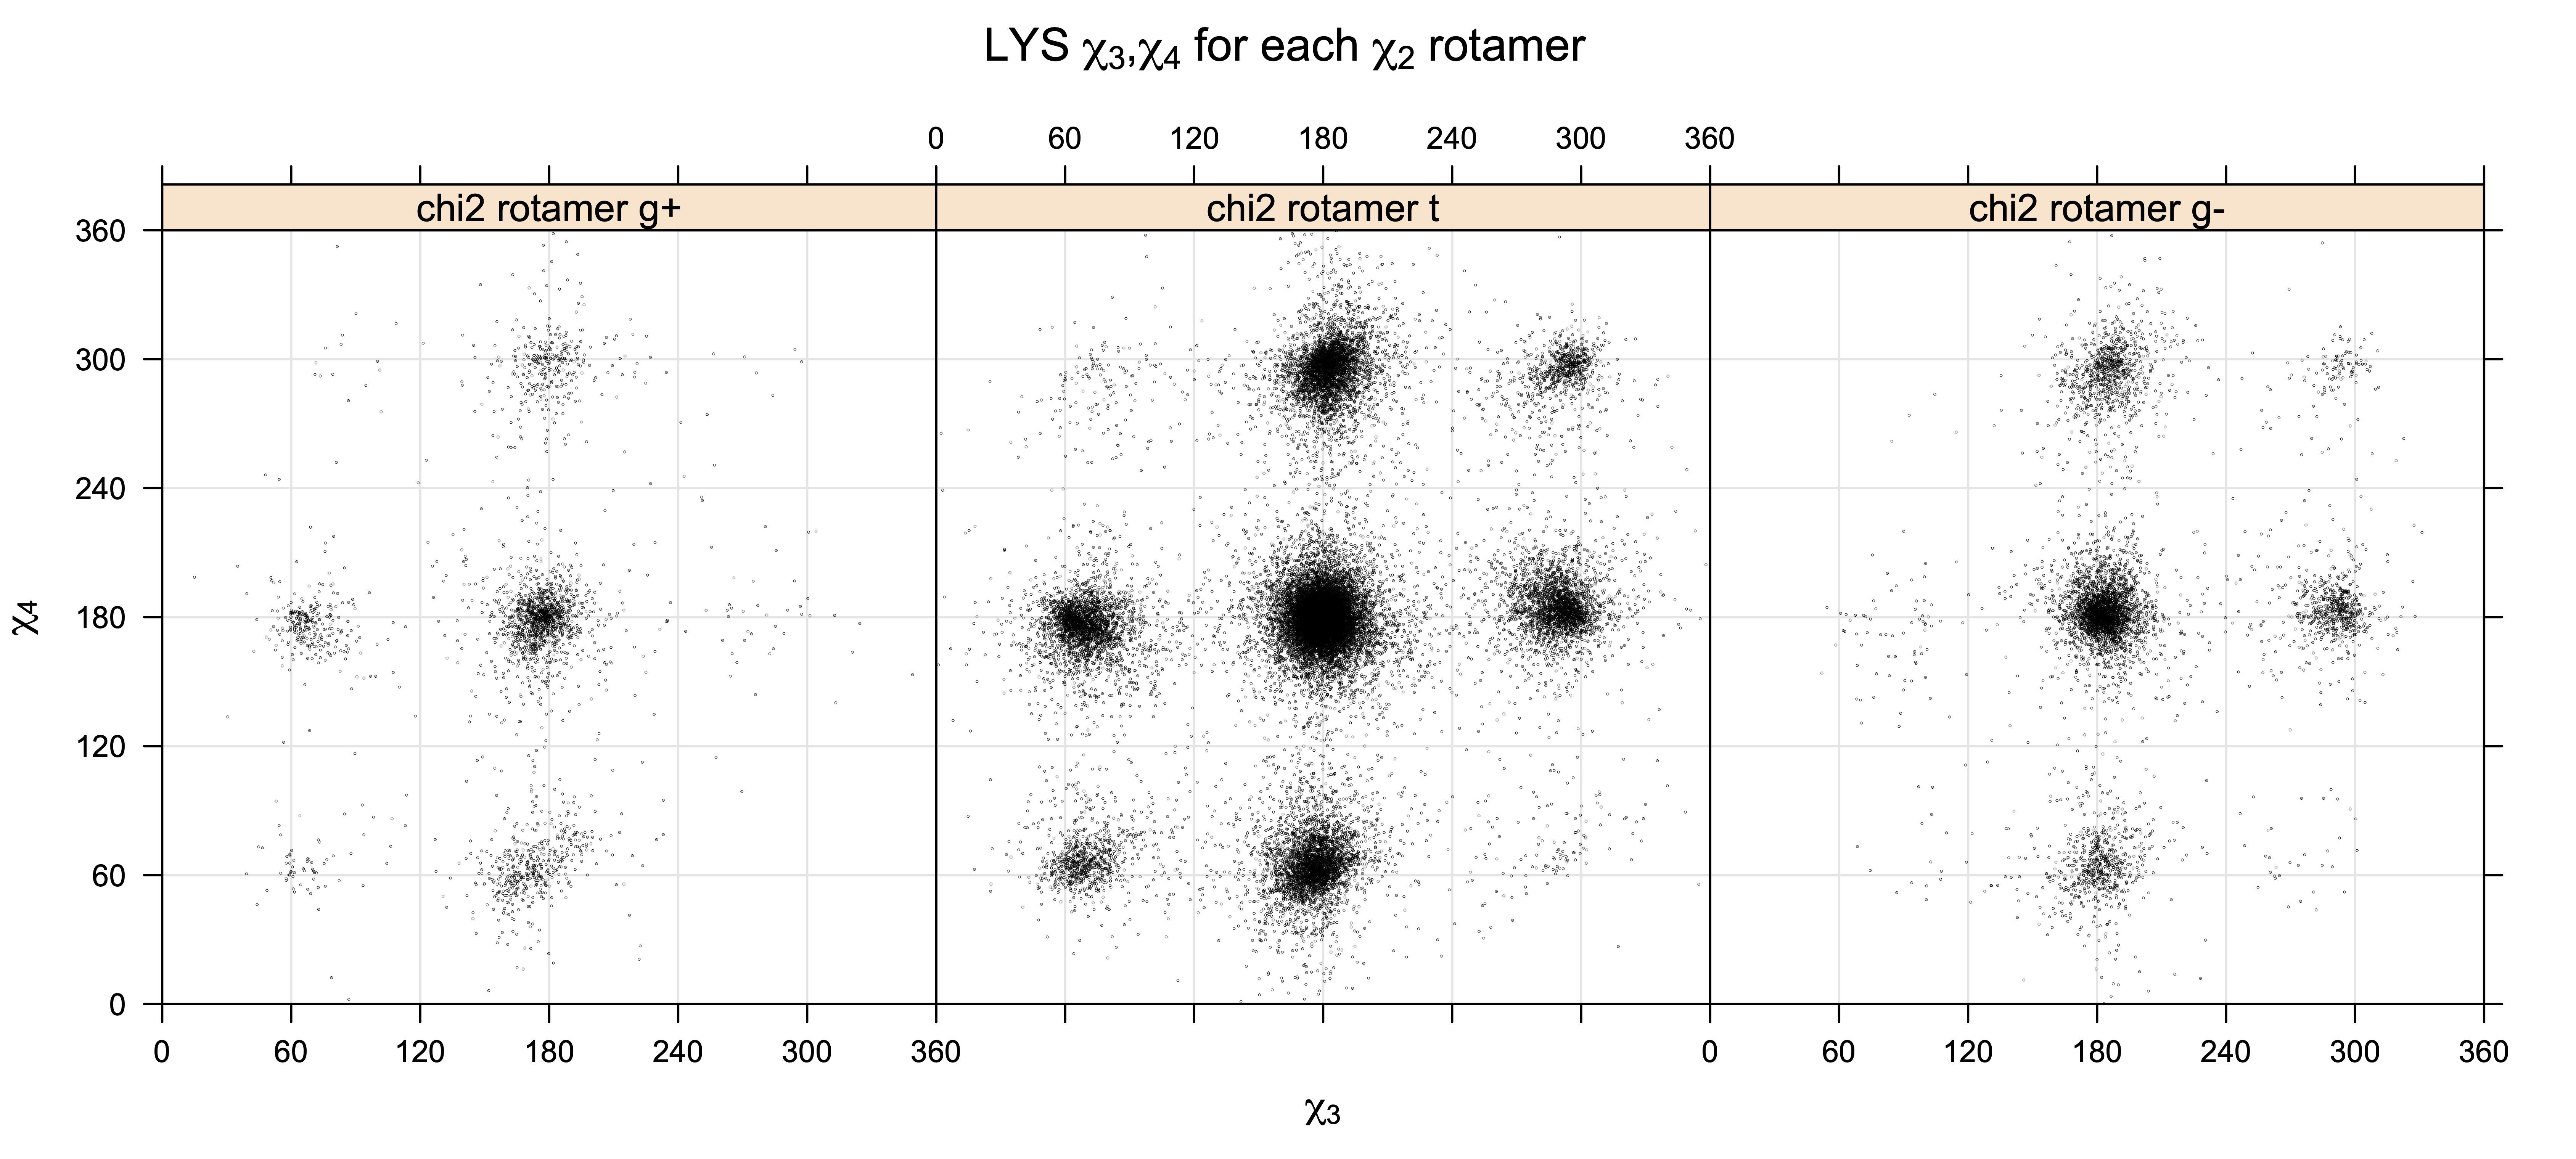
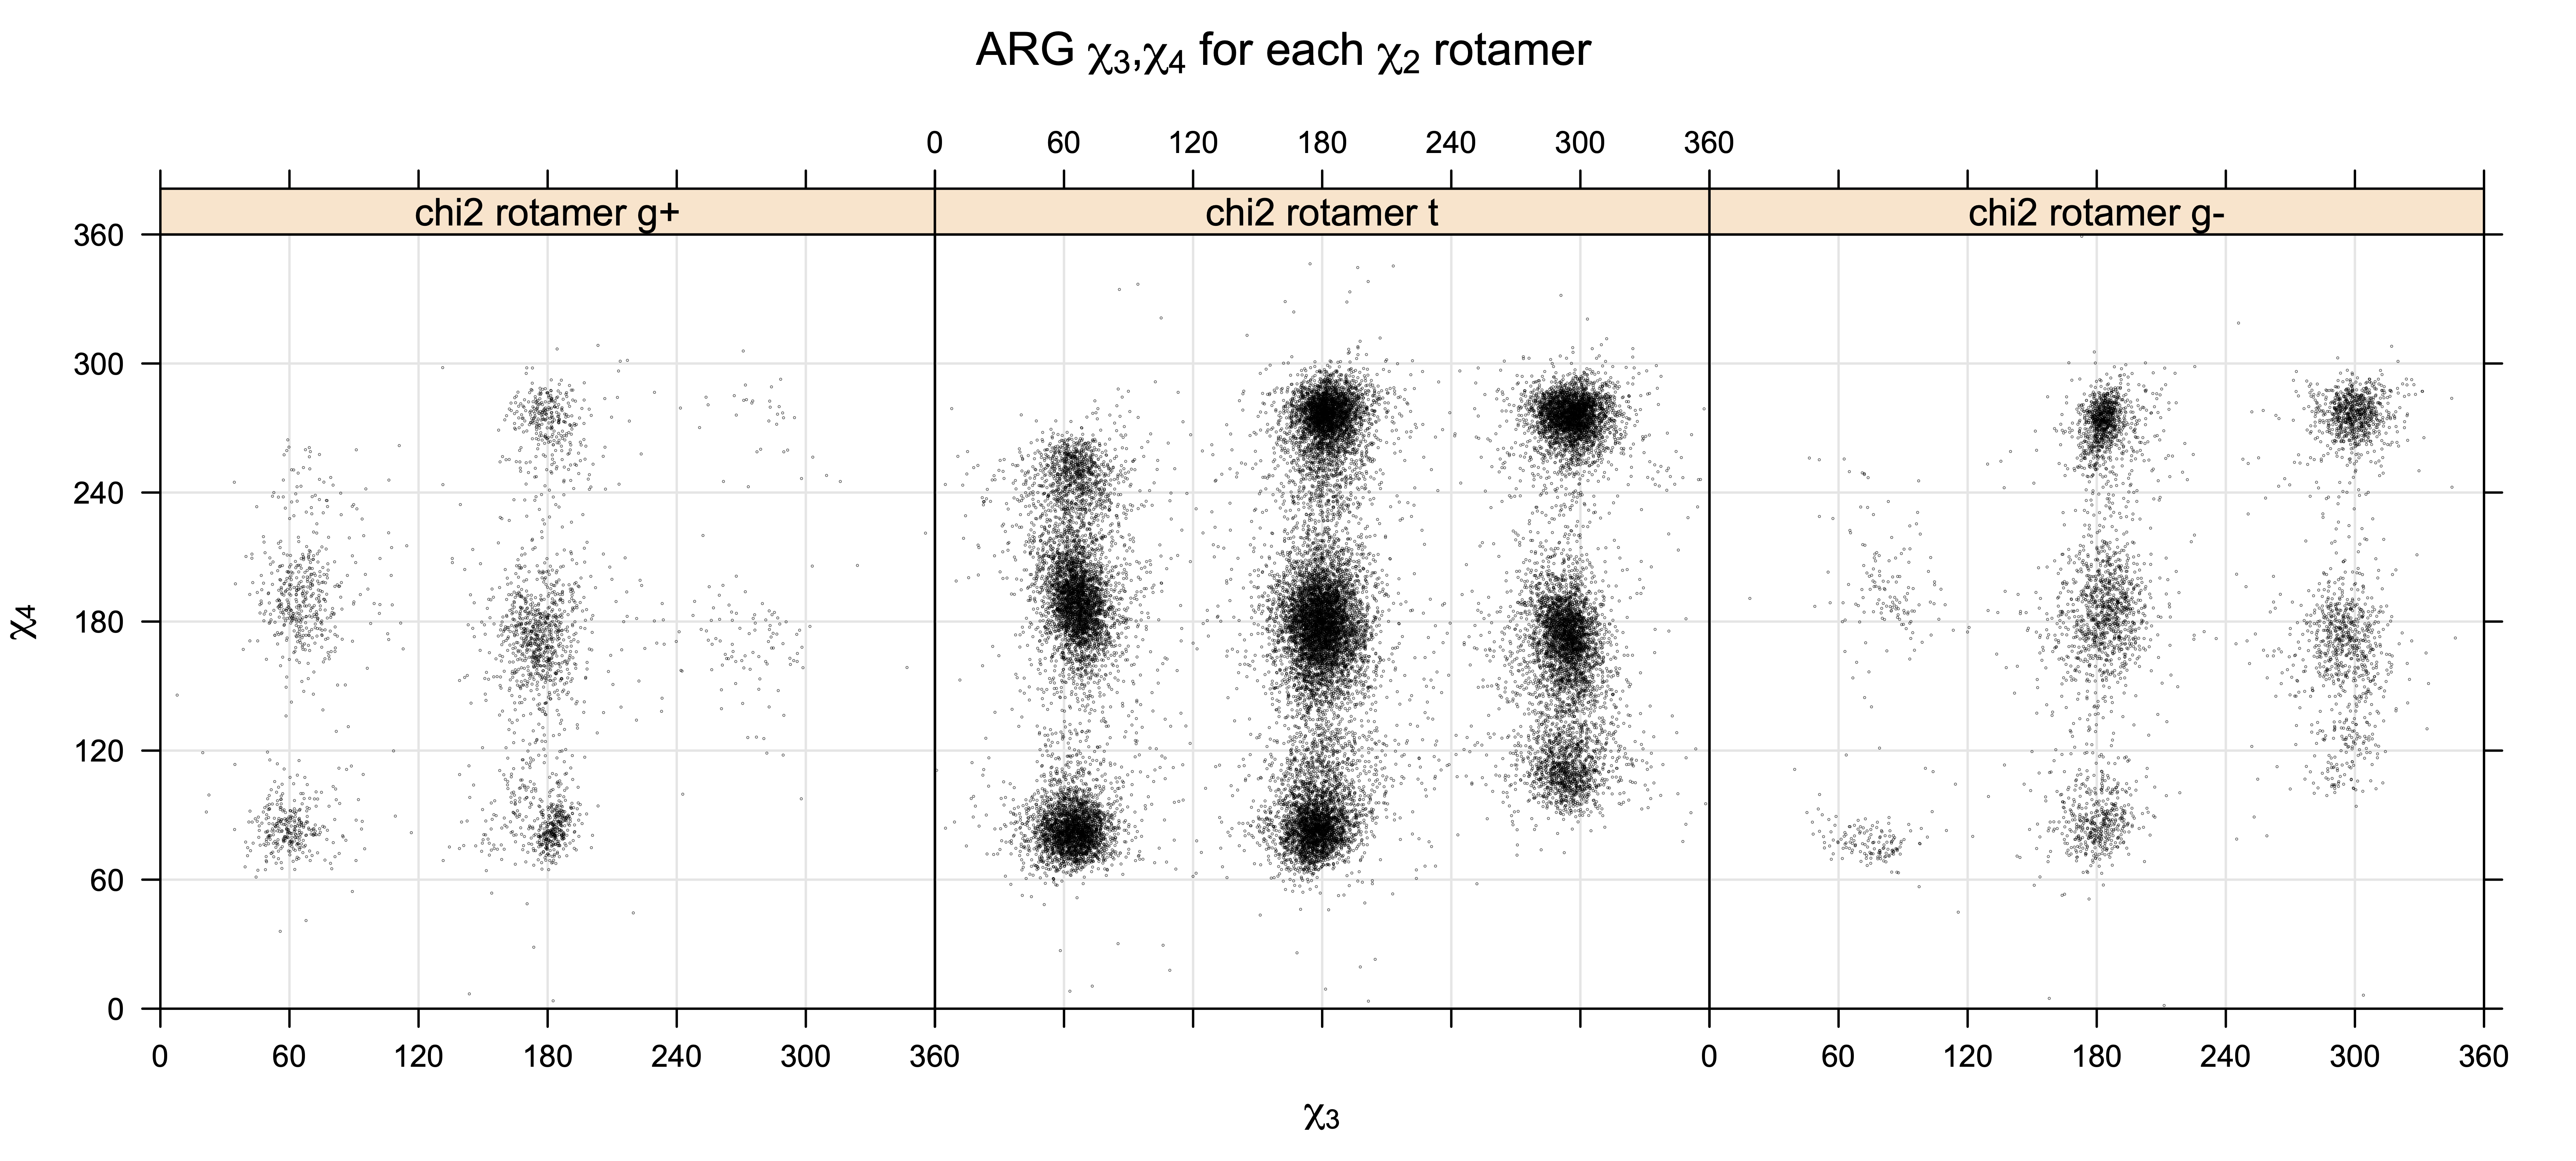
For χ2,χ3 rotamers, we expect the {g+,g-} and {g-,g+} rotamers to be low in population
For χ3,χ4 rotamers, we expect the {g+,g-} and {g-,g+} rotamers to be low in population

Note the distortion distorted position of the {g+,g-} and {g-,g+} χ3,χ4 points for the trans χ2 rotamers of ARG

Scatterplots of χ1,χ2 that consist of one rotameric degree of freedom and non-rotameric degree of freedom

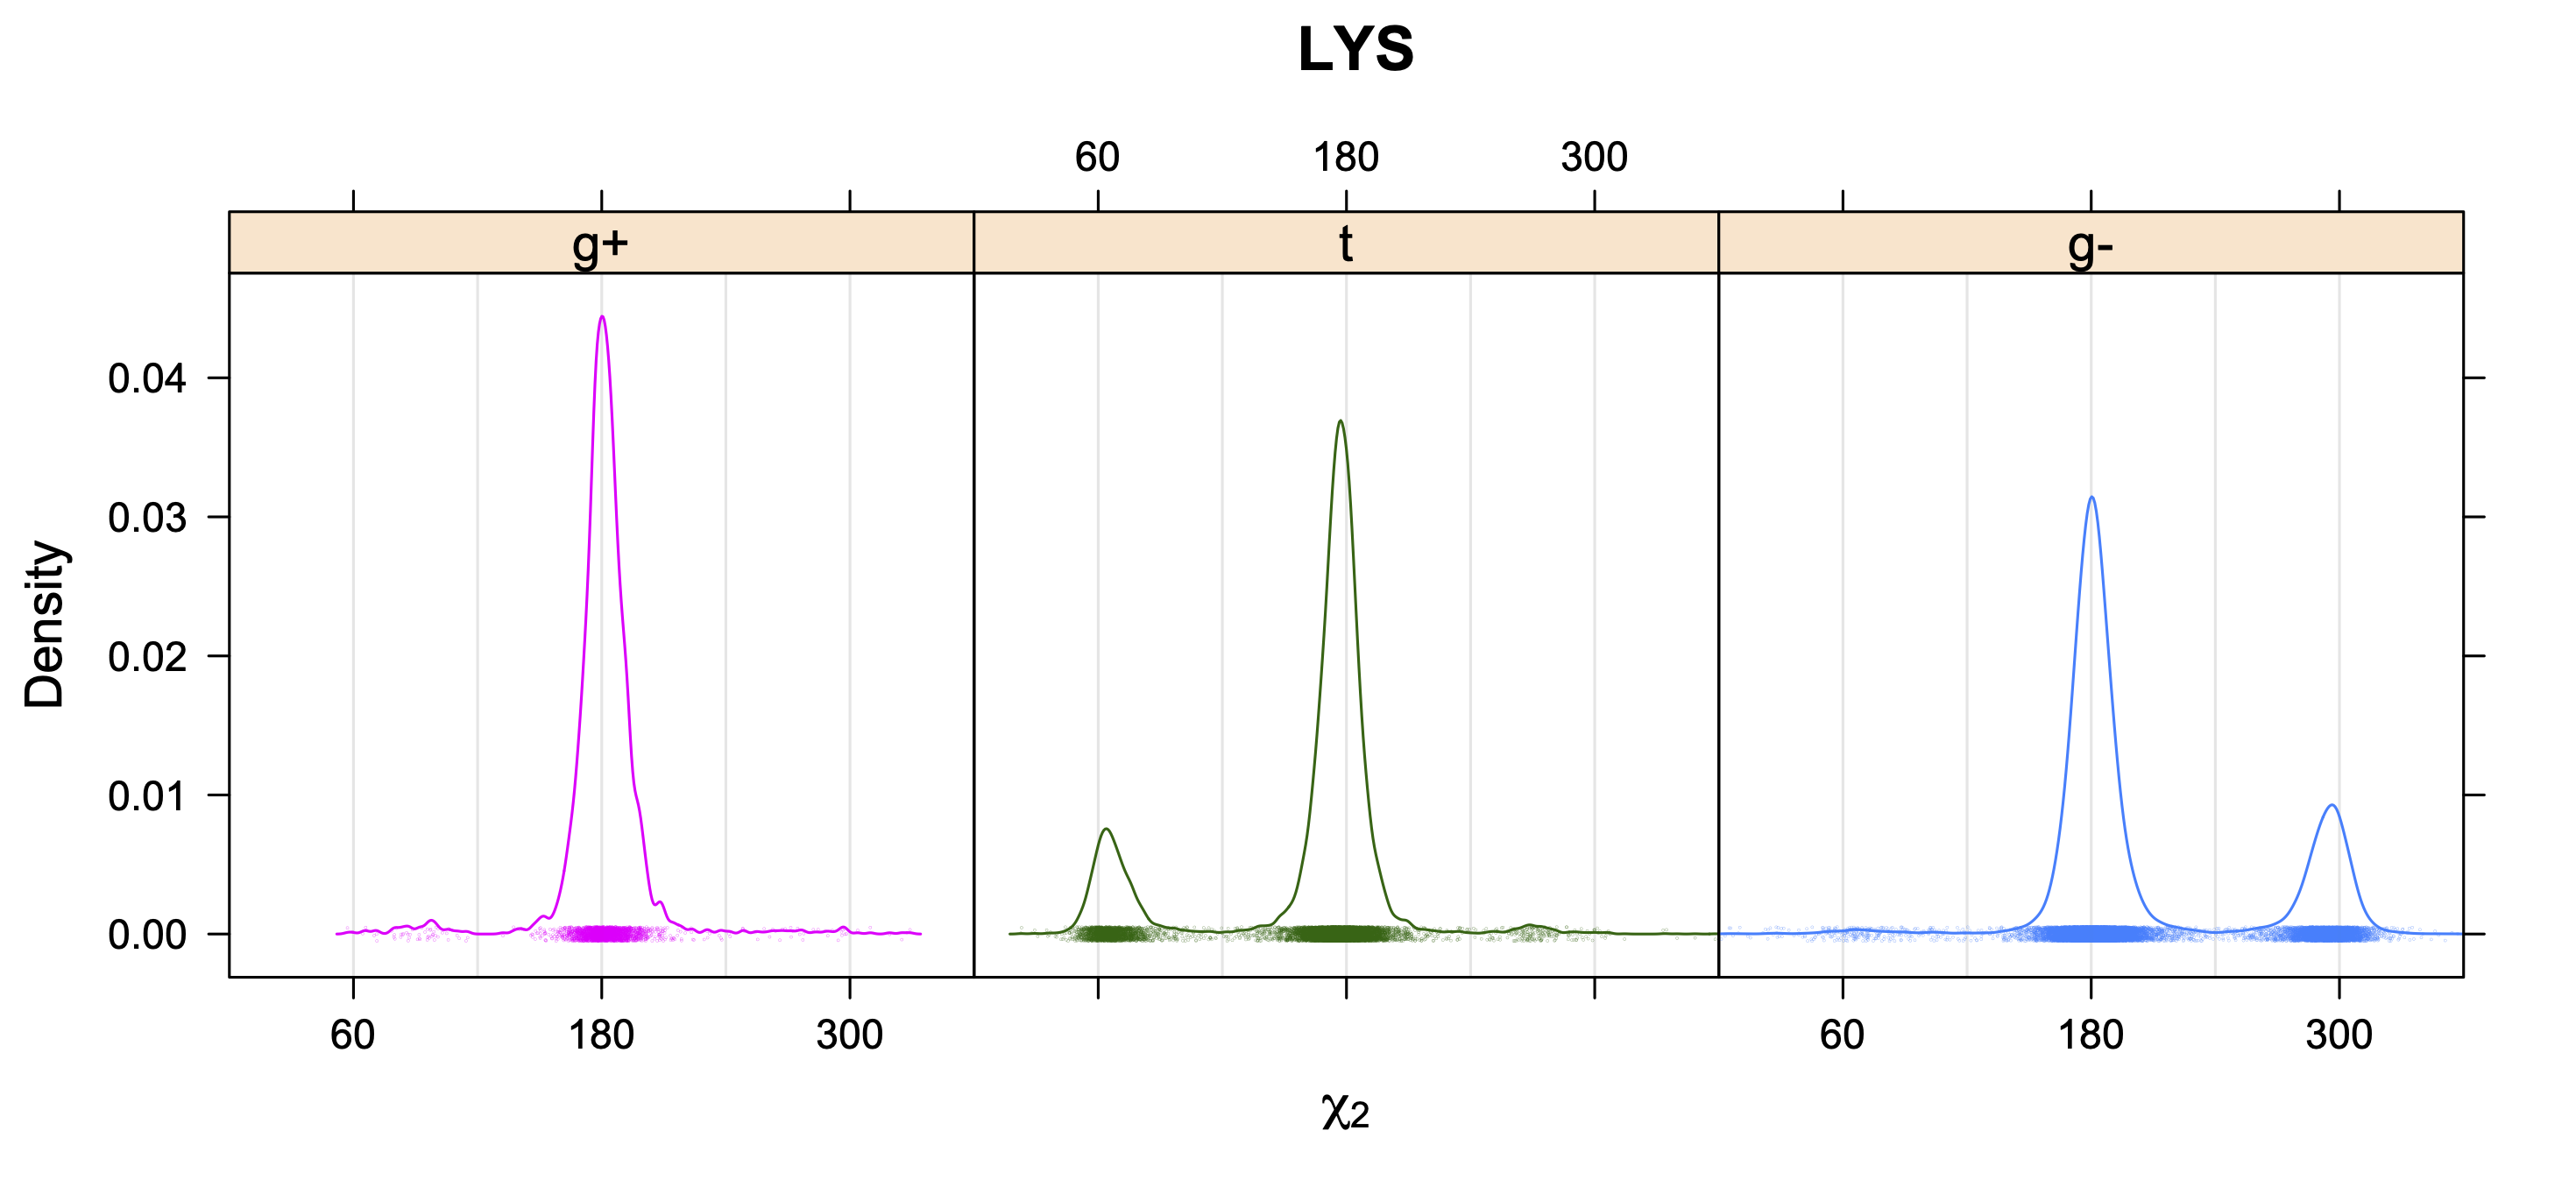
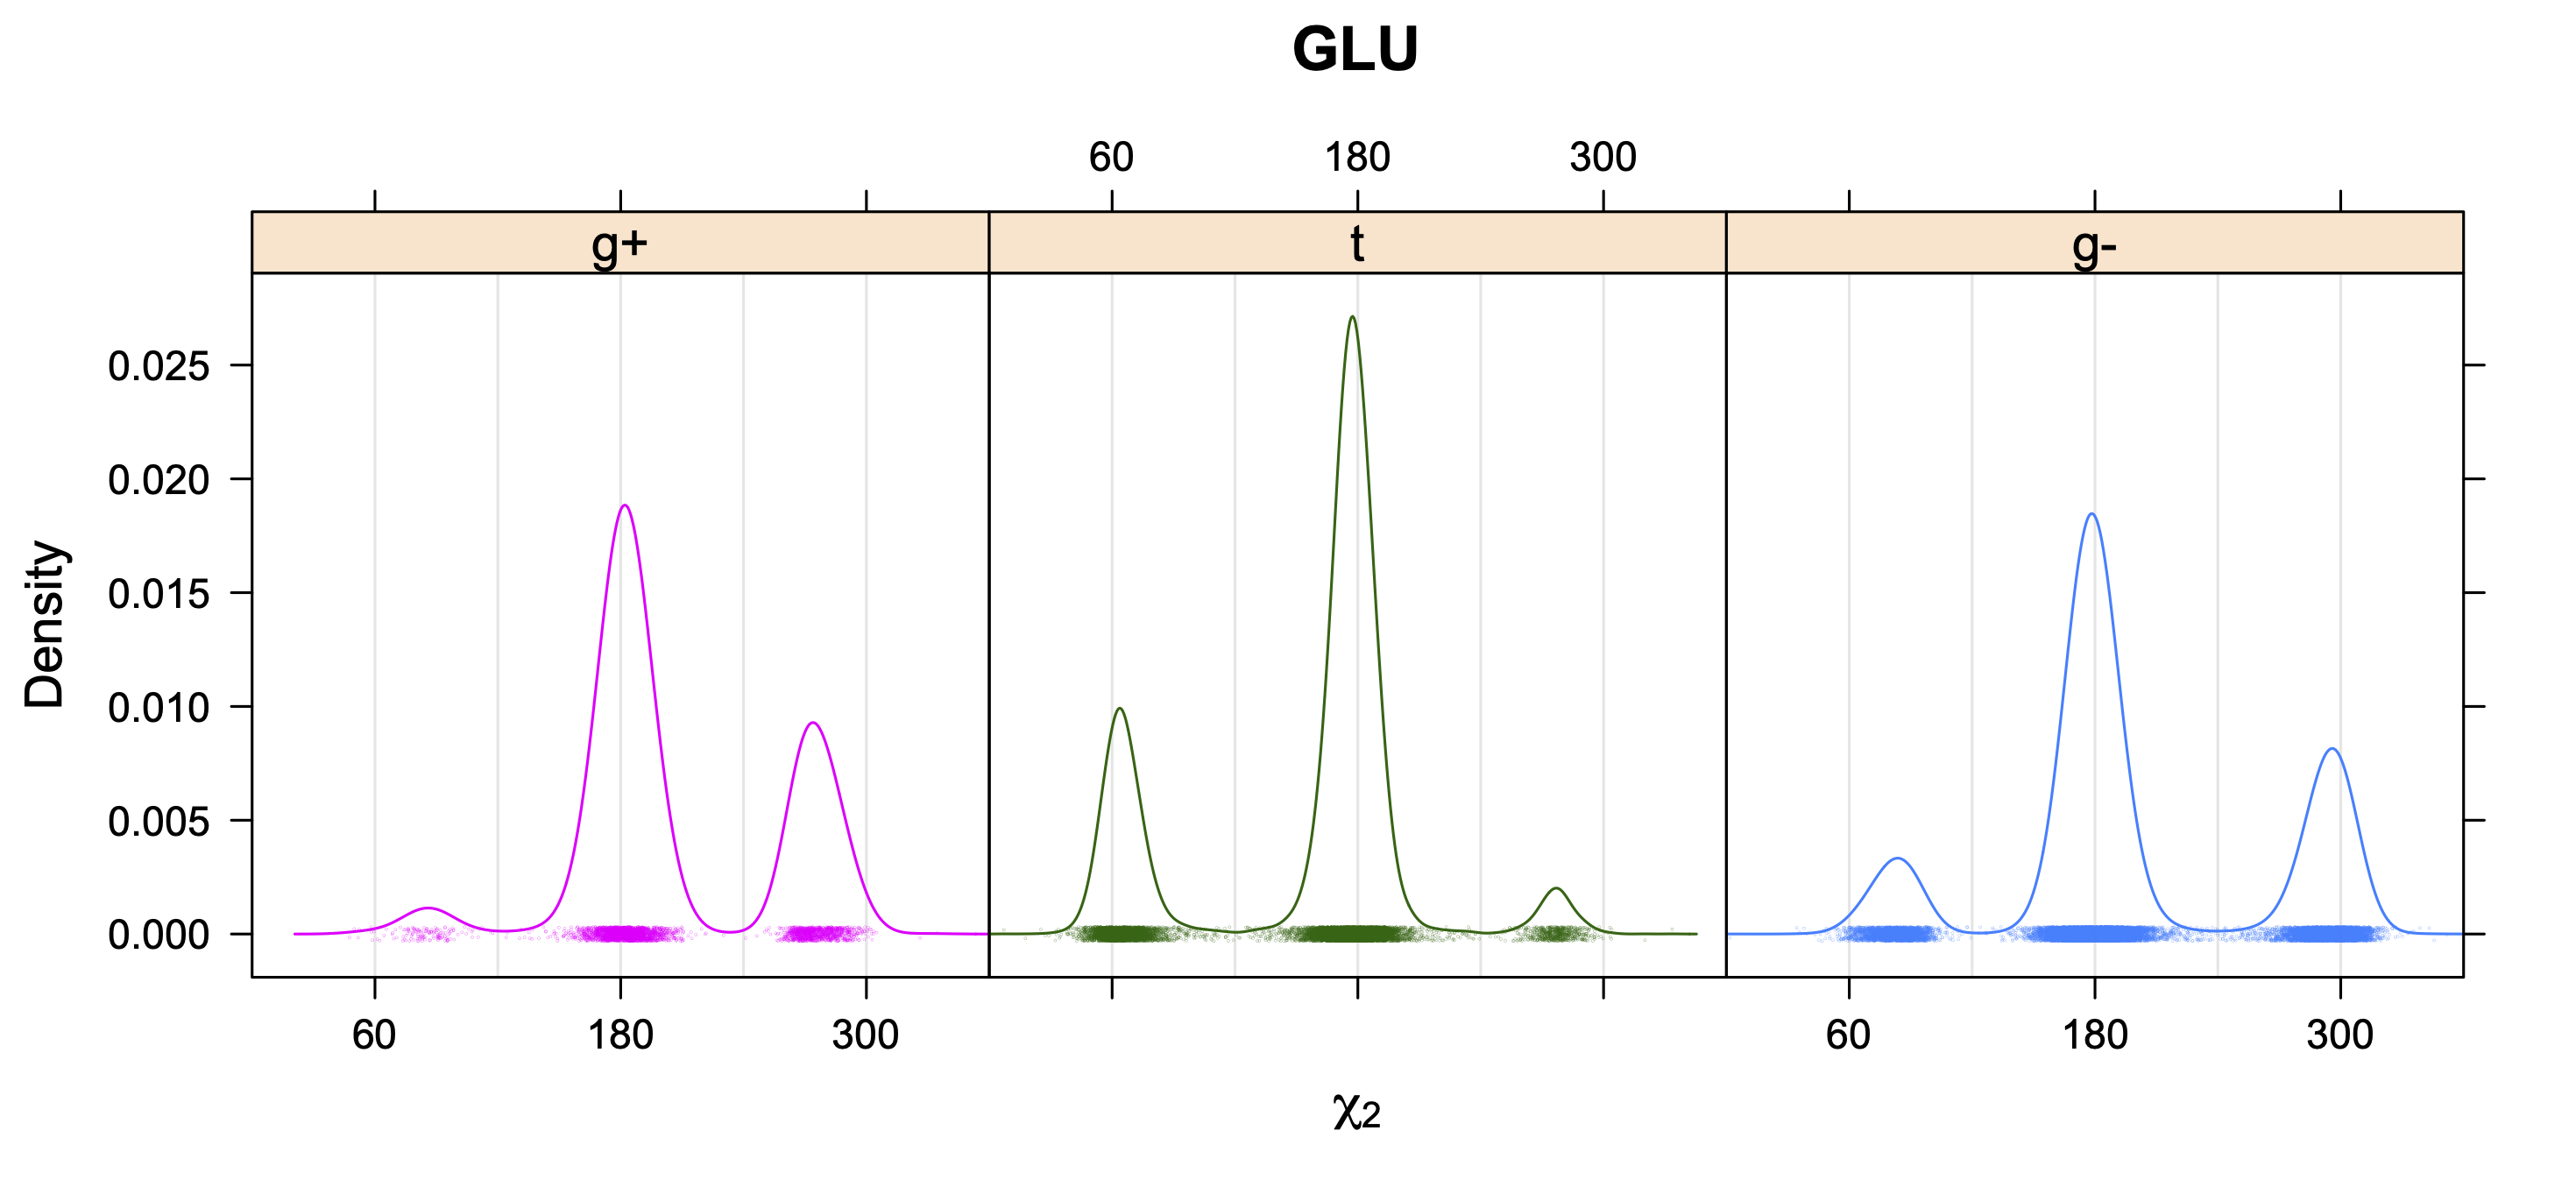
5. Kernel Density Estimates of χ2 for each r1 rotamer type

Backbone-Conformation-Dependent Interactions
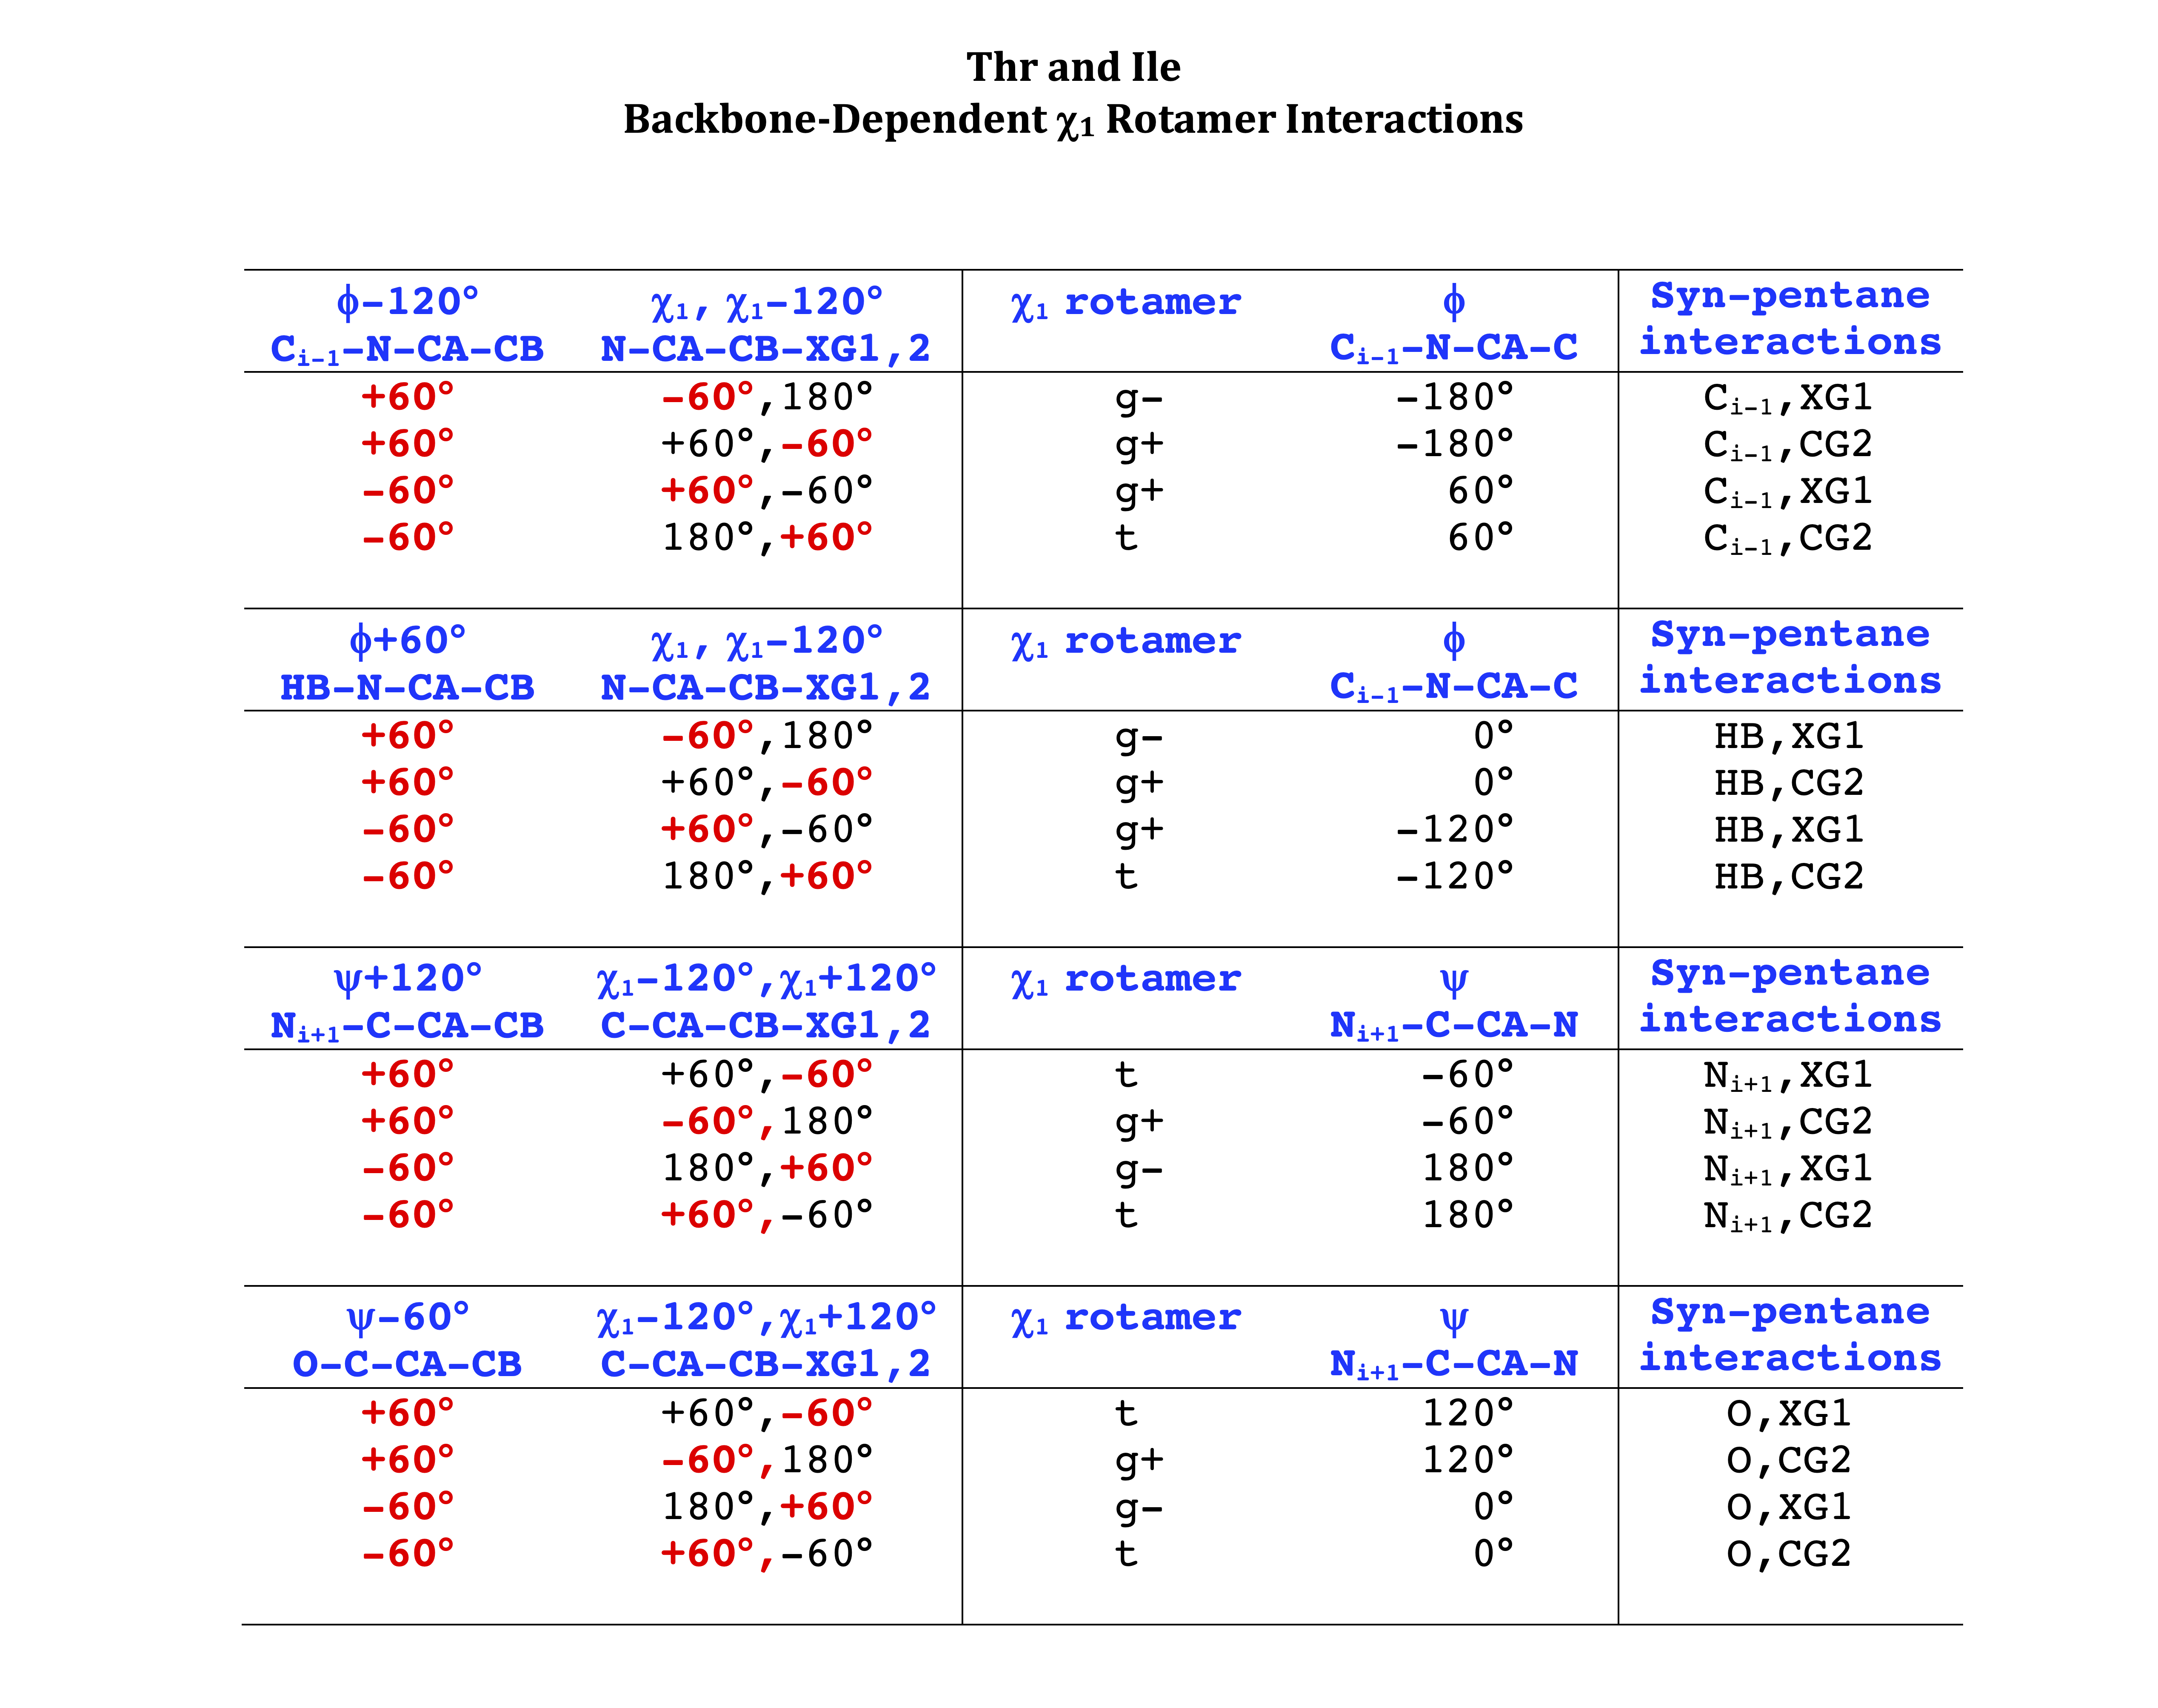
Backbone-conformation dependent interactions occur between gamma heavy atoms (CG,OG,OG1,CG1,CG2,SG) and backbone Ci-1 (carbonyl carbon of the previous amino acid), backbone Ni+1 (backbone nitrogen of the next amino acid), backbone Oi (backbone oxygen of the same amino acid), and the hydrogen bond donor to backbone Ni of the same amino acid ("HB" below, assuming linear hydrogen bond between oxygen and H-N bond). These interactions are expected to be strongly repulsive when dihedrals connecting these heavy atoms to gamma heavy atoms occur in +60°,-60° or -60°,+60° pairs. They will occur in a range about the φ and ψ dihedrals that cause the connecting dihedrals to the backbone to be near +60° or -60° (when connecting dihedral to XG is -60° or +60° respectively). In each case, the dihedrals needed are of the form: X1-X2-X3-X4 and X2-X3-X4-X5. So for instance for ψ dependent interactions, the dihedrals are Ni+1-C-CA-CB and C-CA-CB-XG or ψ+120° and χ1-120° respectively. These are tabulated below for instances where syn-pentane interactions are expected. Val, Ile, and Thr are tabulated separately, since these amino acids have 2 gamma heavy atoms. Interactions with "HB" are expected to be weak, but the backbone-dependent rotamer library does exhibit effects due to this interaction.
Note: we need to observe ranges of φ and ψ of 0° to 90° and -90° to 0°, for g- and g+ dihedrals of the side chain. Since χ1 is always an sp3-sp3 dihedral with local minima around 180°, +60°, and -60°, χ1 (or χ1-120°) will always fall in the -90° to 0° or 0° to 90° range. φ and ψ are both sp2-sp3 dihedrals, which do not have barriers as high as sp3-sp3 dihedrals. They can take on a somewhat broader range of dihedrals than sp3-sp3 bonds. Hence, we locate 90° degree intervals of φ and ψ that will conflict with certain χ1 rotamers to search for likely steric conflicts.

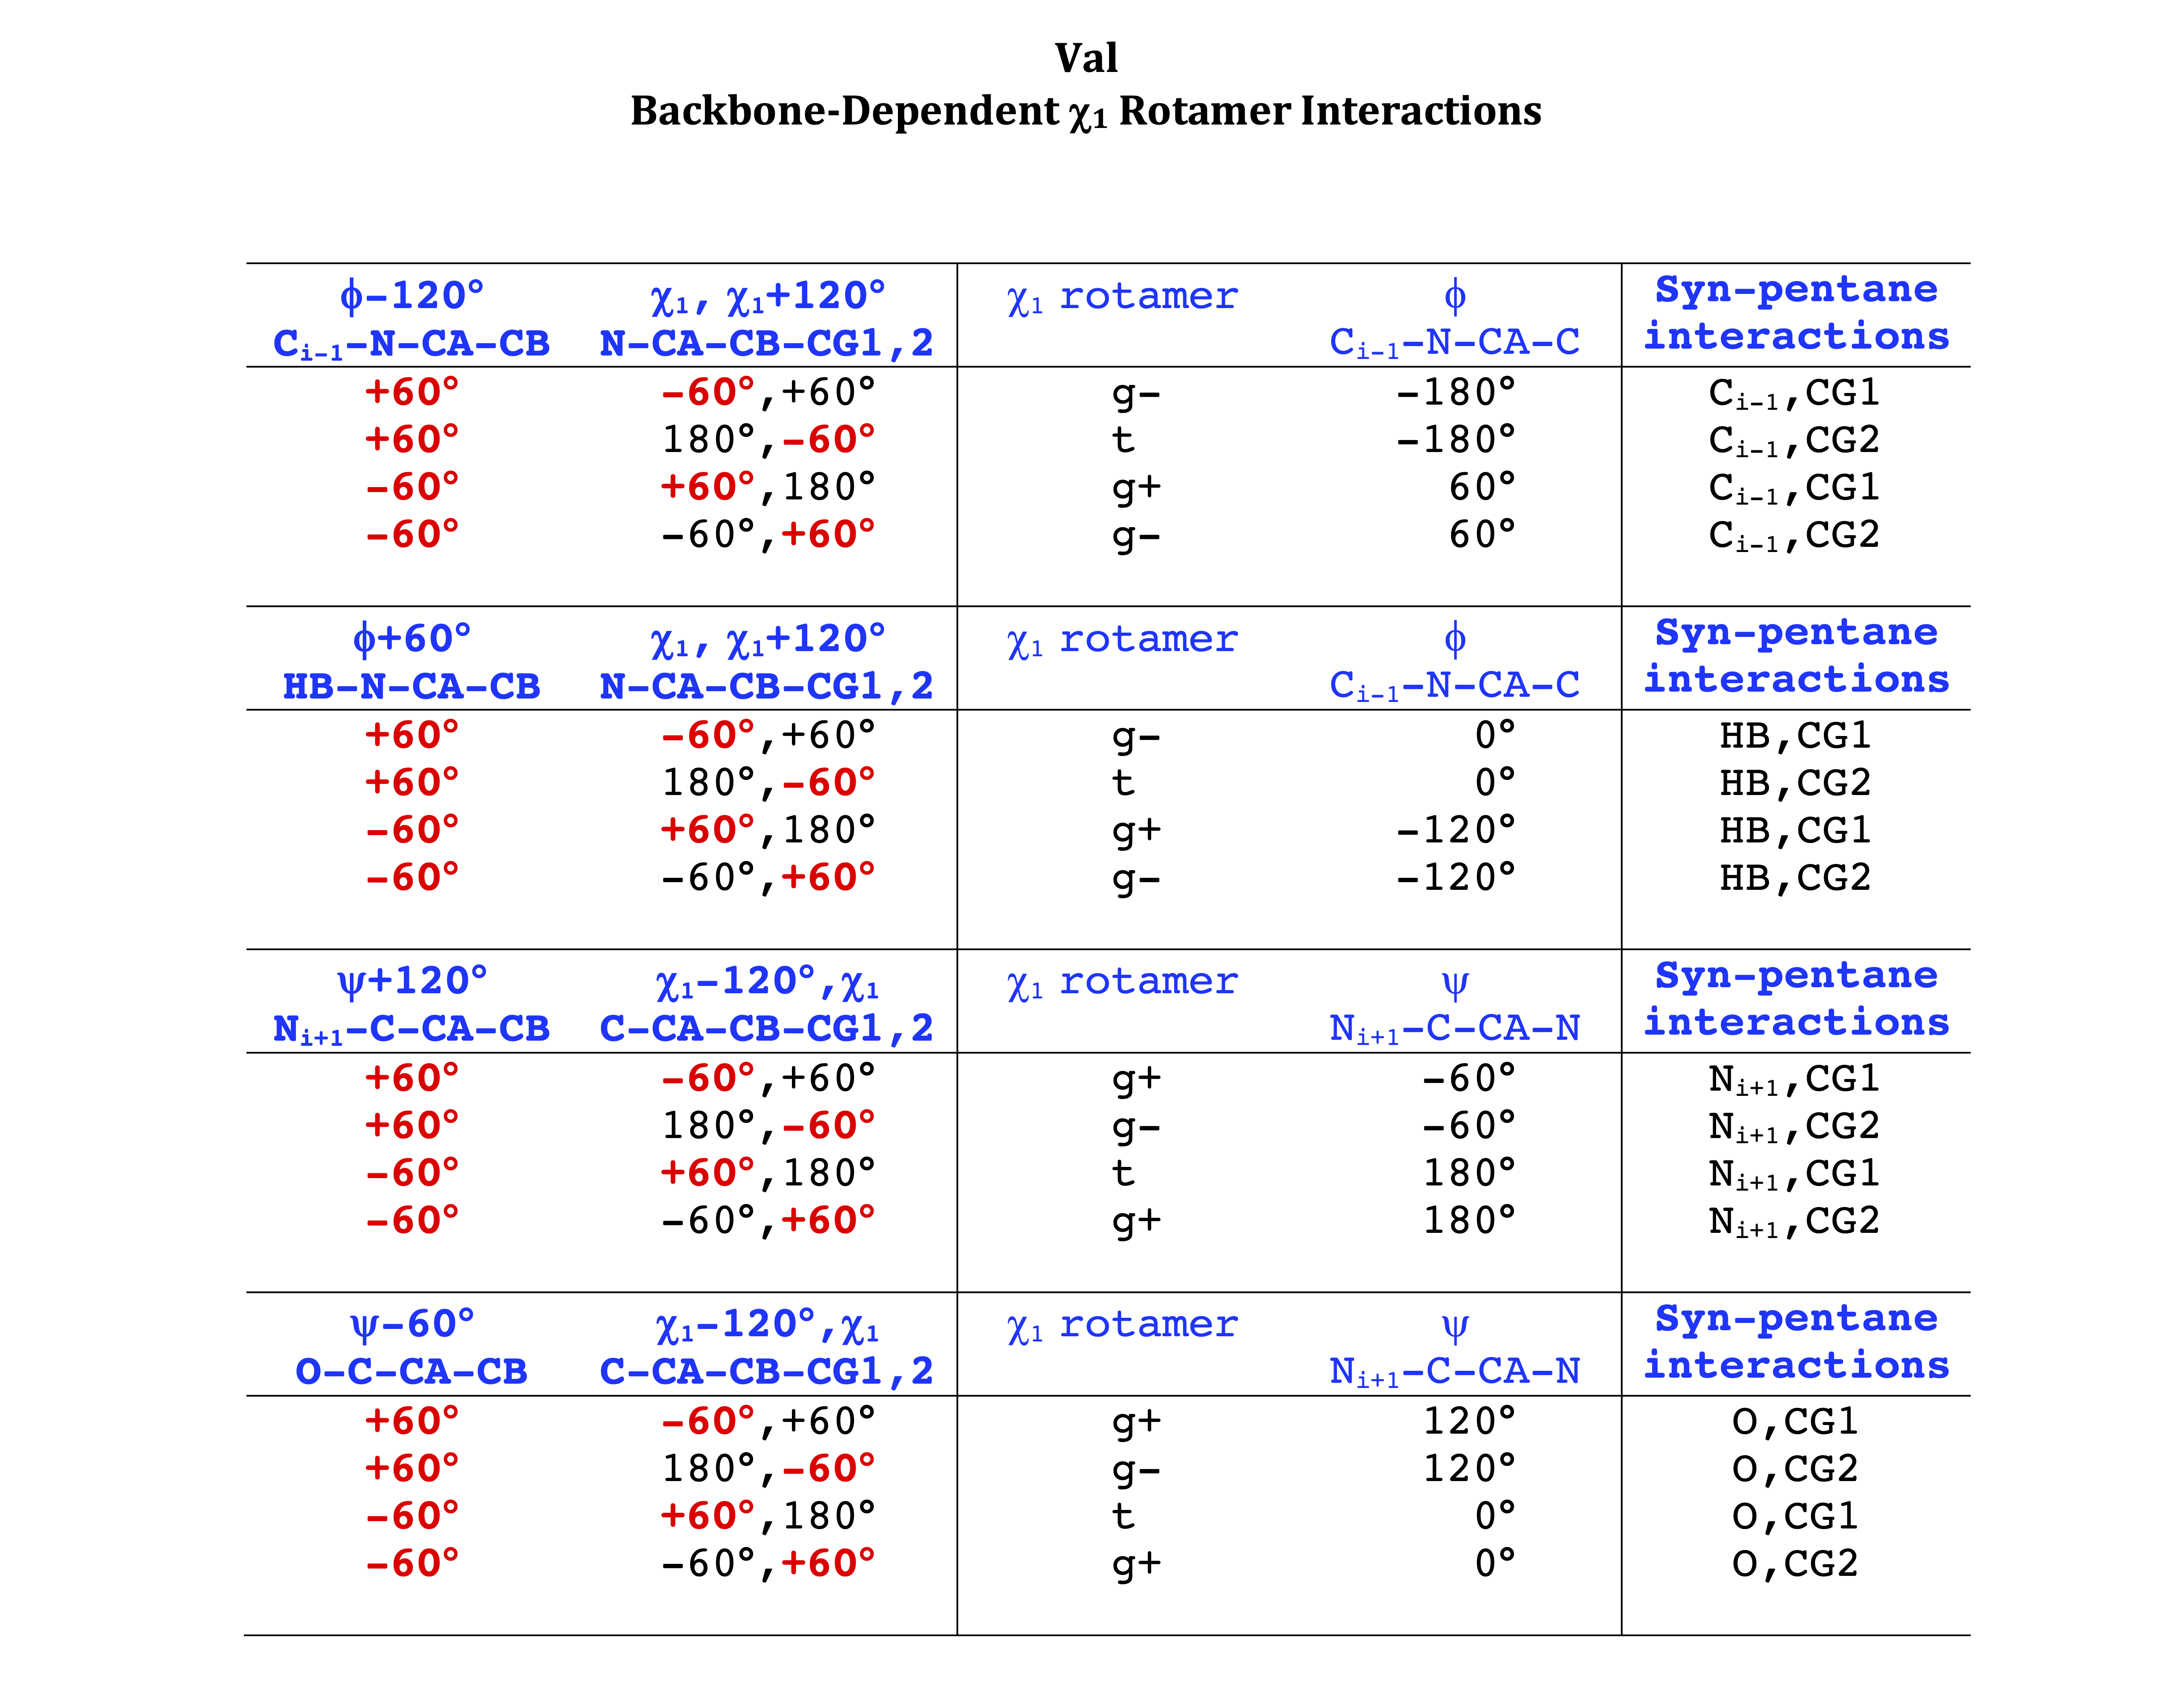
Val
Val has CG1 at χ1 and CG2 at χ1+120°. Because Val g+ and g- conformations have steric interactions with the backbone near ψ=120° and -60° (the most populated ψ ranges), Val is the only amino acid where the t rotamer (χ1~180°) is the most common.
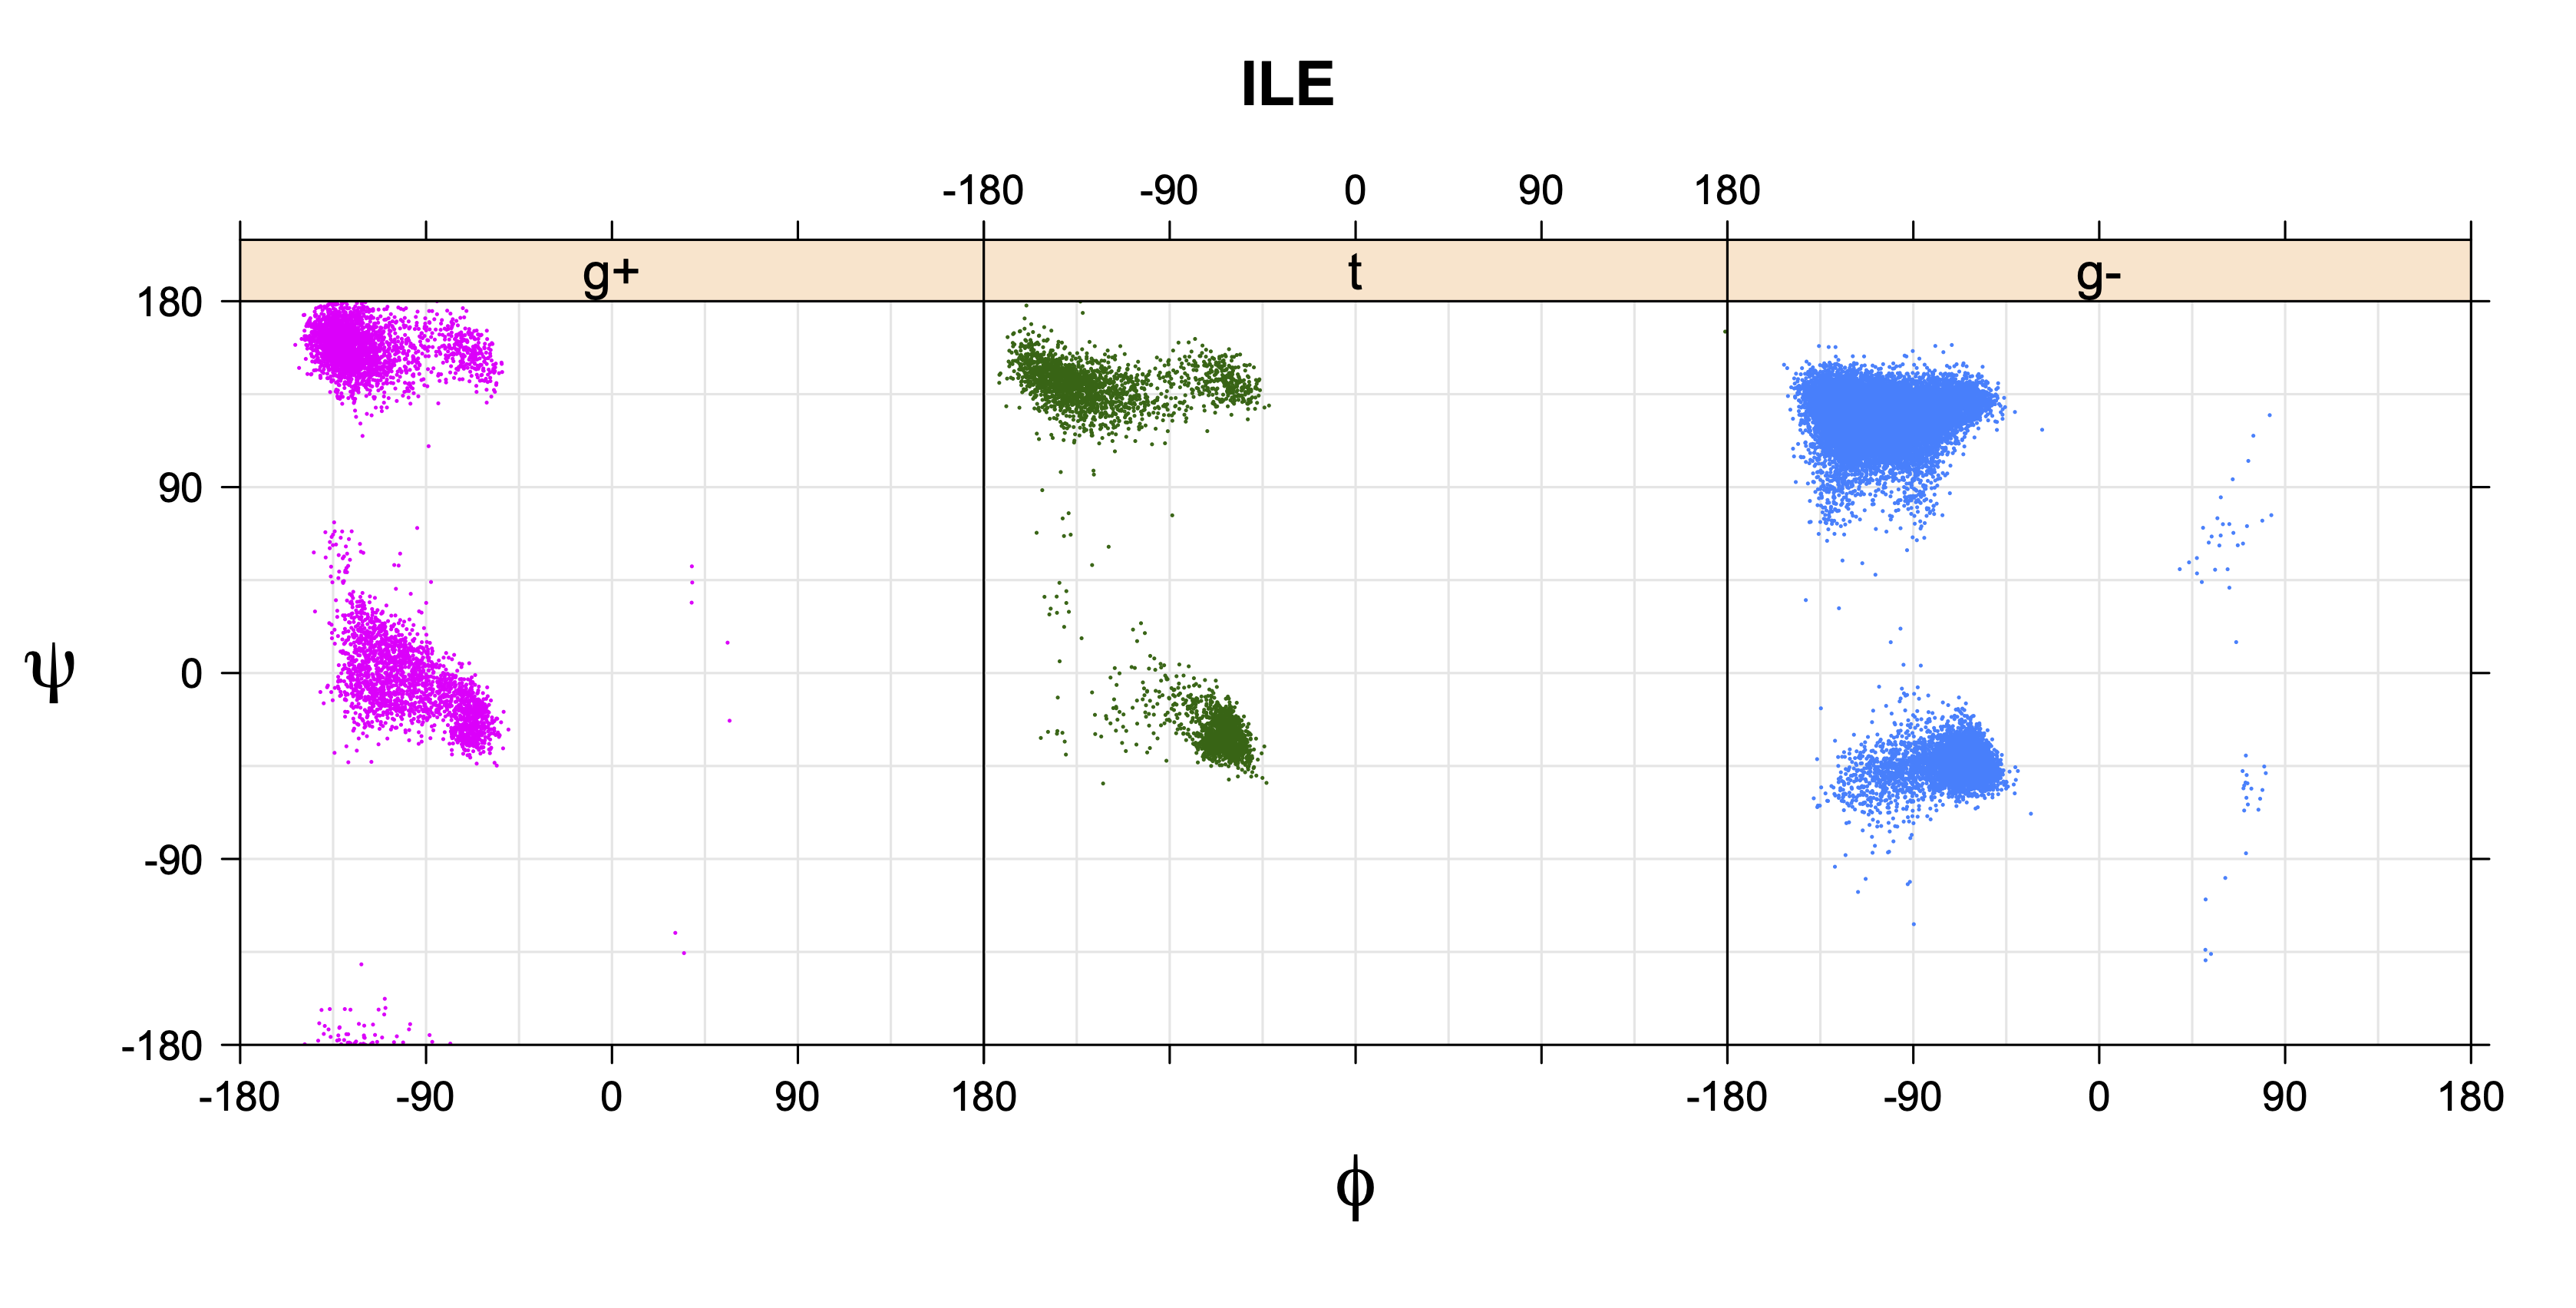
Ile has CG1 at χ1 and CG2 at χ1-120°. Thr has OG1 at χ1 and CG2 at χ1-120°.
Graphical Views of the Backbone-Dependent Rotamer Library
The backbone-dependent rotamer library can be visualized graphically in a number of ways.
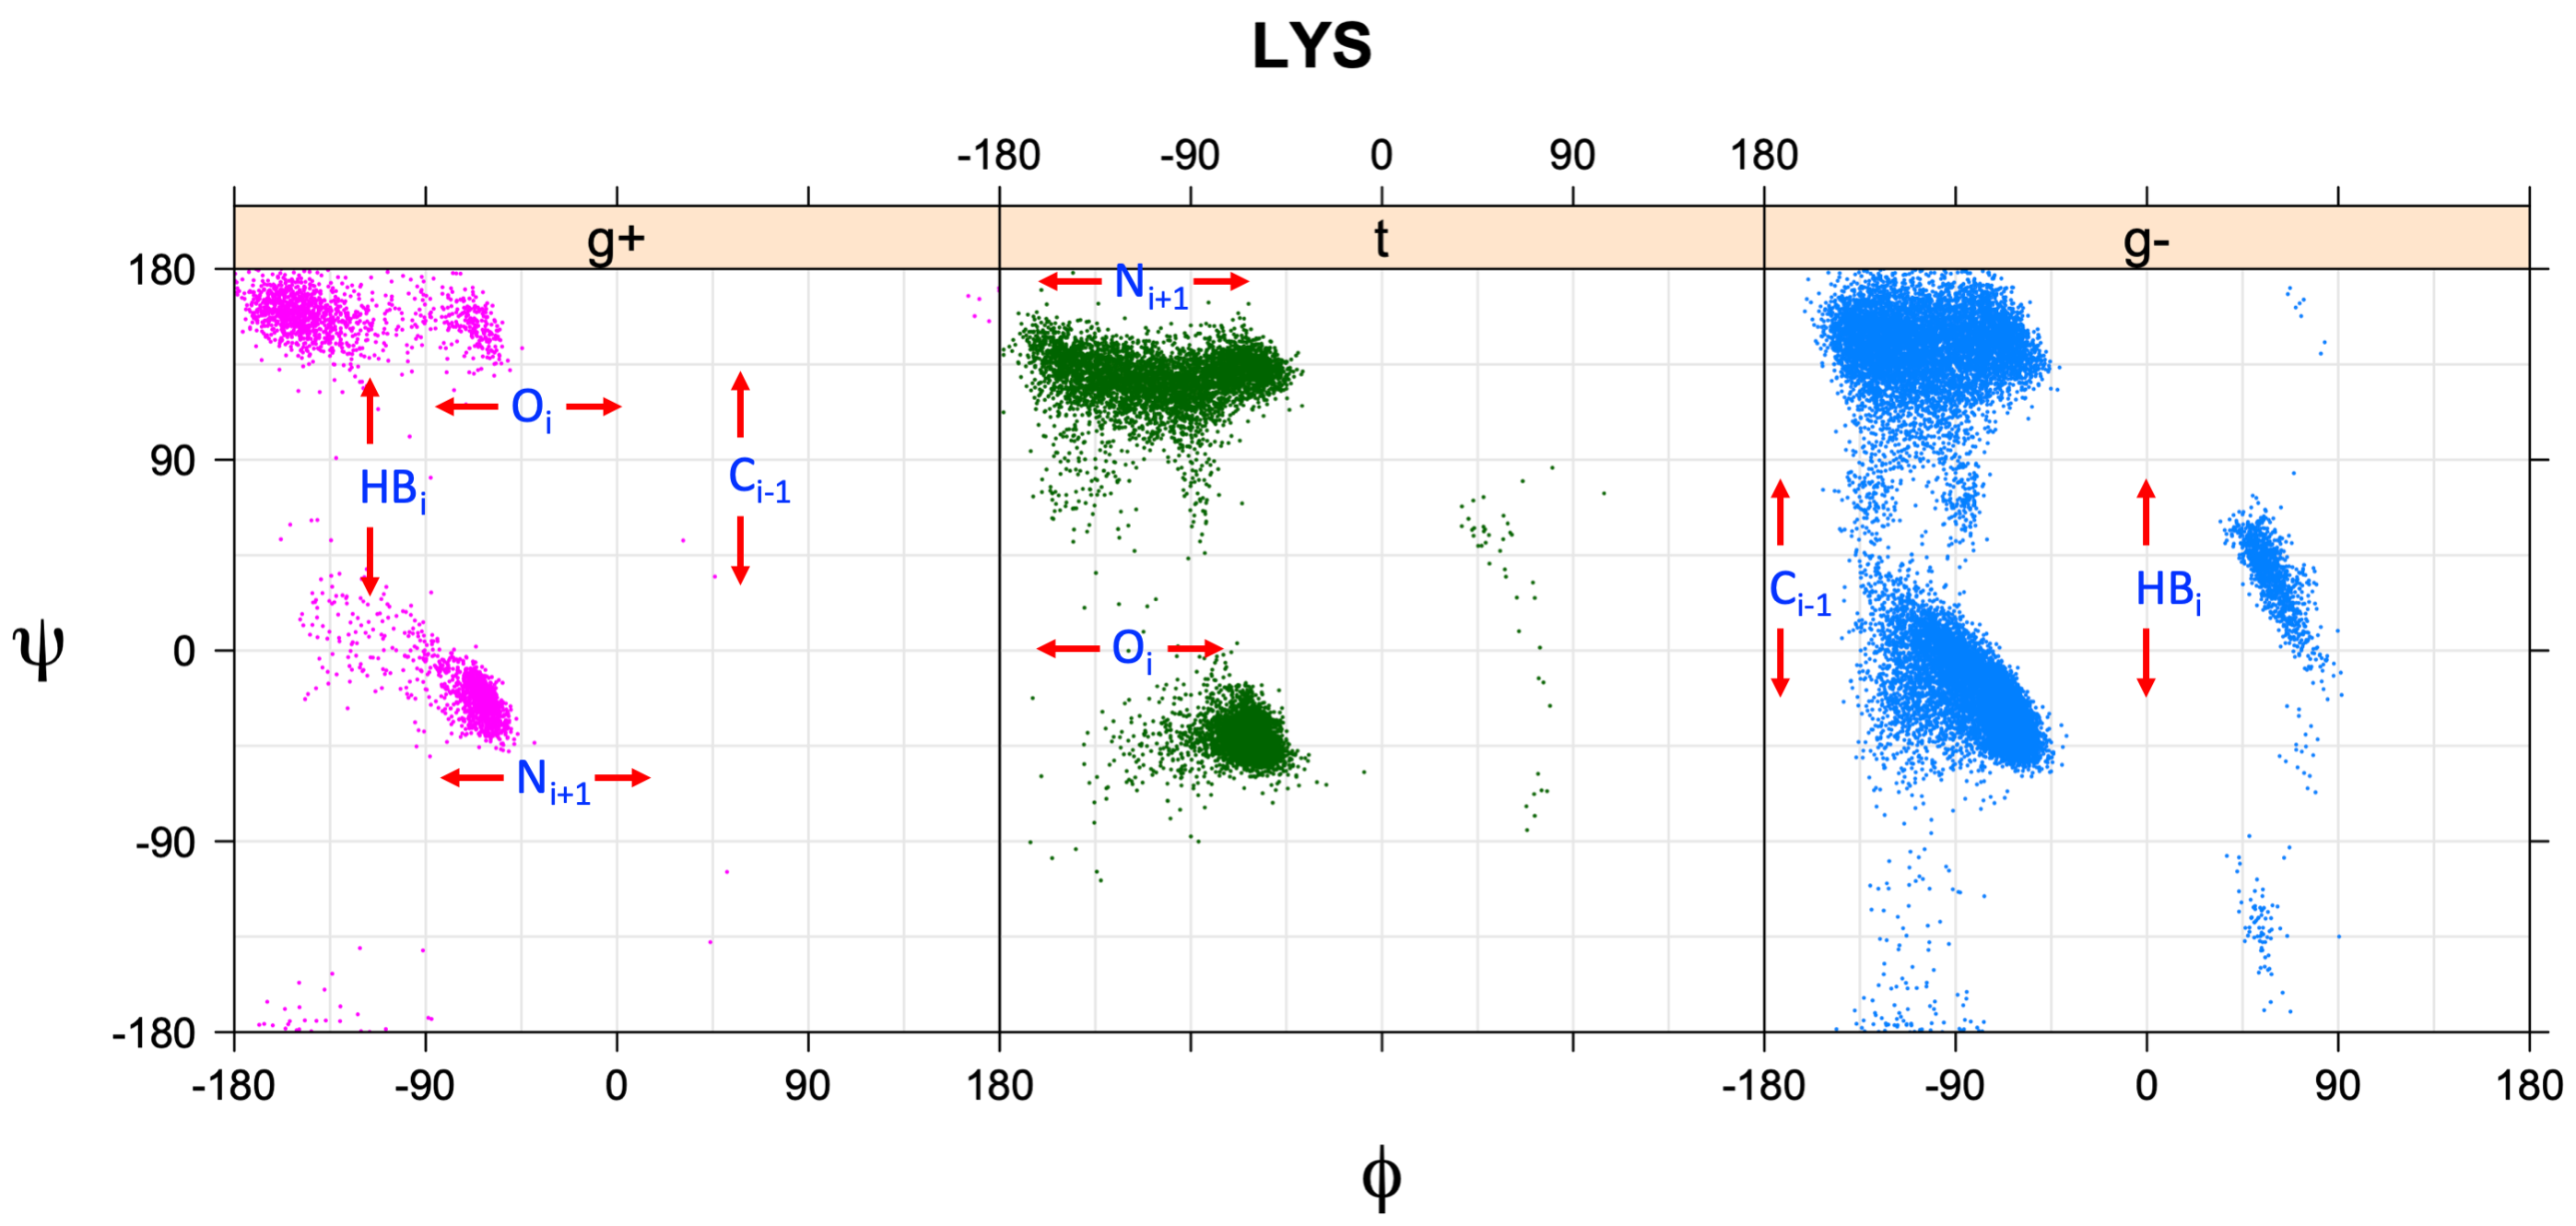
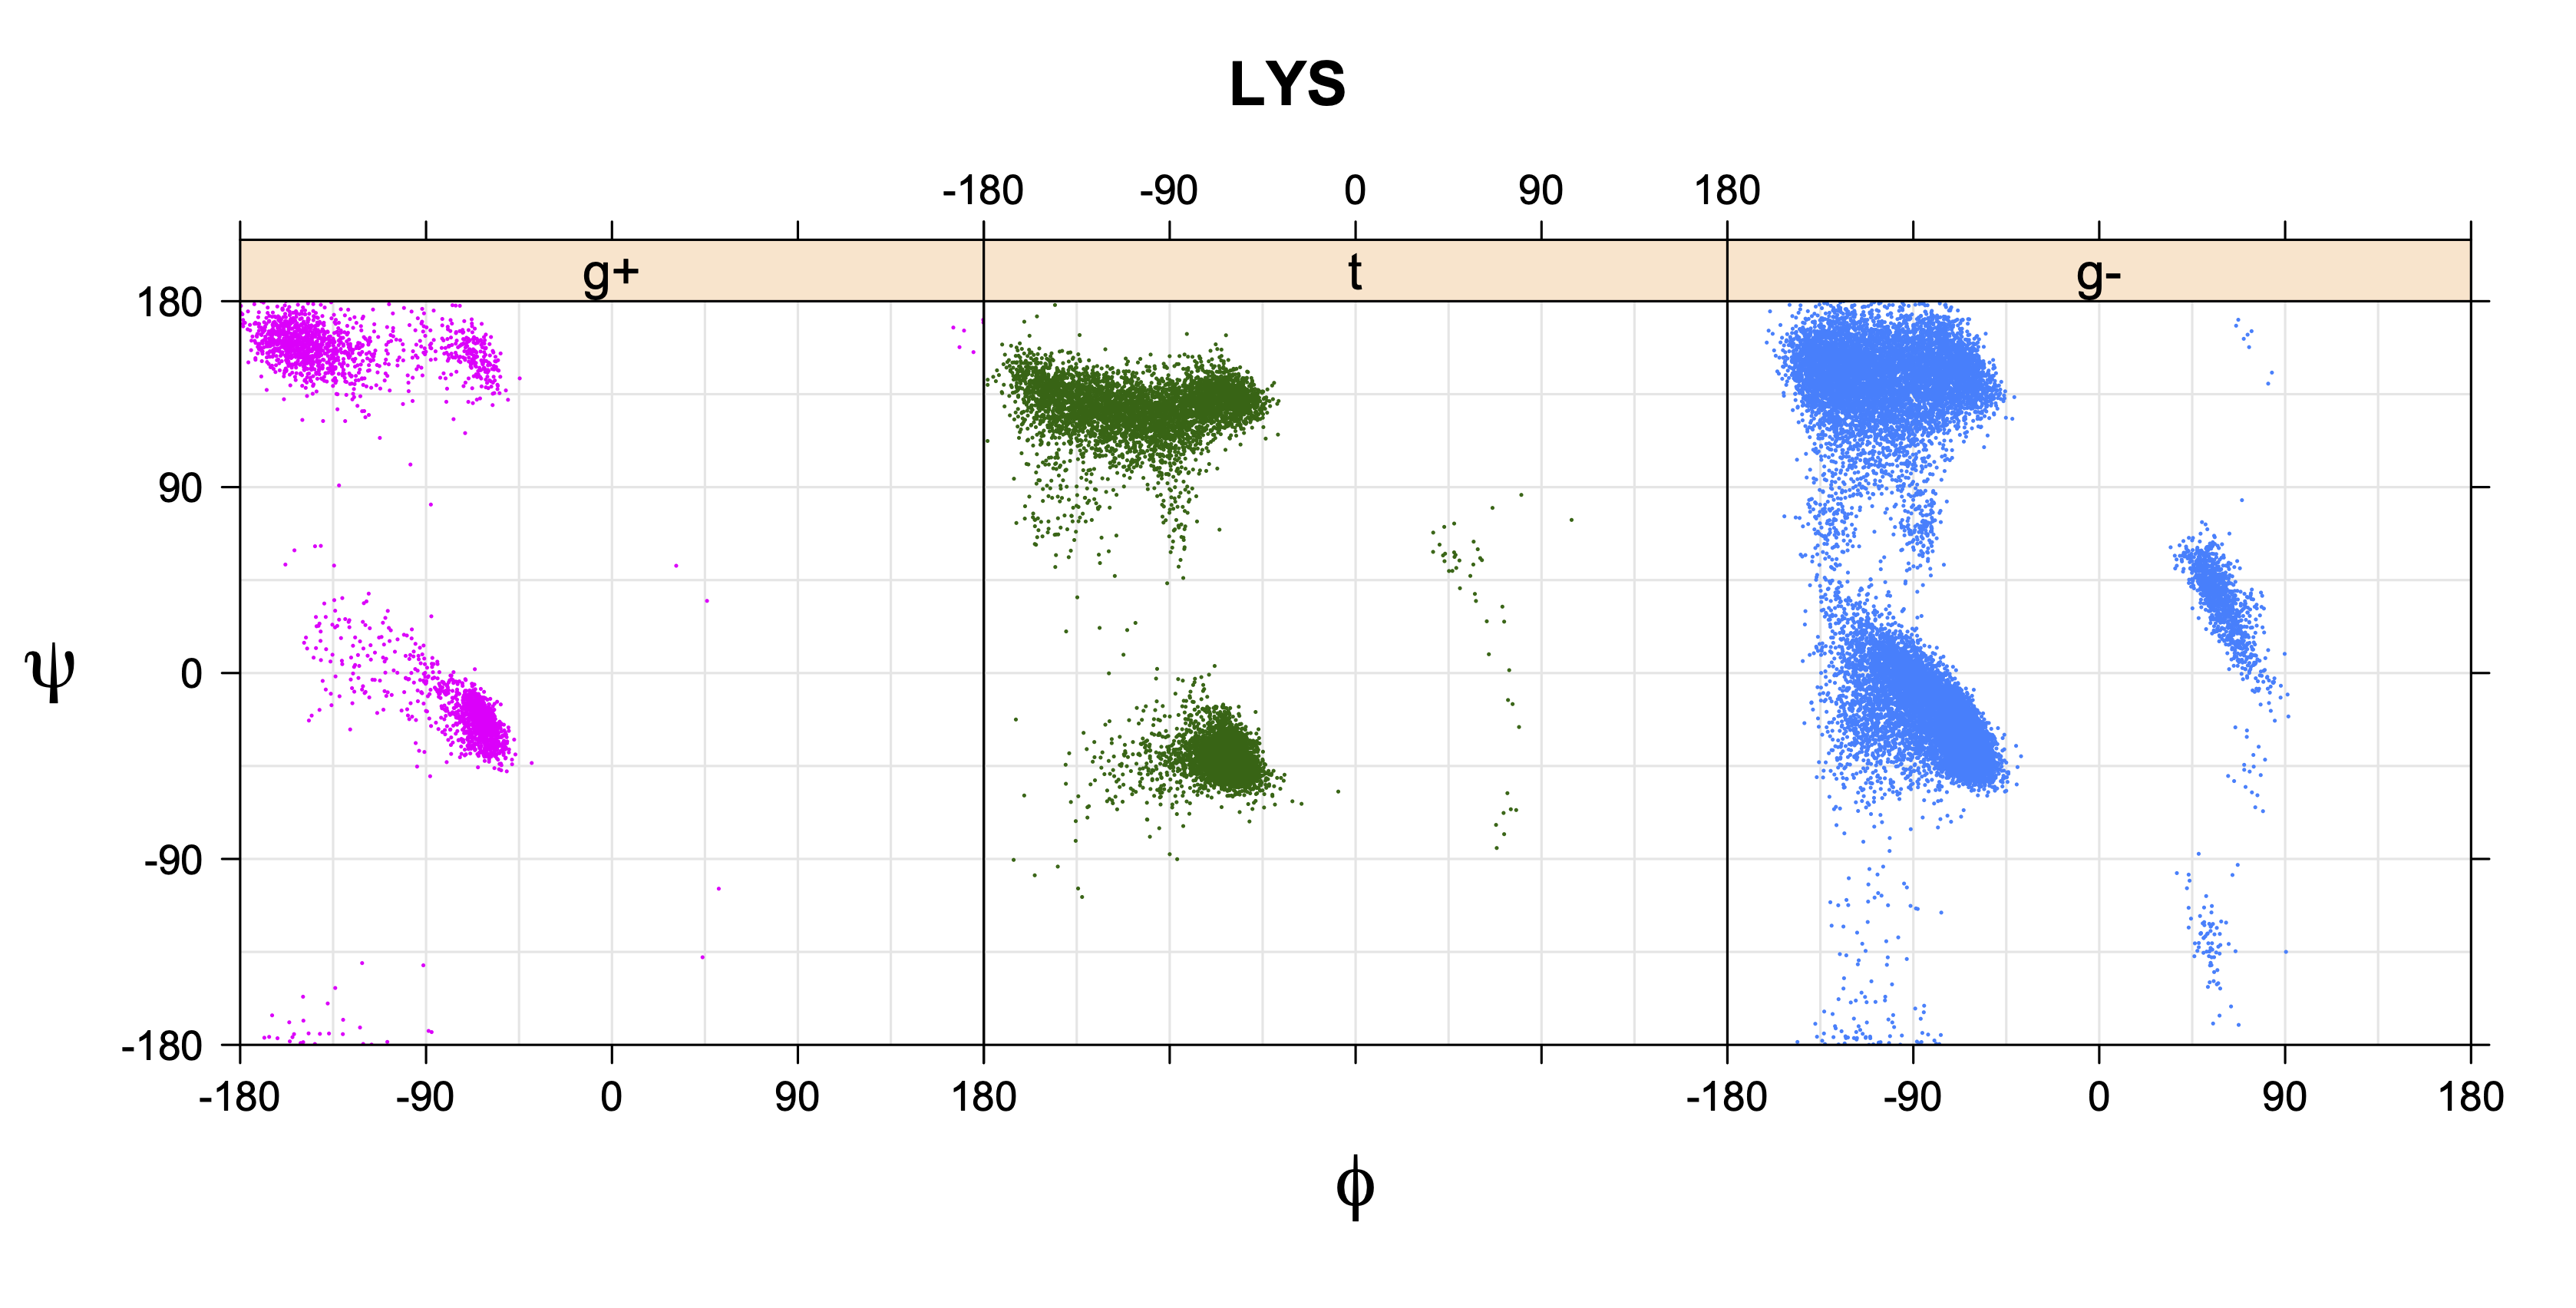
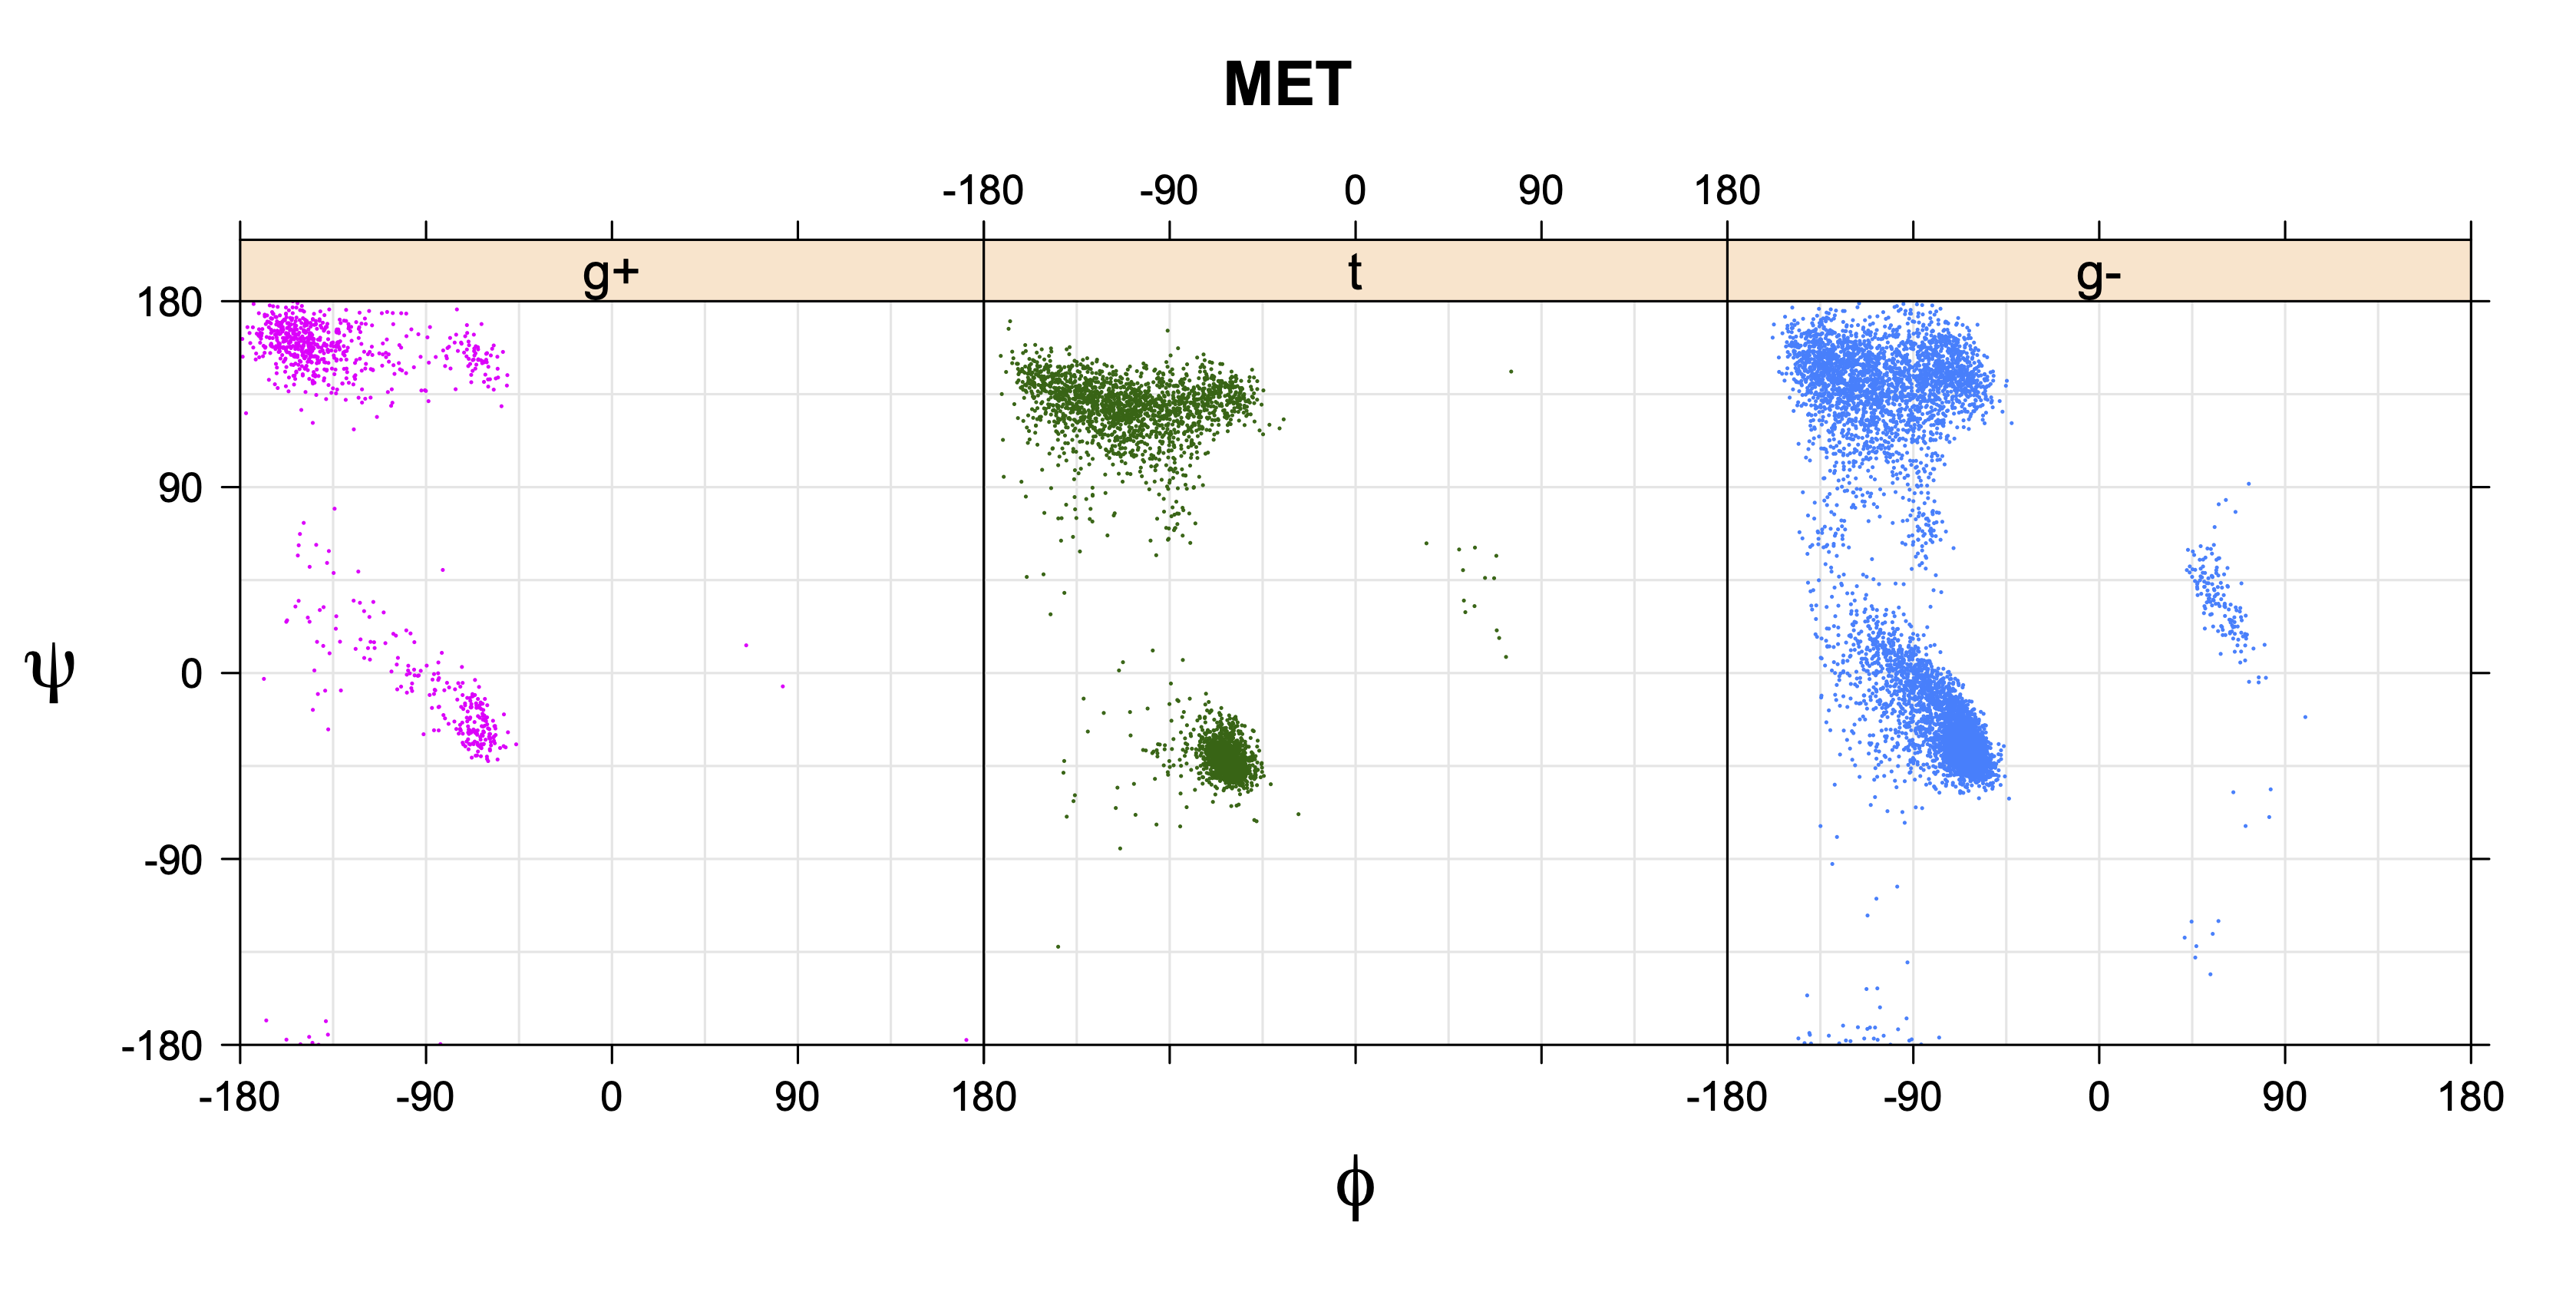
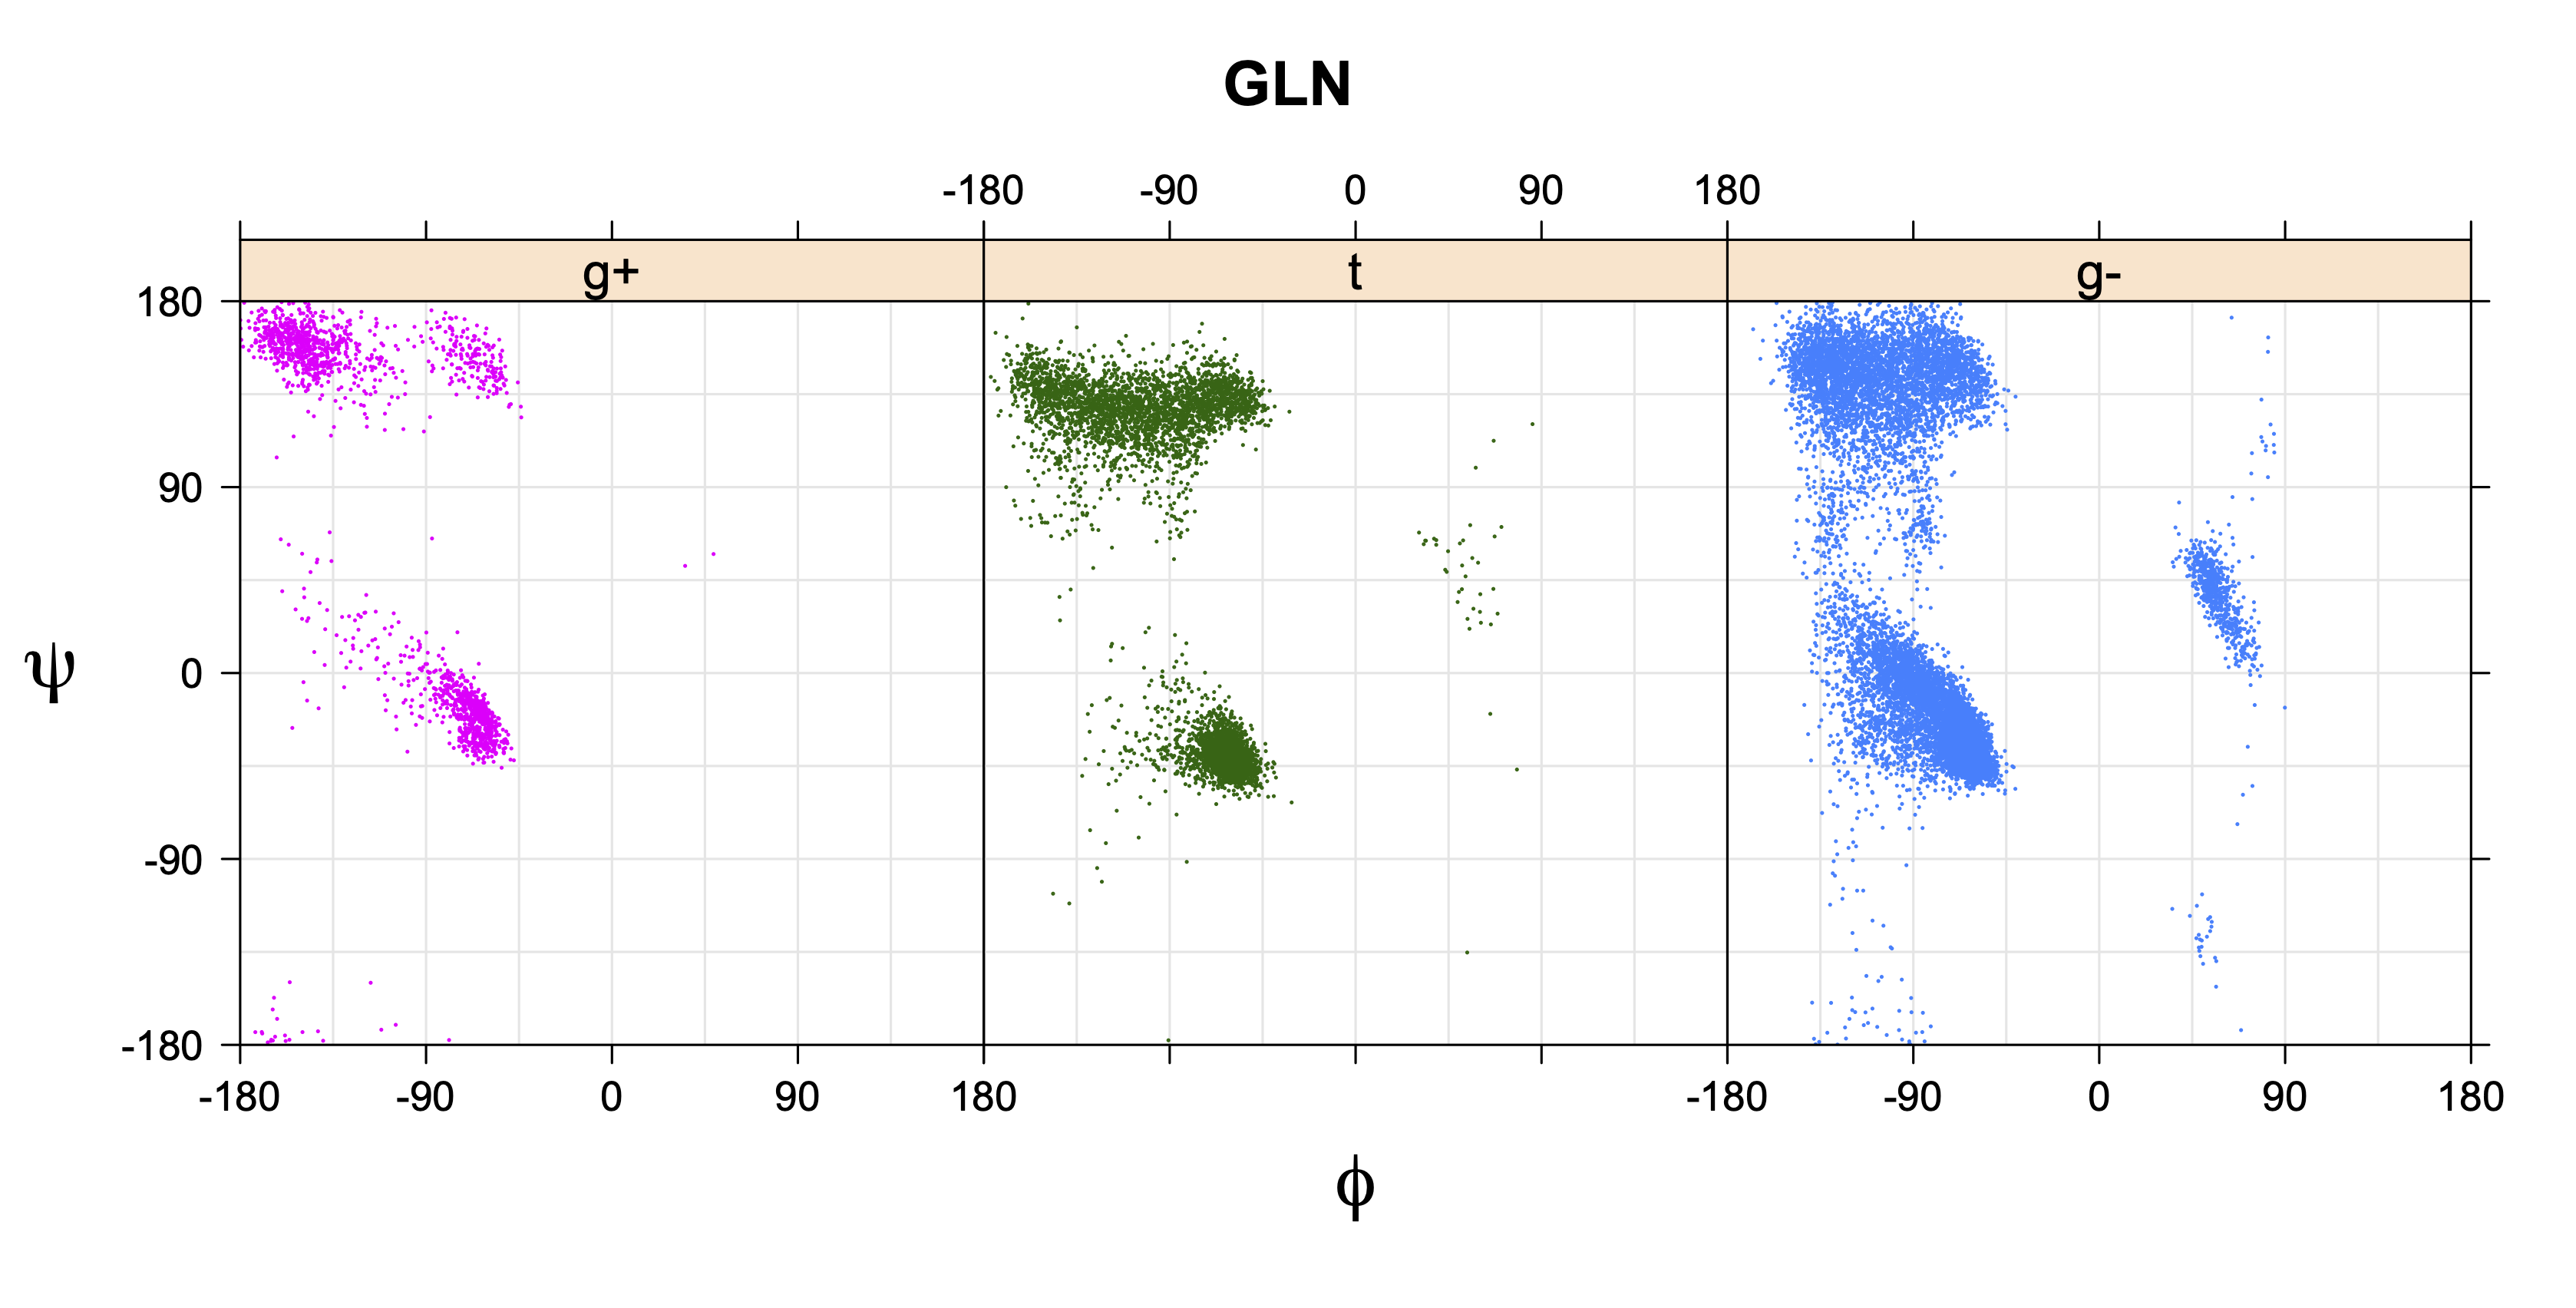
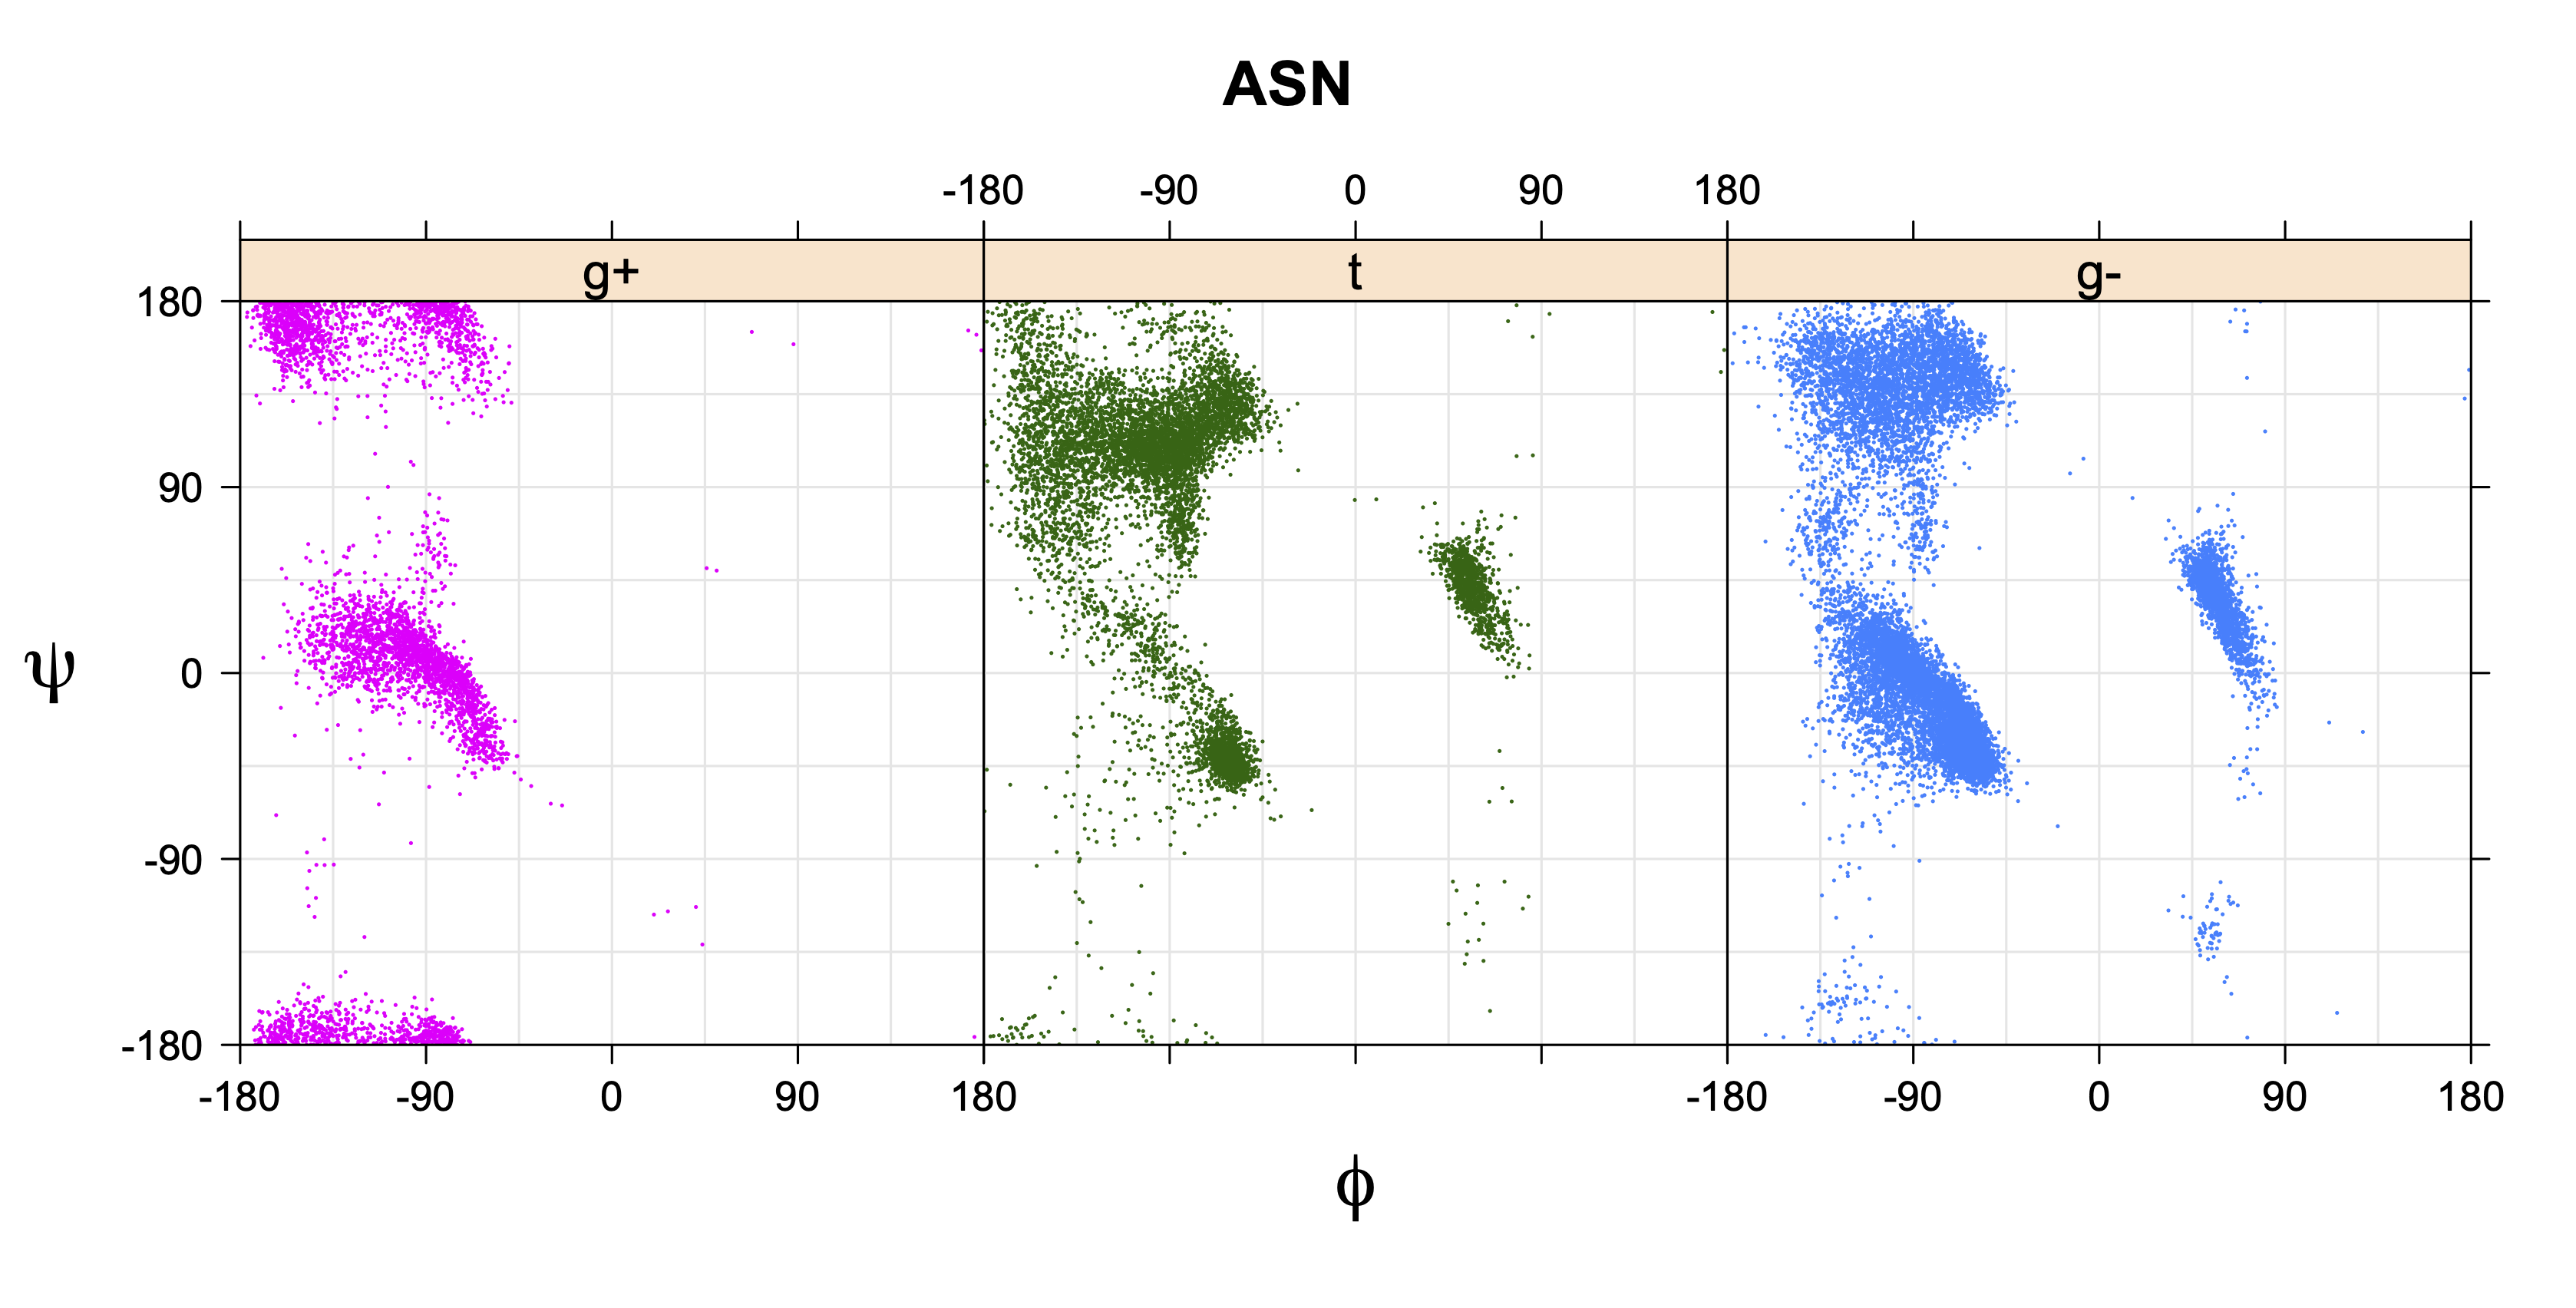
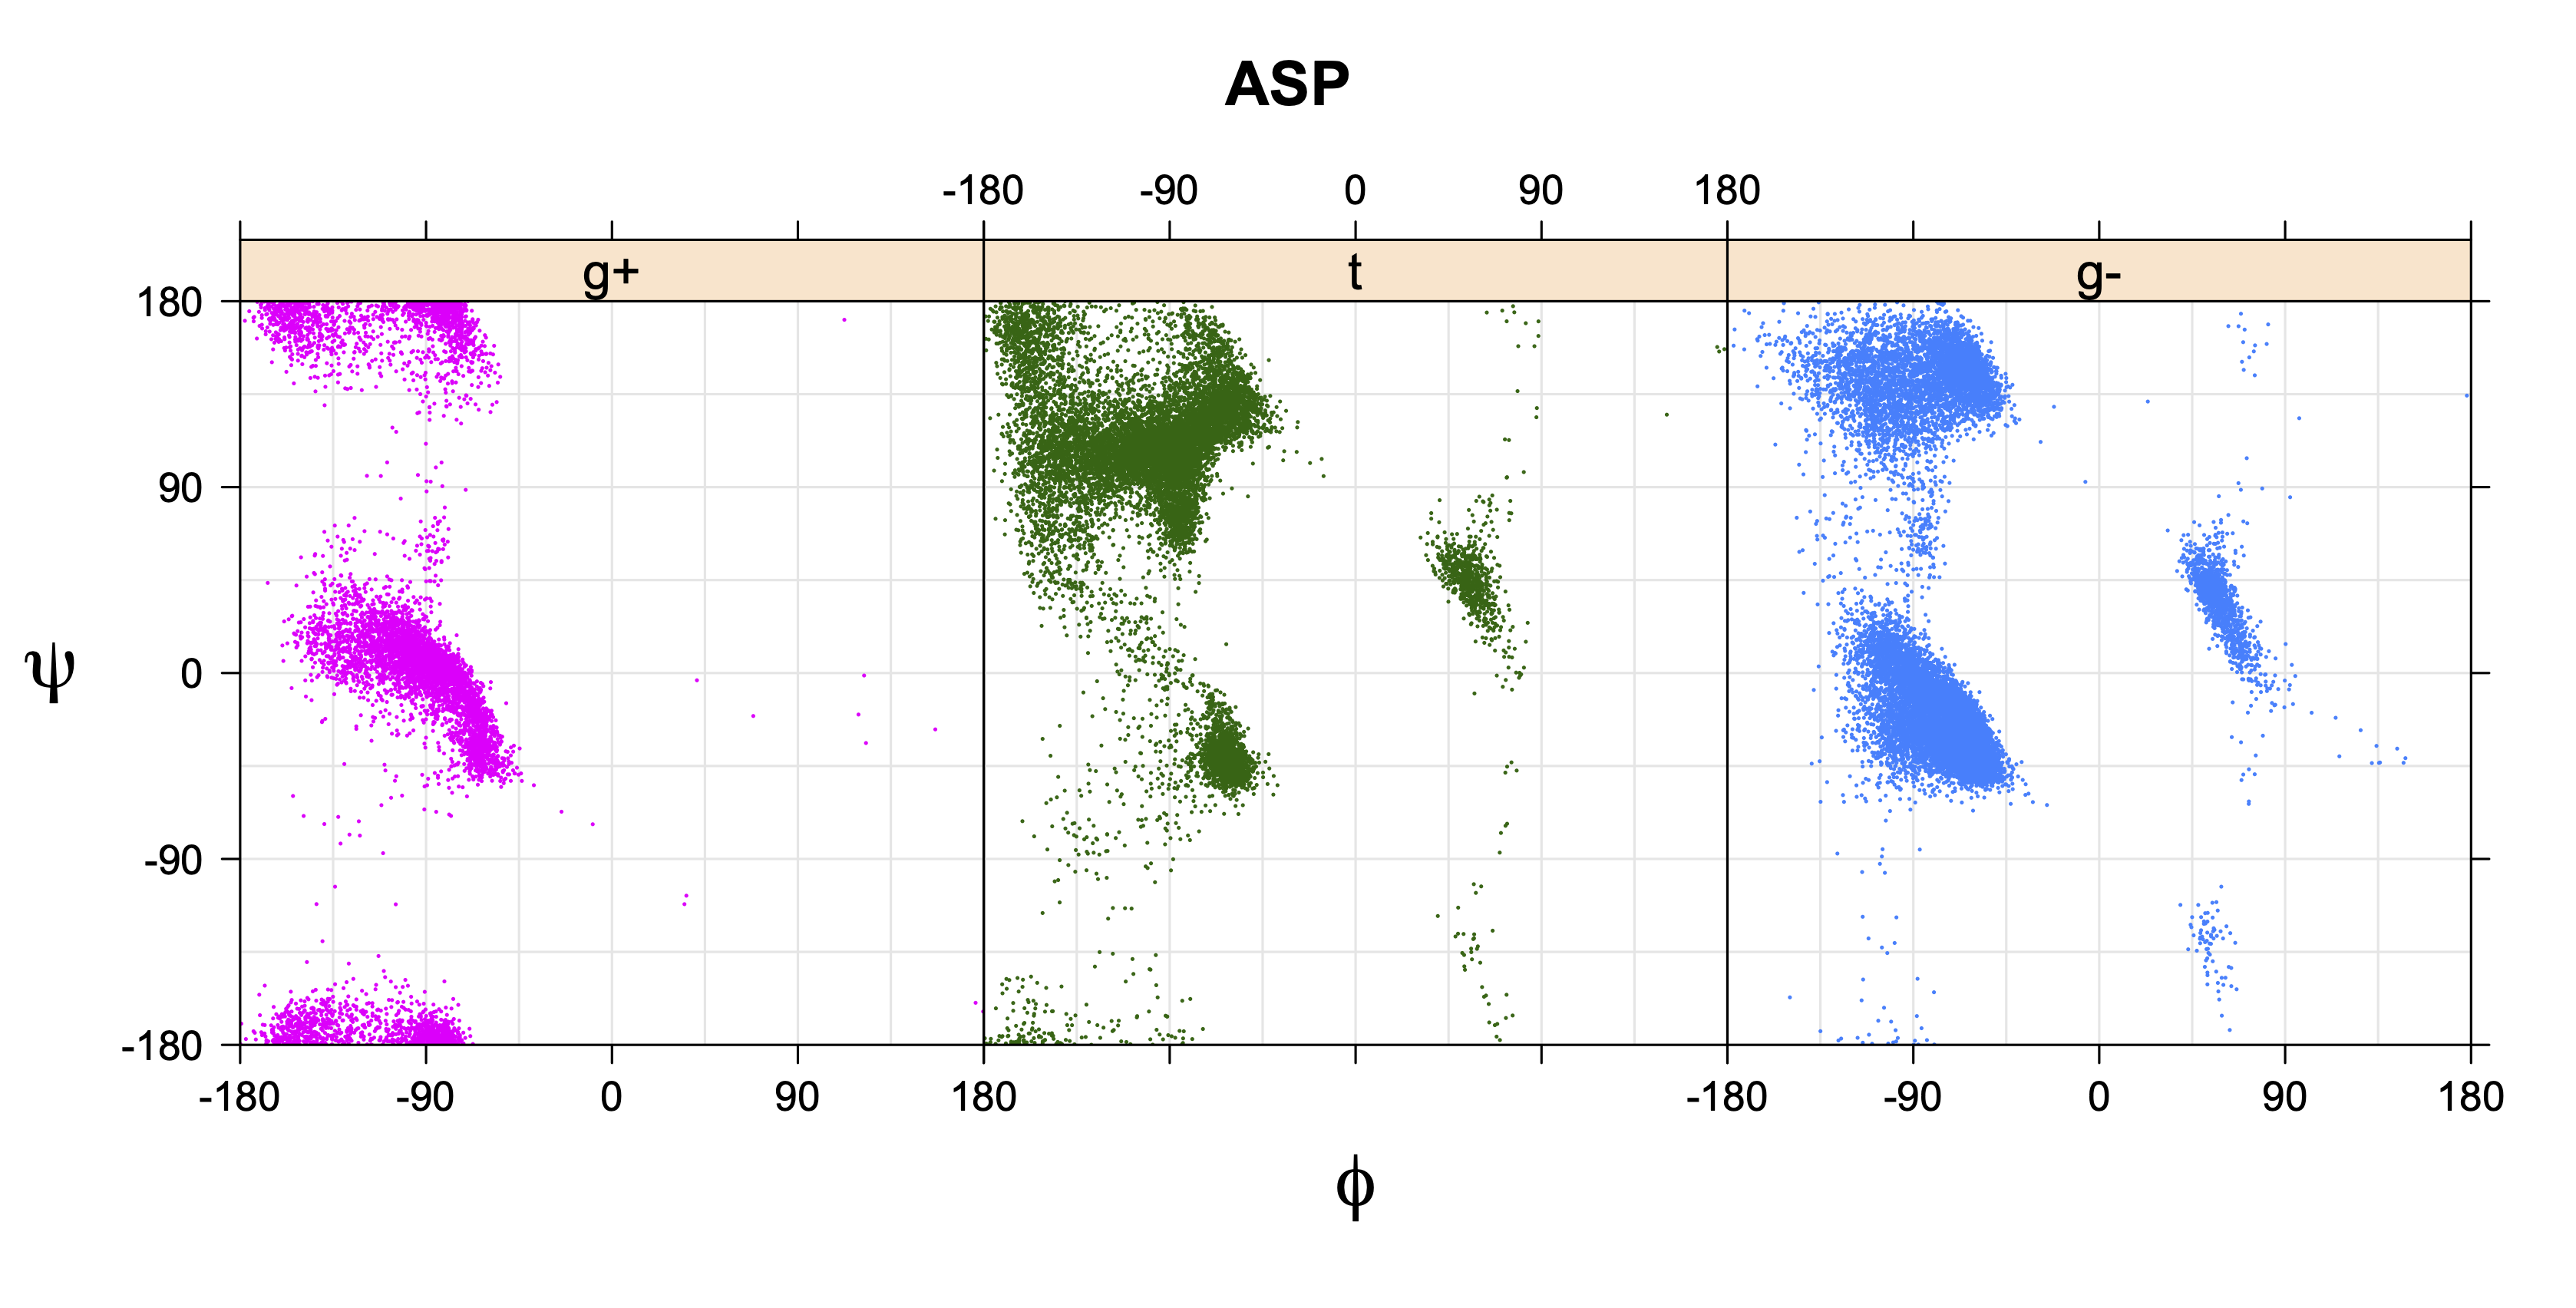
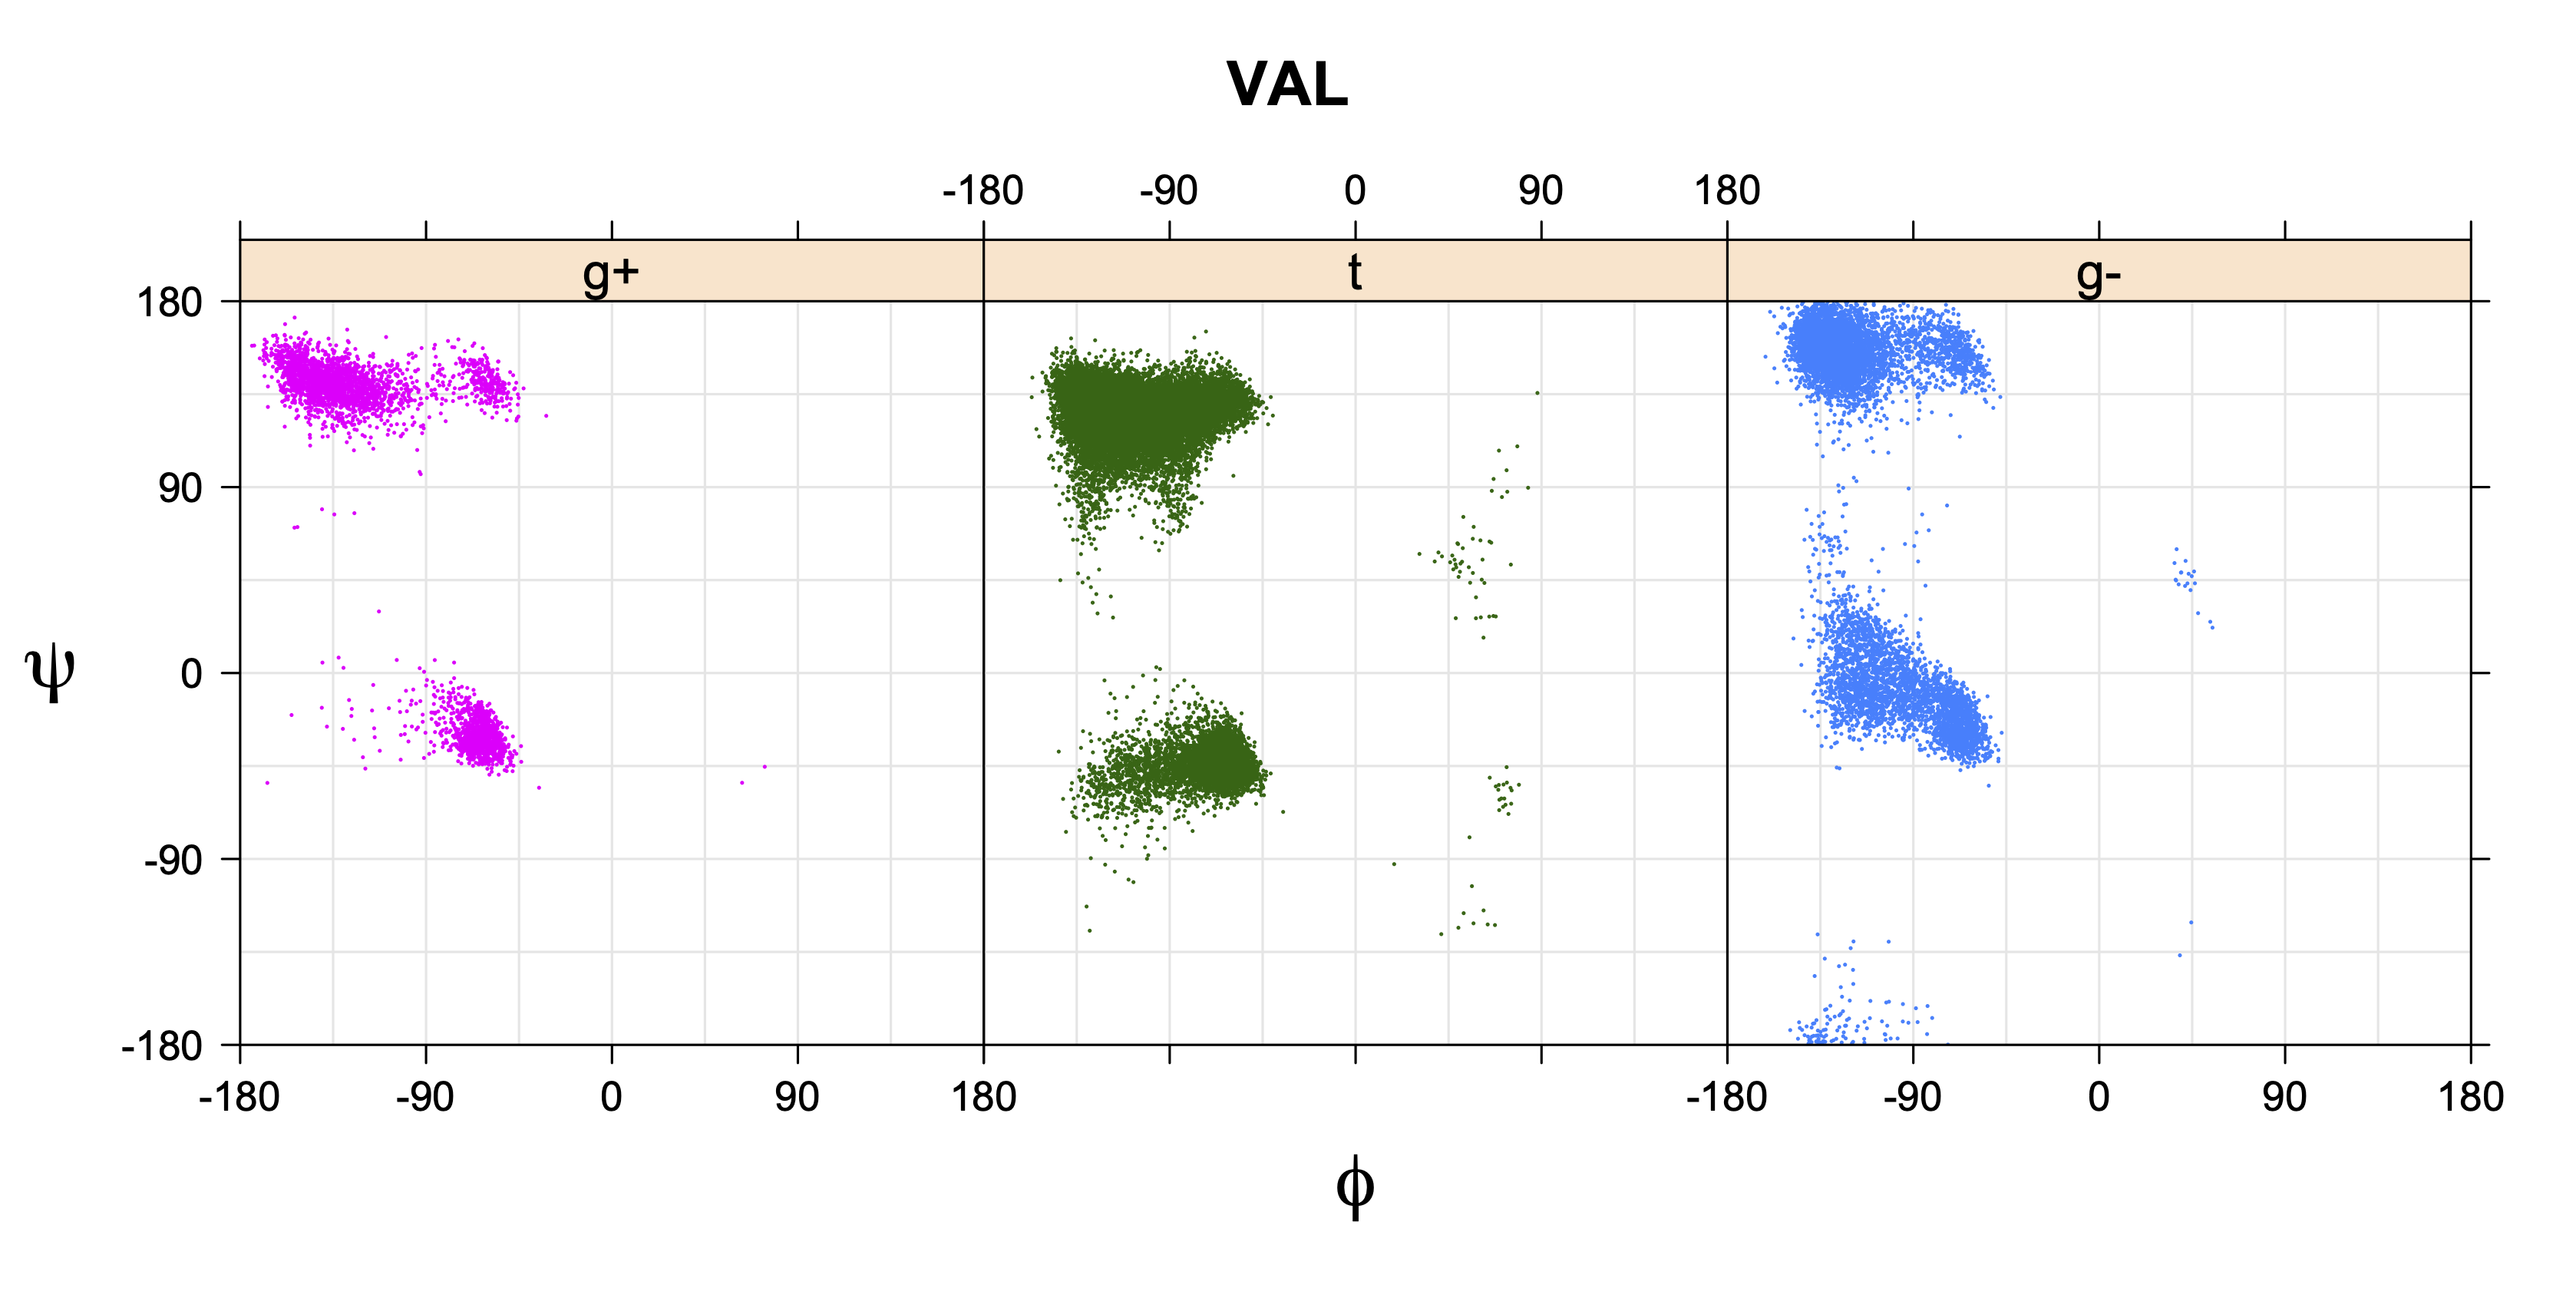
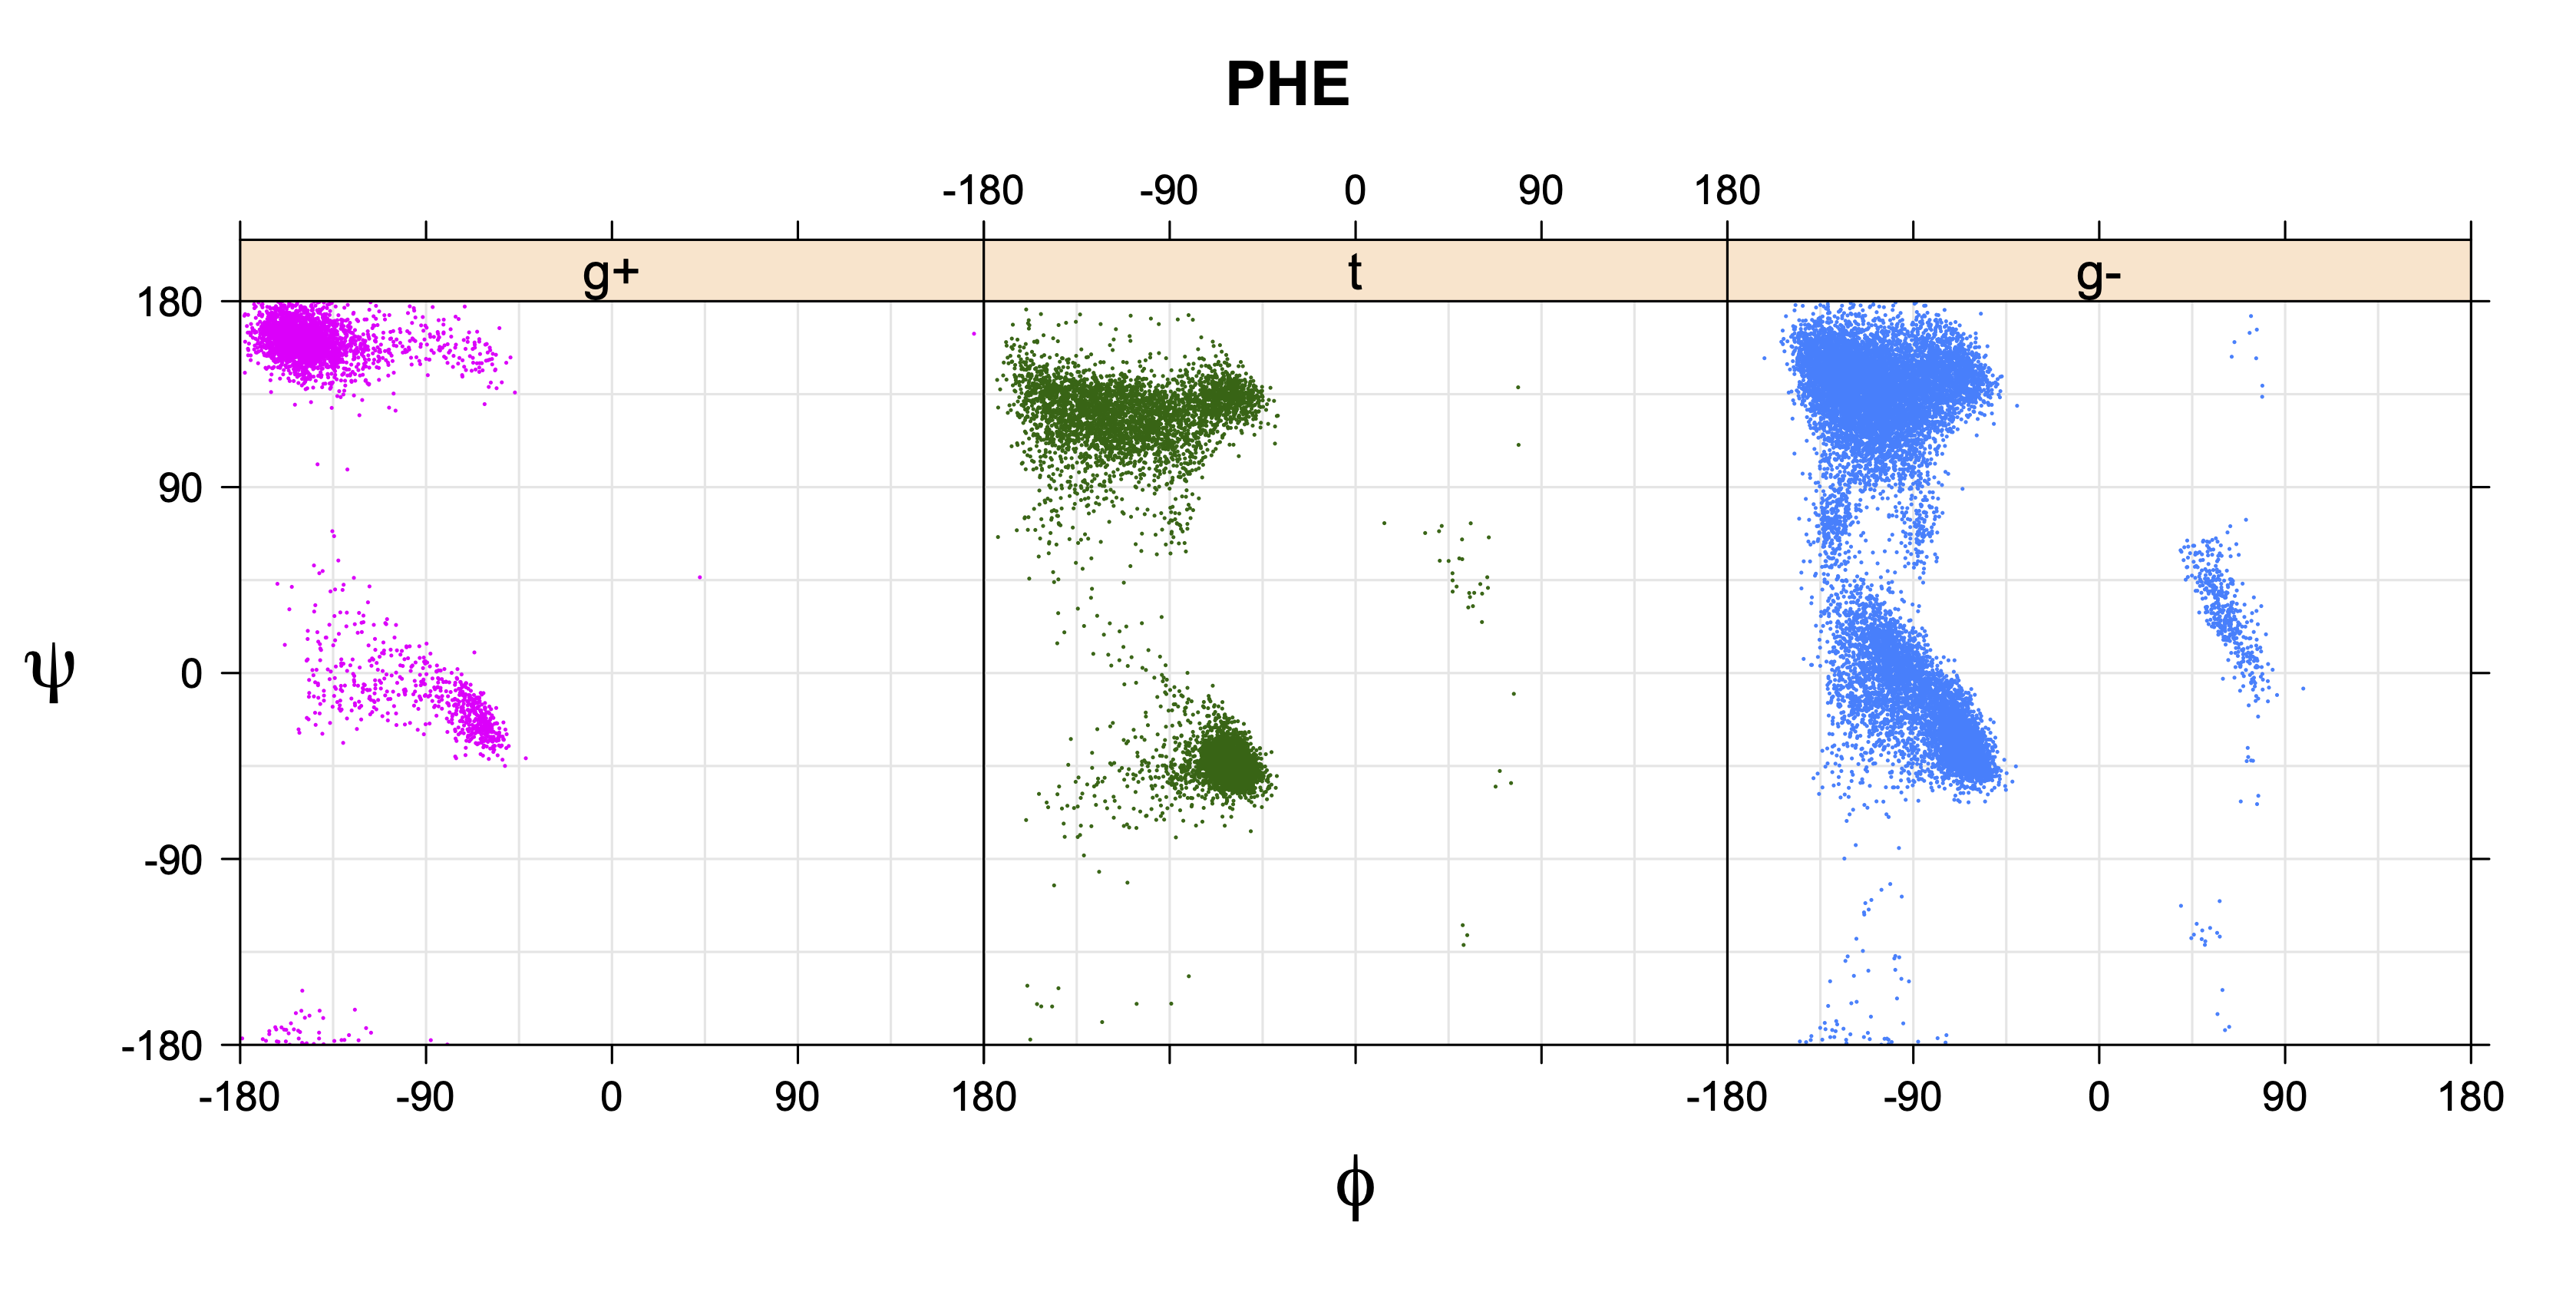
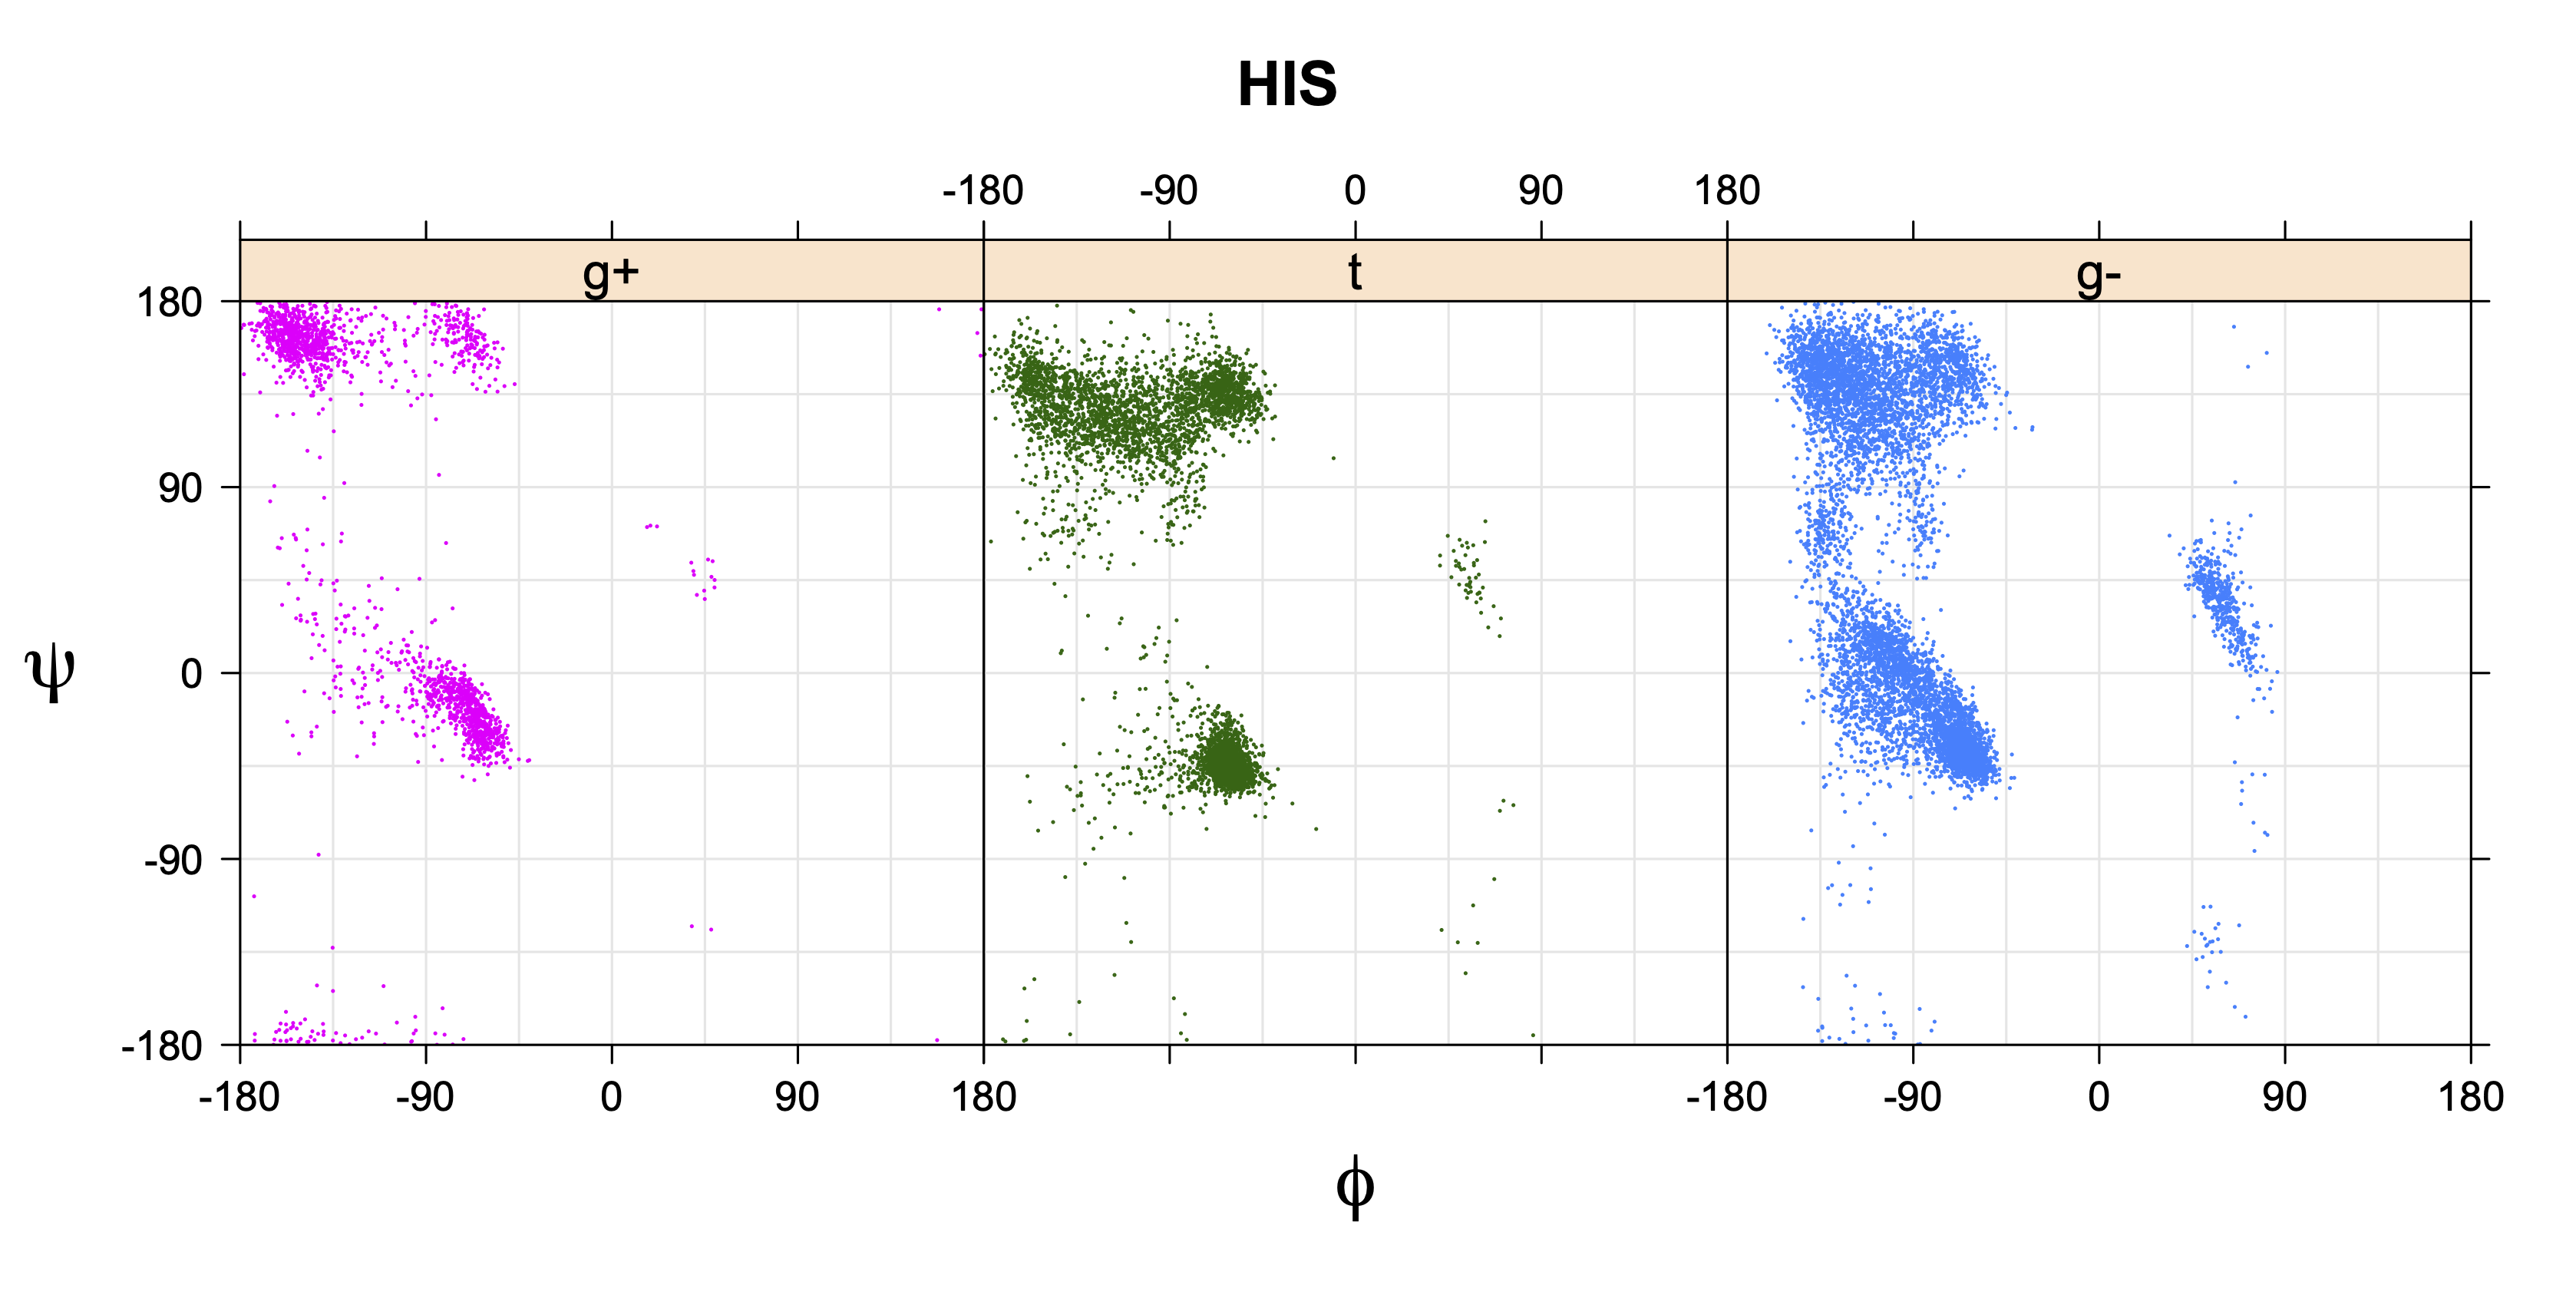
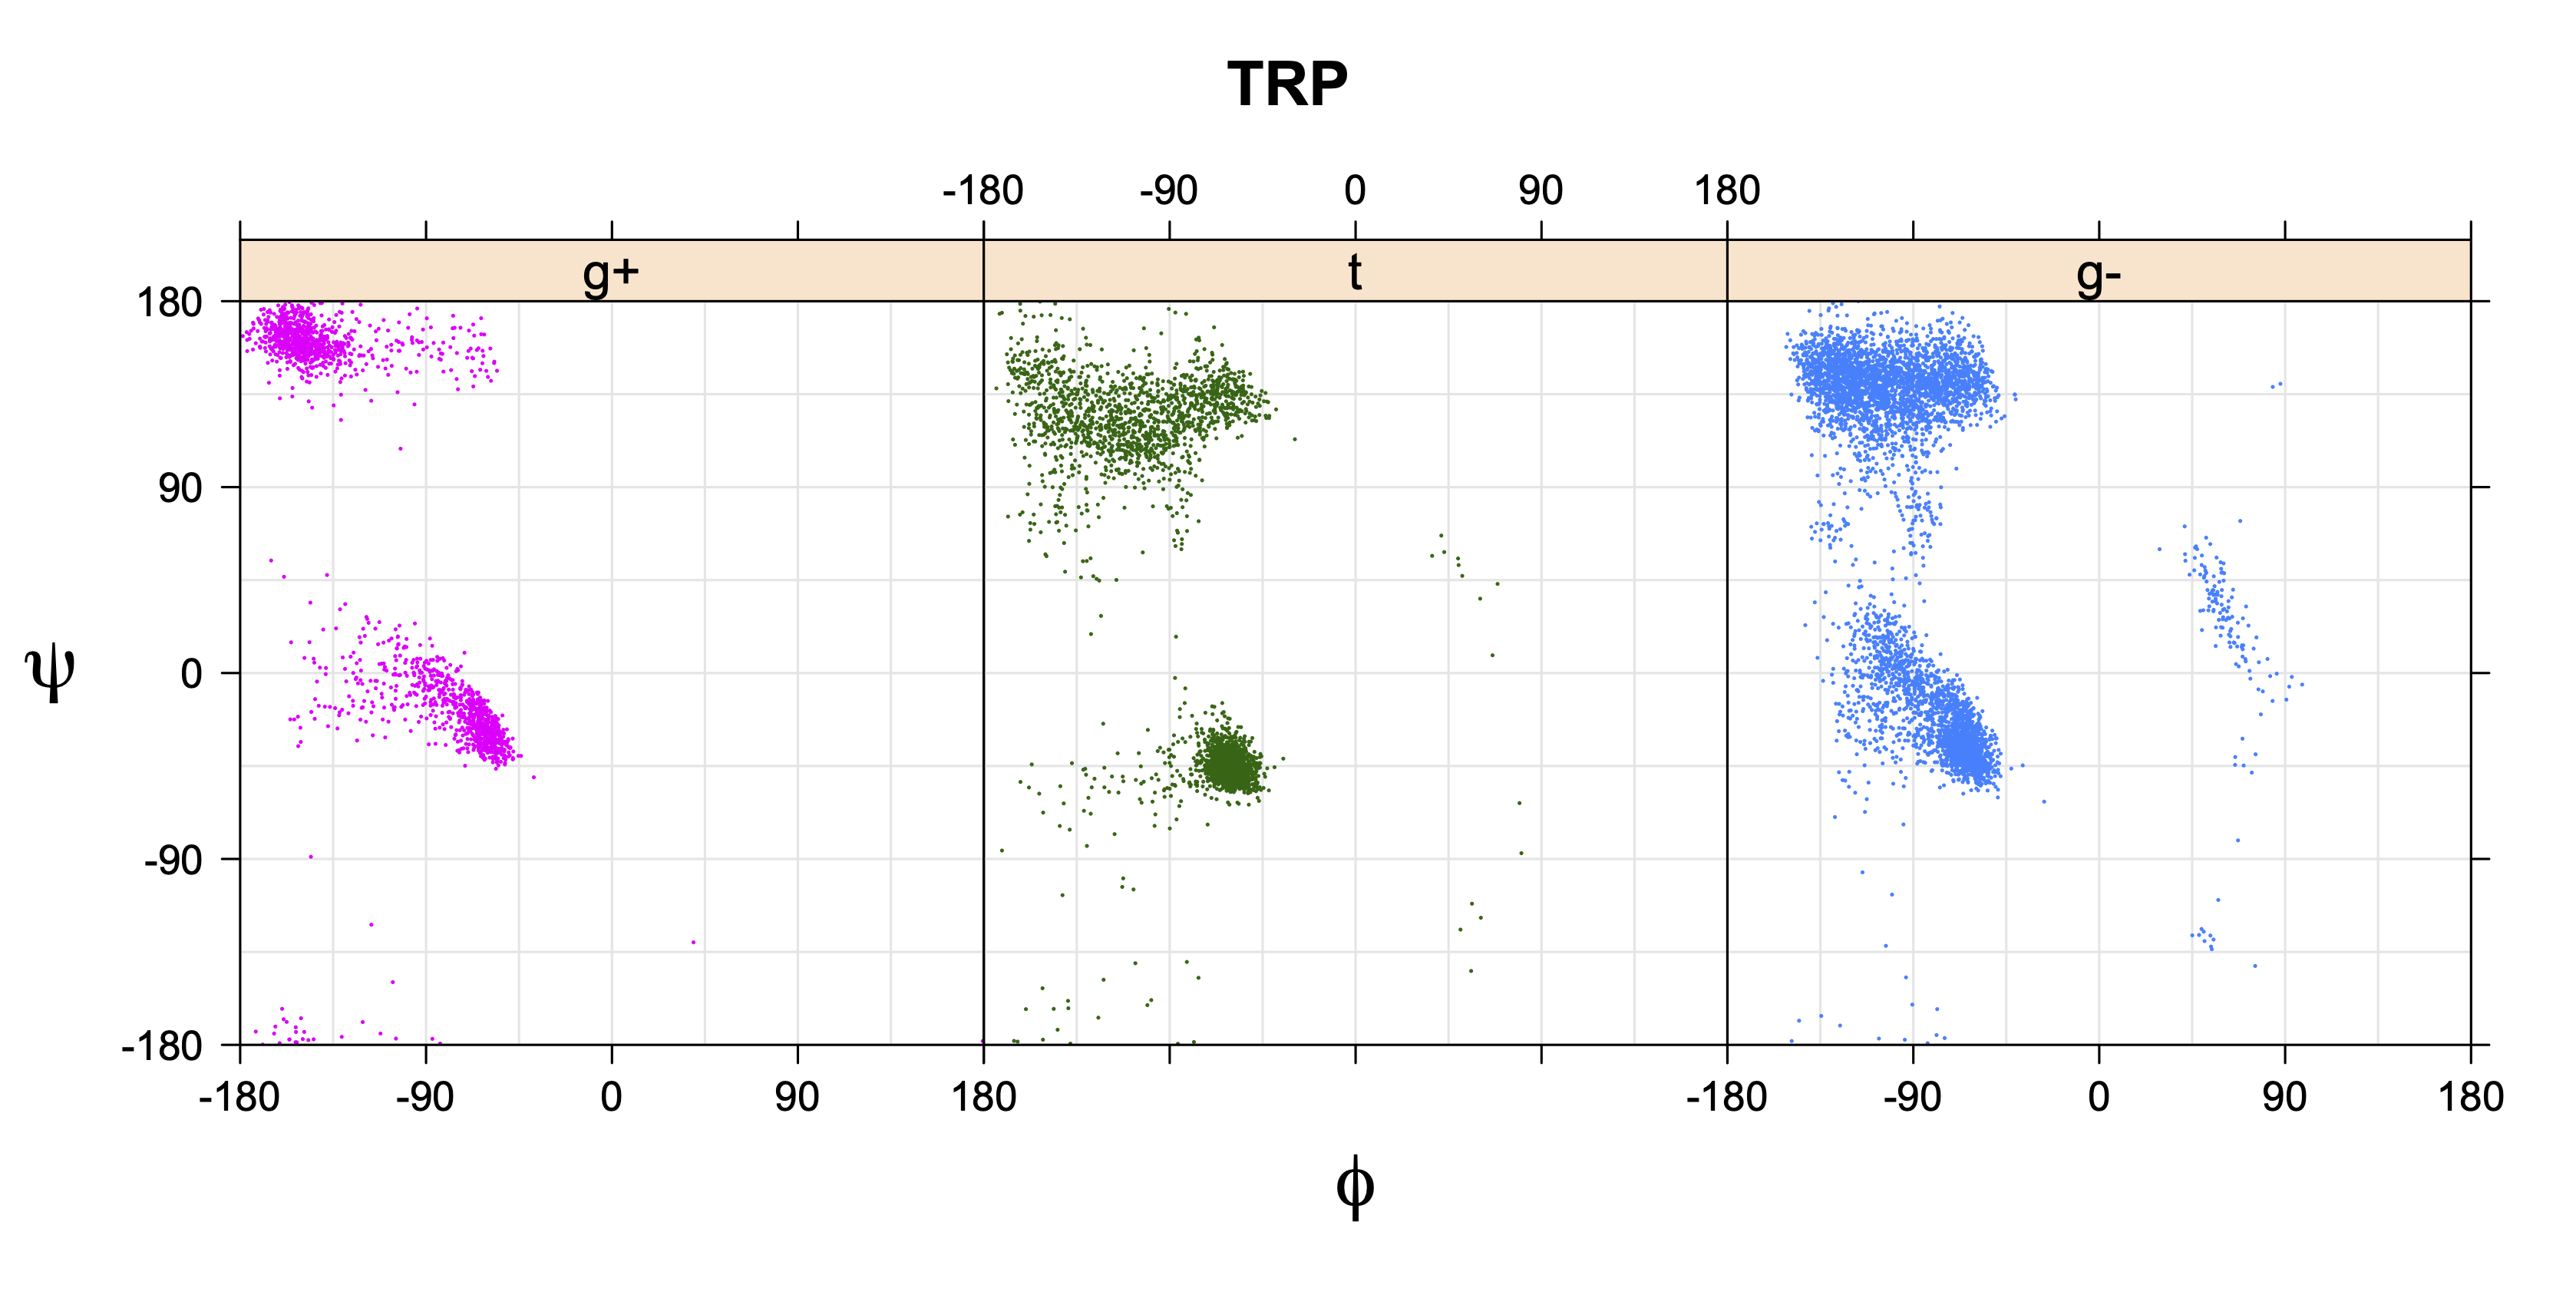
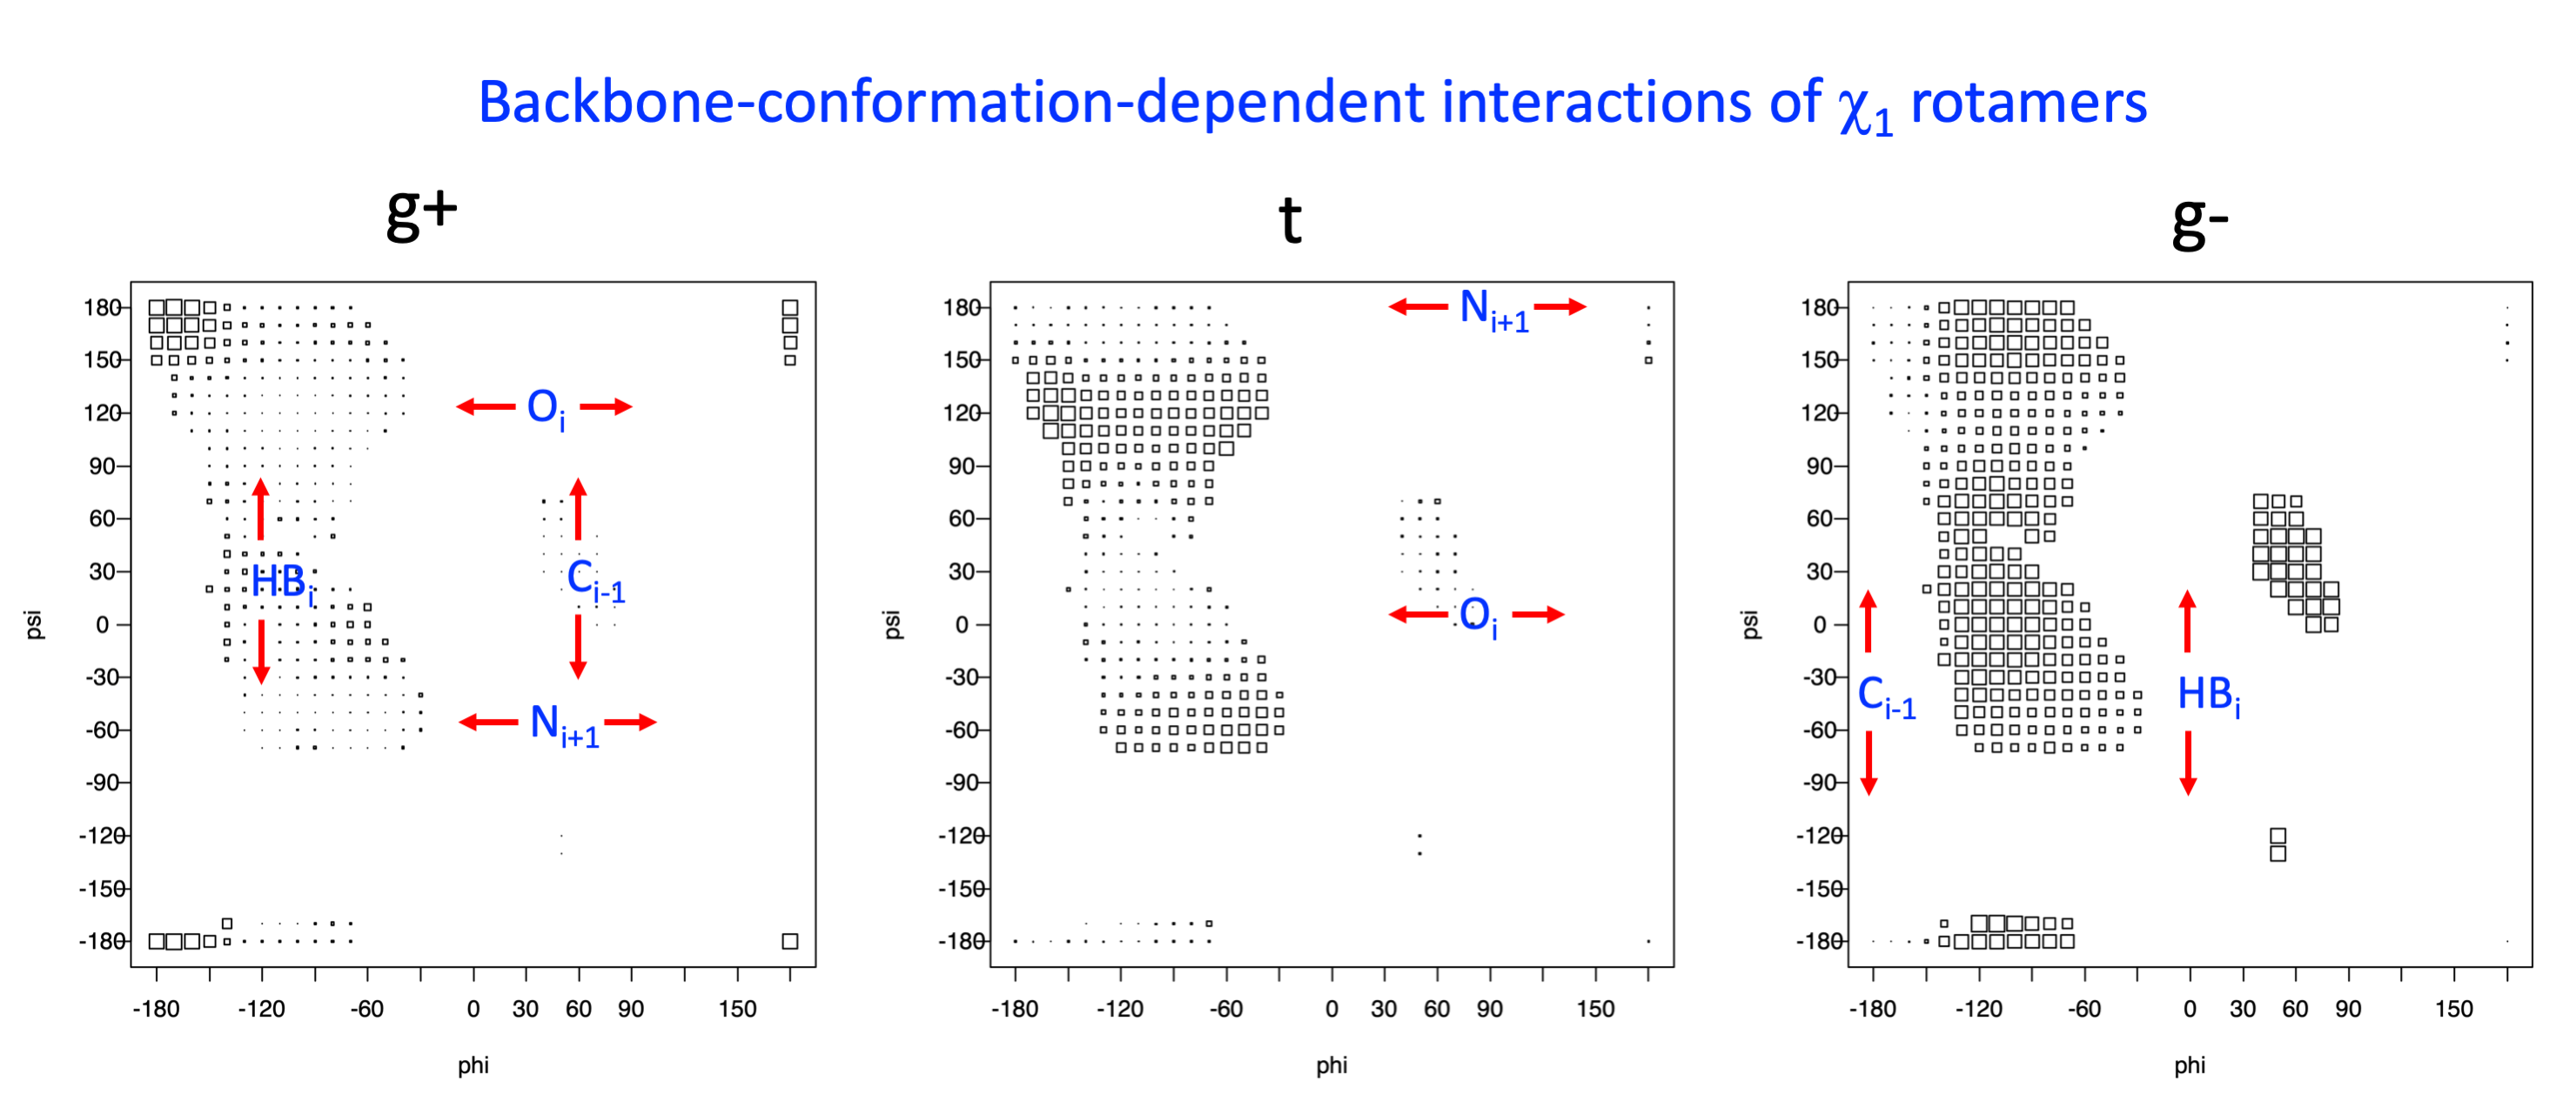
1. Ramachandran plots
Ramachandran plots for each of the three χ1 rotamers demonstrate how different their backbone conformational spaces are. It is easy to observe the strongest backbone-dependent effects that lower the population of some rotamers:
                                               g+ rotamer at ψ=  -60 and ψ=  +120
                                               t  rotamer at ψ=    0 and ψ=  +180

                                               g+ rotamer at φ= -120 and φ=   +60
                                               g- rotamer at φ= -180 and φ=     0
The residues with two gamma heavy atoms experience these steric hindrances for both the G1 and G2 heavy atoms.
                                               VAL g+ rotamer =     CG1 at g+, CG2 at t  -->    ψ= -60  120    0  180   φ=  -120  +60
                                               VAL t  rotamer =     CG1 at t,  CG2 at g- -->    ψ=   0  180             φ=  -180    0
                                               VAL g- rotamer =     CG1 at g-, CG2 at g+ -->    ψ= -60  120             φ=  -120  +60   -180   0

                                               THR g+ rotamer =     OG1 at g+, CG2 at g- -->    ψ= -60  120             φ=  -120  +60   -180   0
                                               THR t  rotamer =     OG1 at t,  CG2 at g+ -->    ψ=   0  180  -60  120   φ=  -120  +60
                                               THR g- rotamer =     OG1 at g-, CG2 at t  -->    ψ=   0  180             φ=  -180    0

                                               ILE g+ rotamer =     OG1 at g+, CG2 at g- -->    ψ= -60  120             φ=  -120  +60   -180   0
                                               ILE t  rotamer =     OG1 at t,  CG2 at g+ -->    ψ=   0  180  -60  120   φ=  -120  +60
                                               ILE g- rotamer =     OG1 at g-, CG2 at t  -->    ψ=   0  180             φ=  -180    0
Example: Ramachandran populations are lower where expected as marked with red arrows. The atom interacting with the XG atom is shown in blue type.


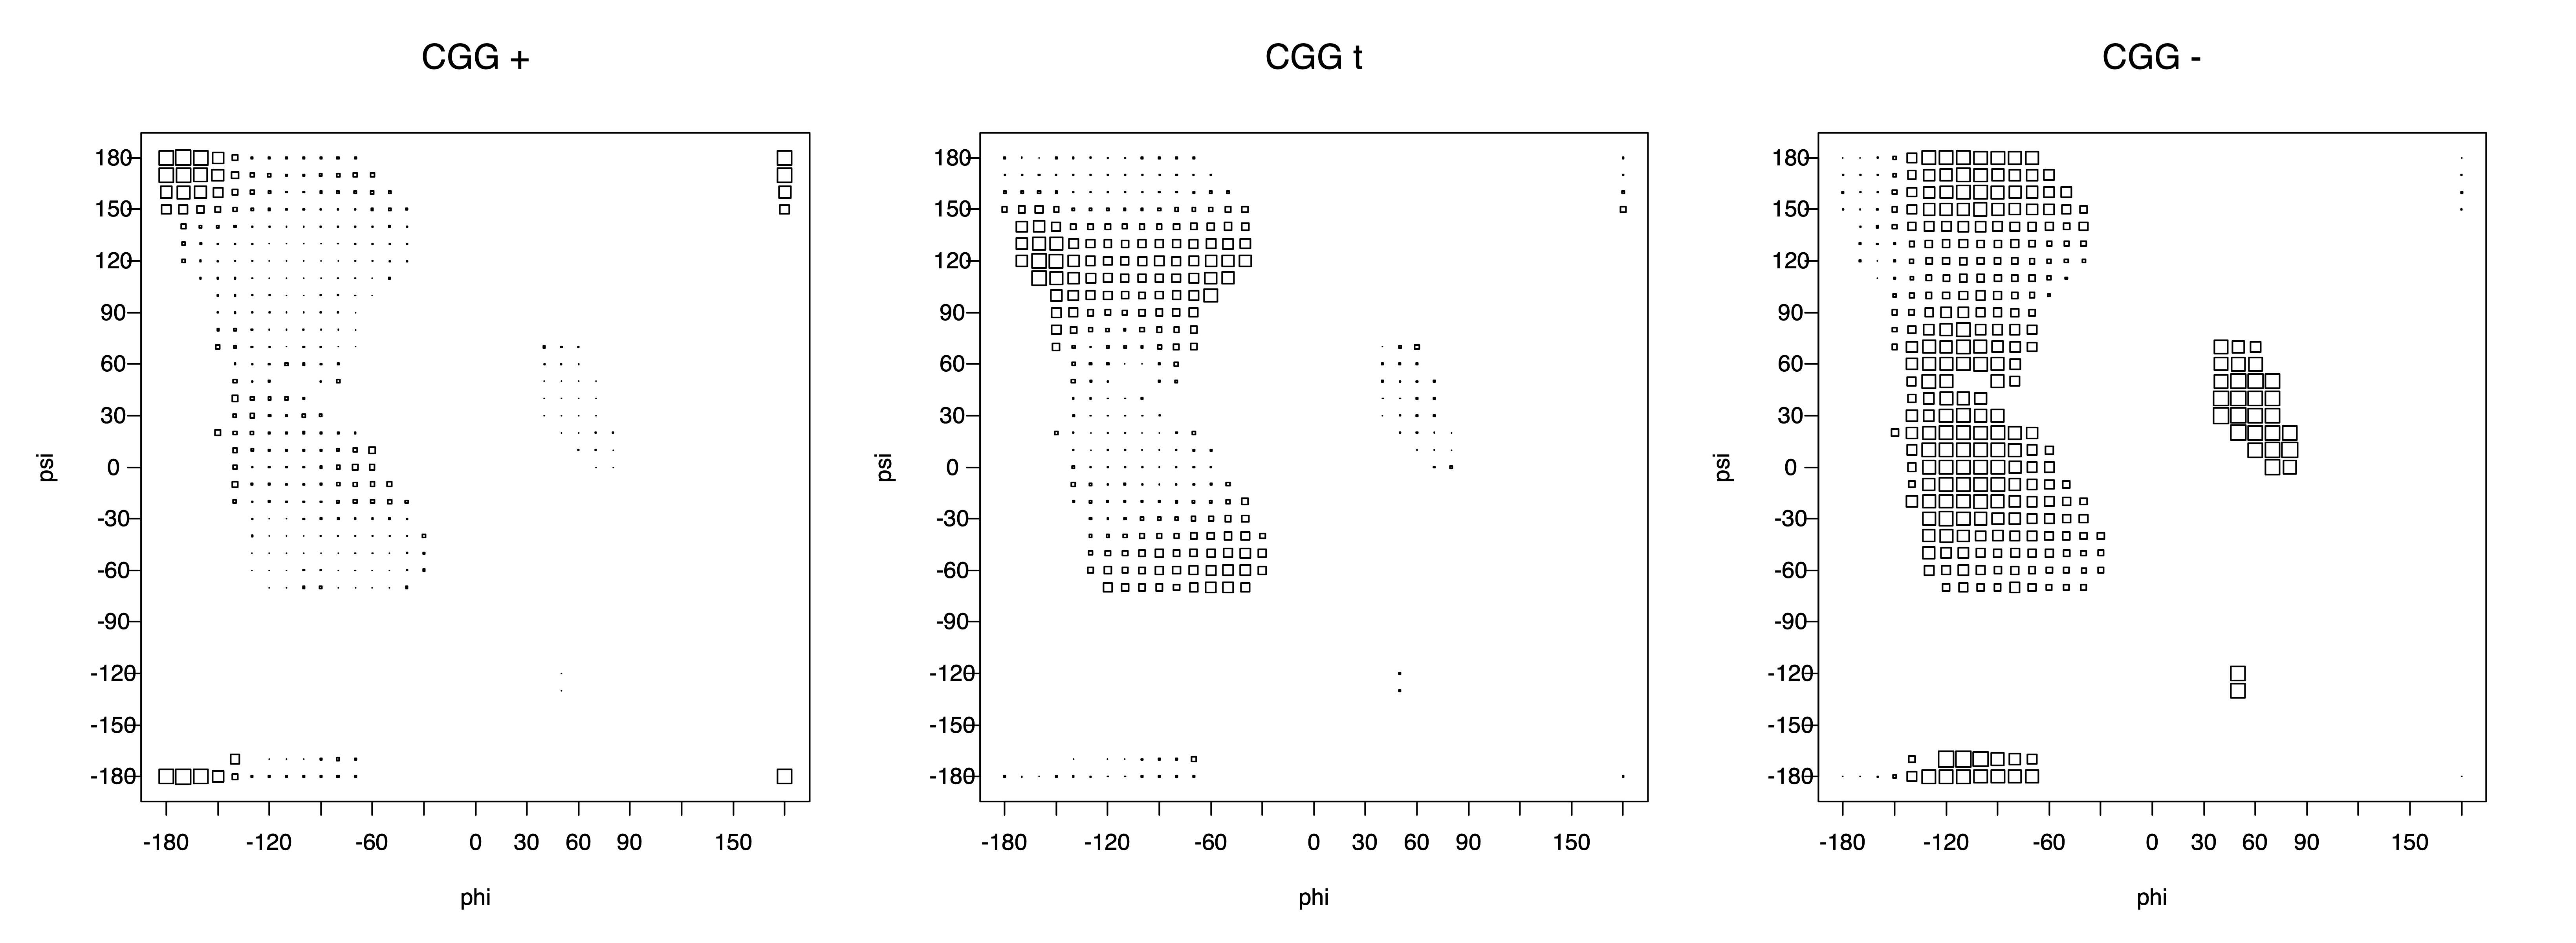
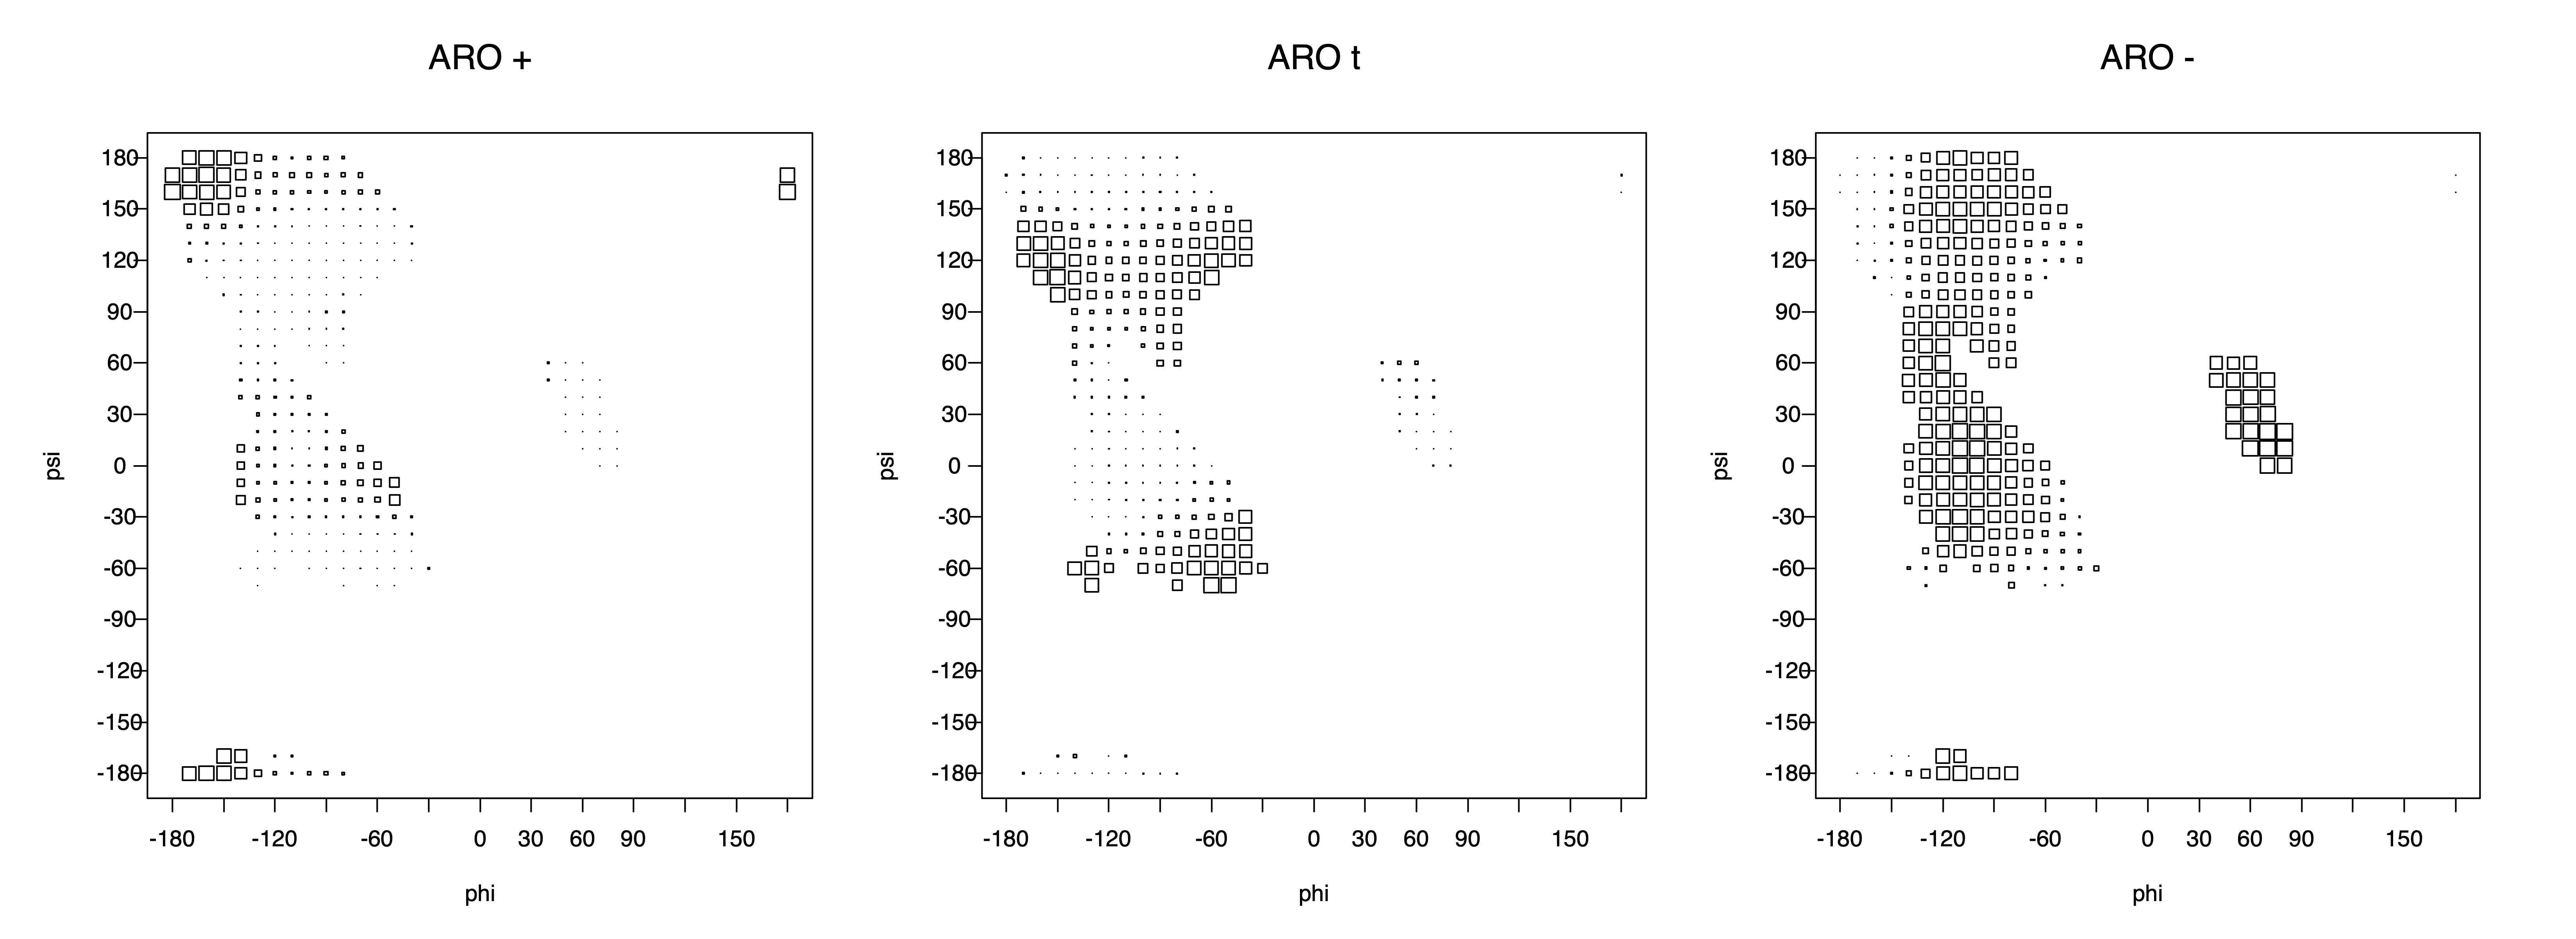
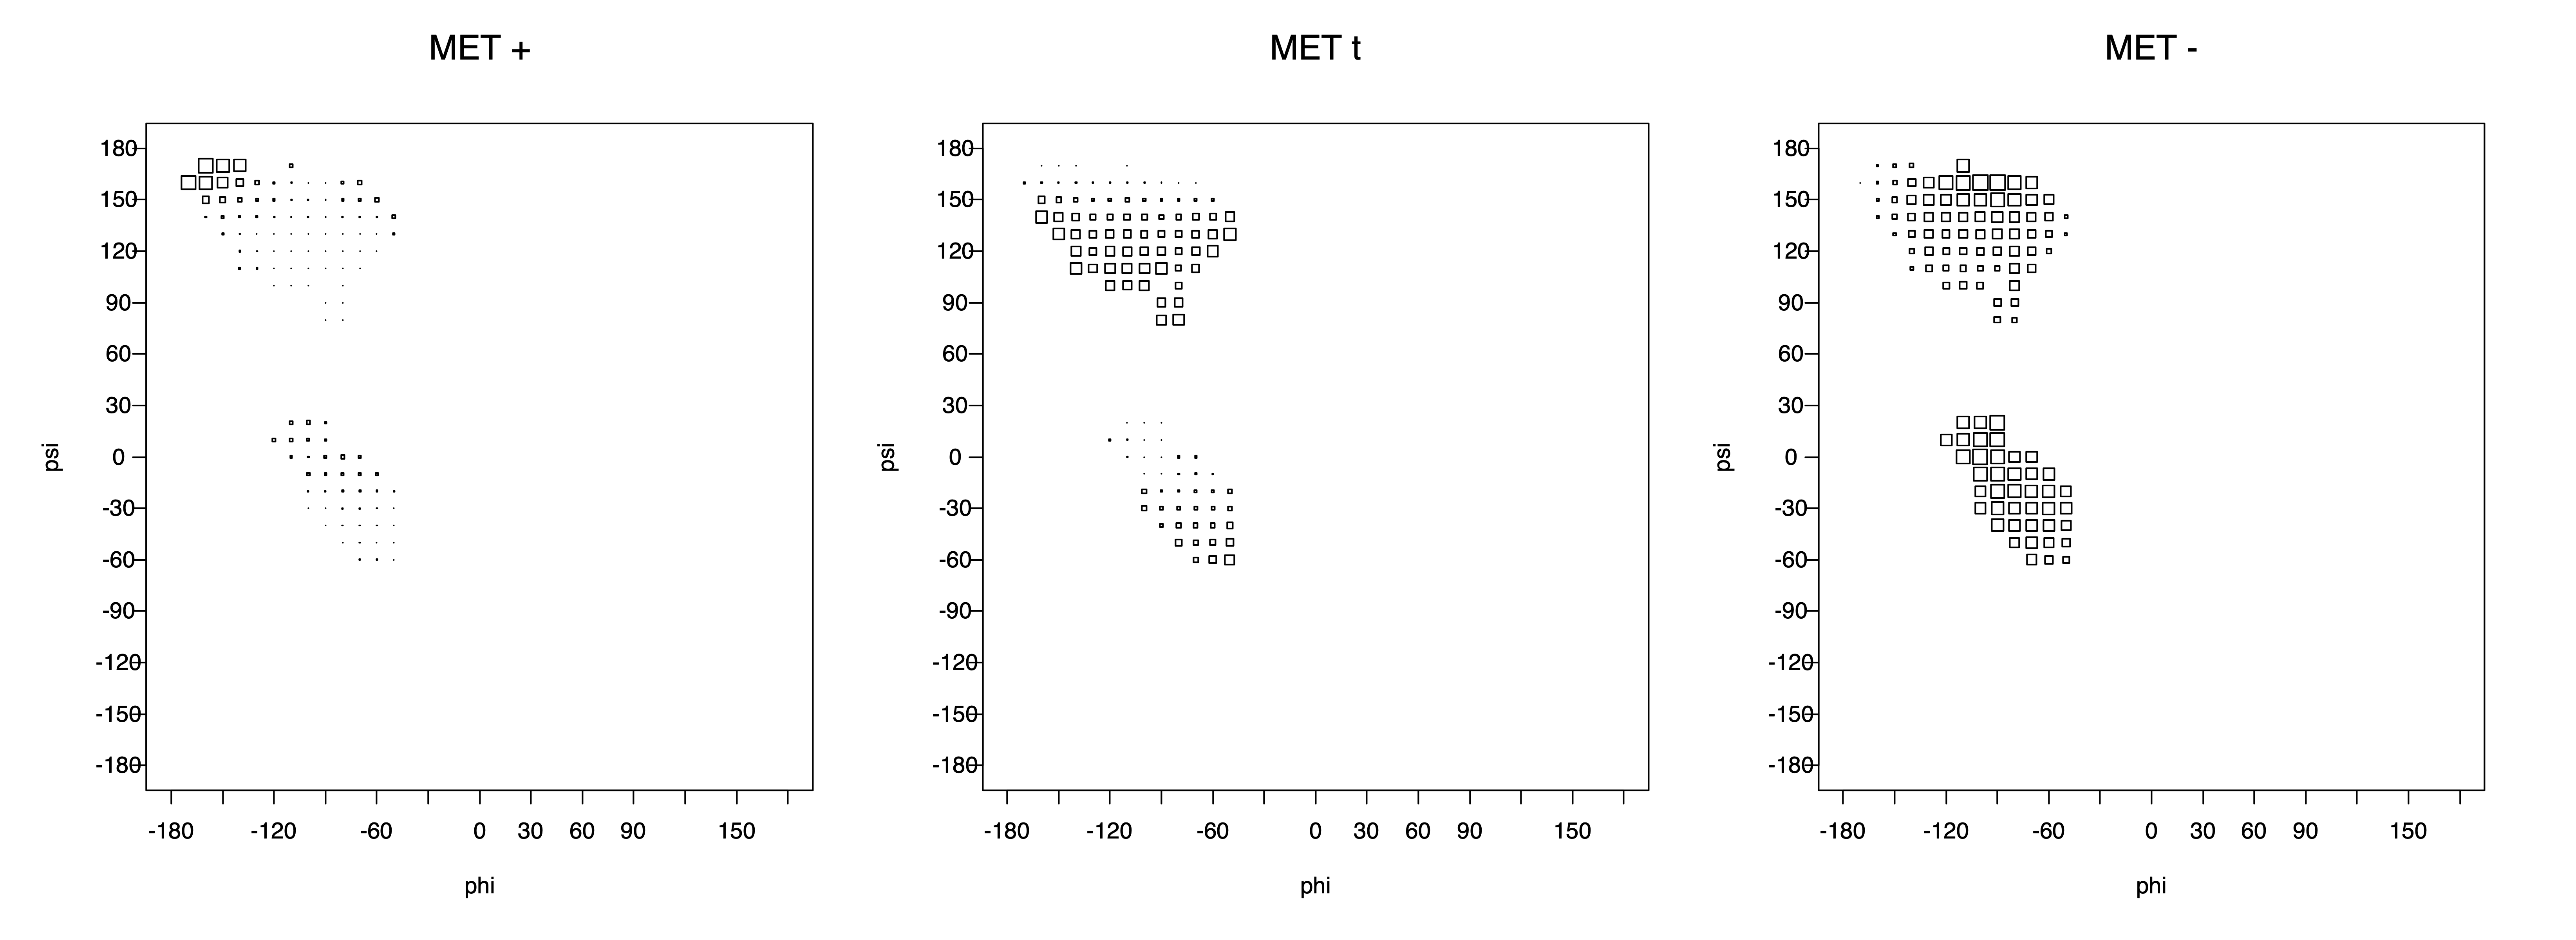
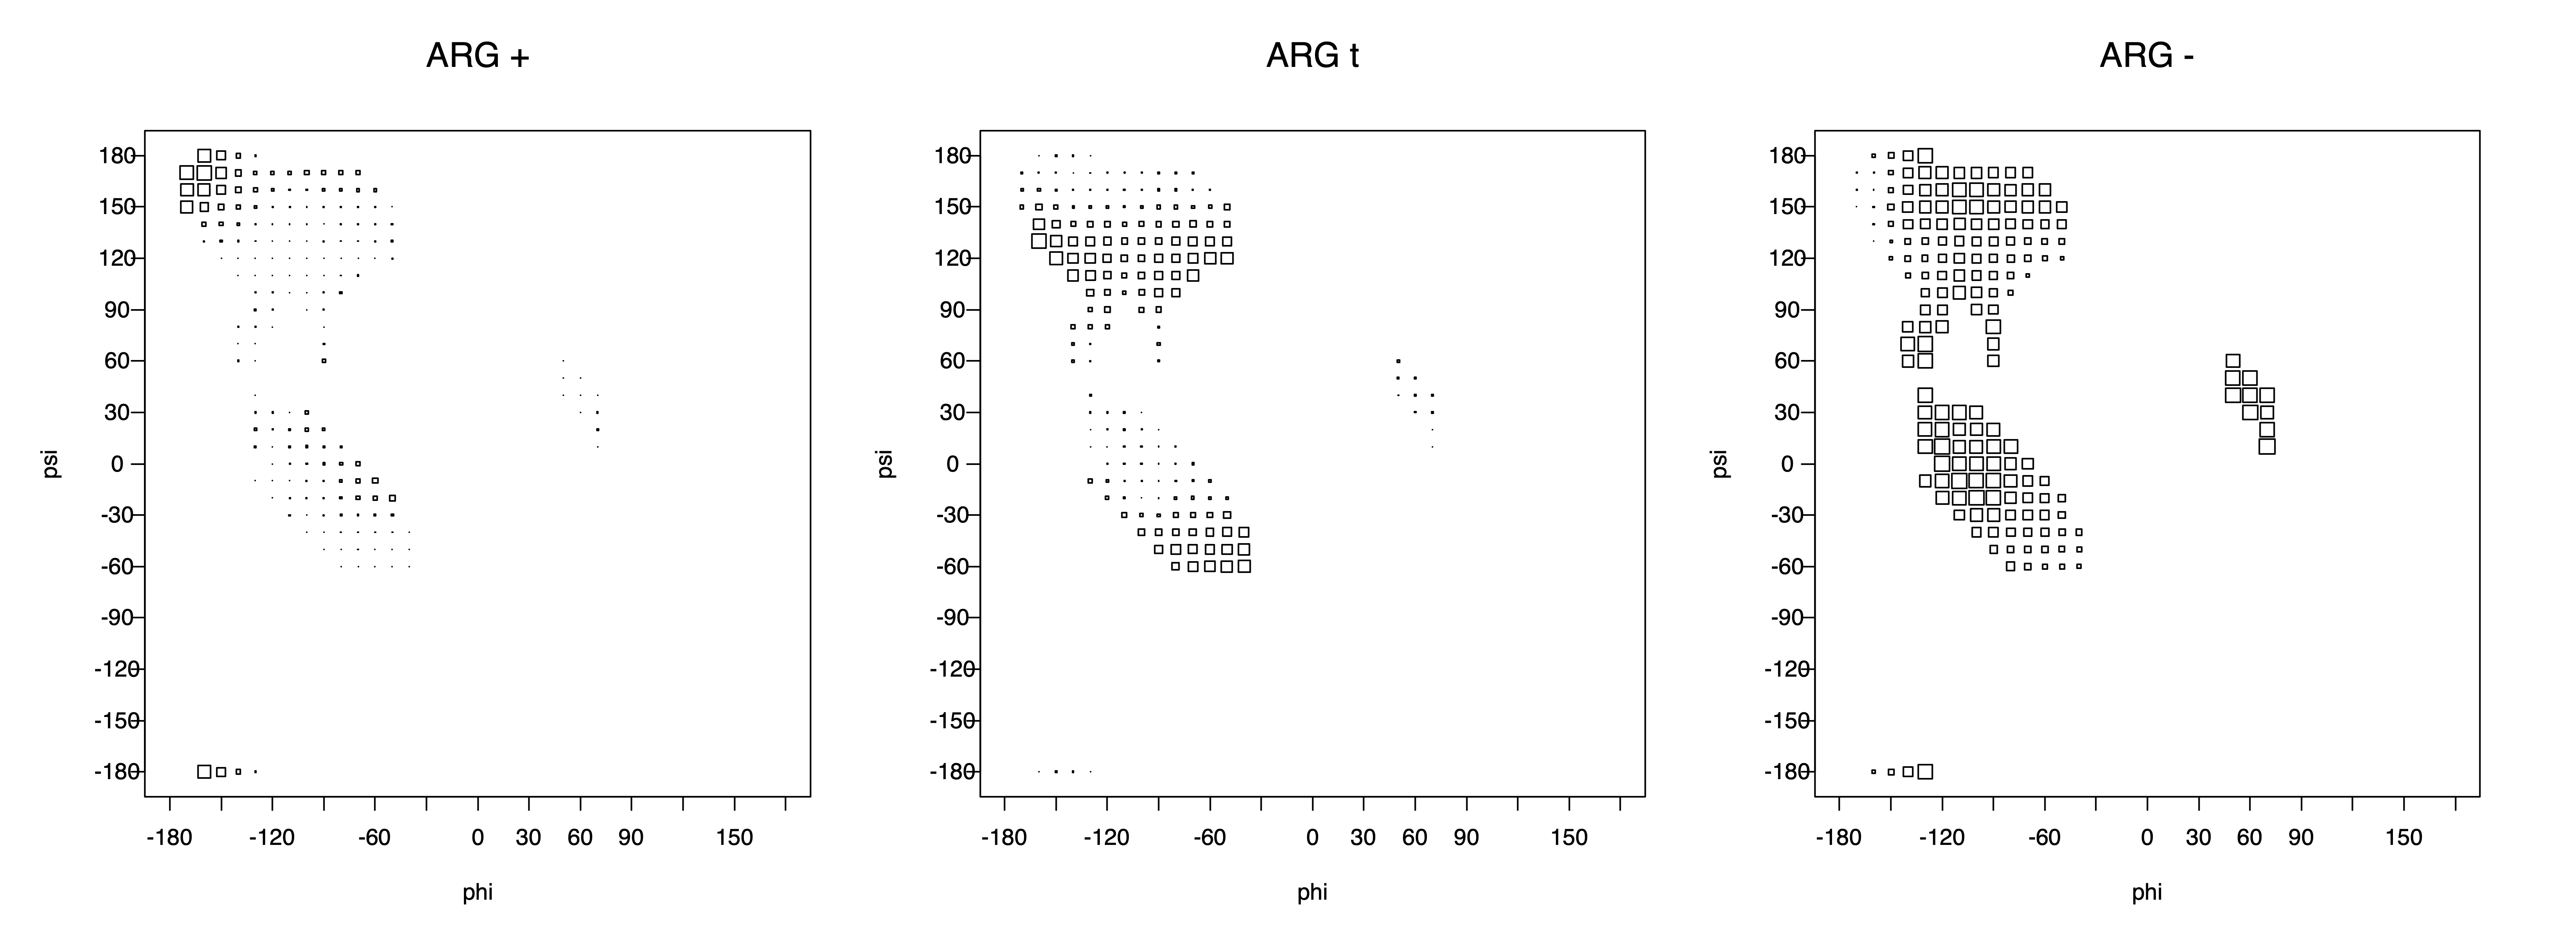
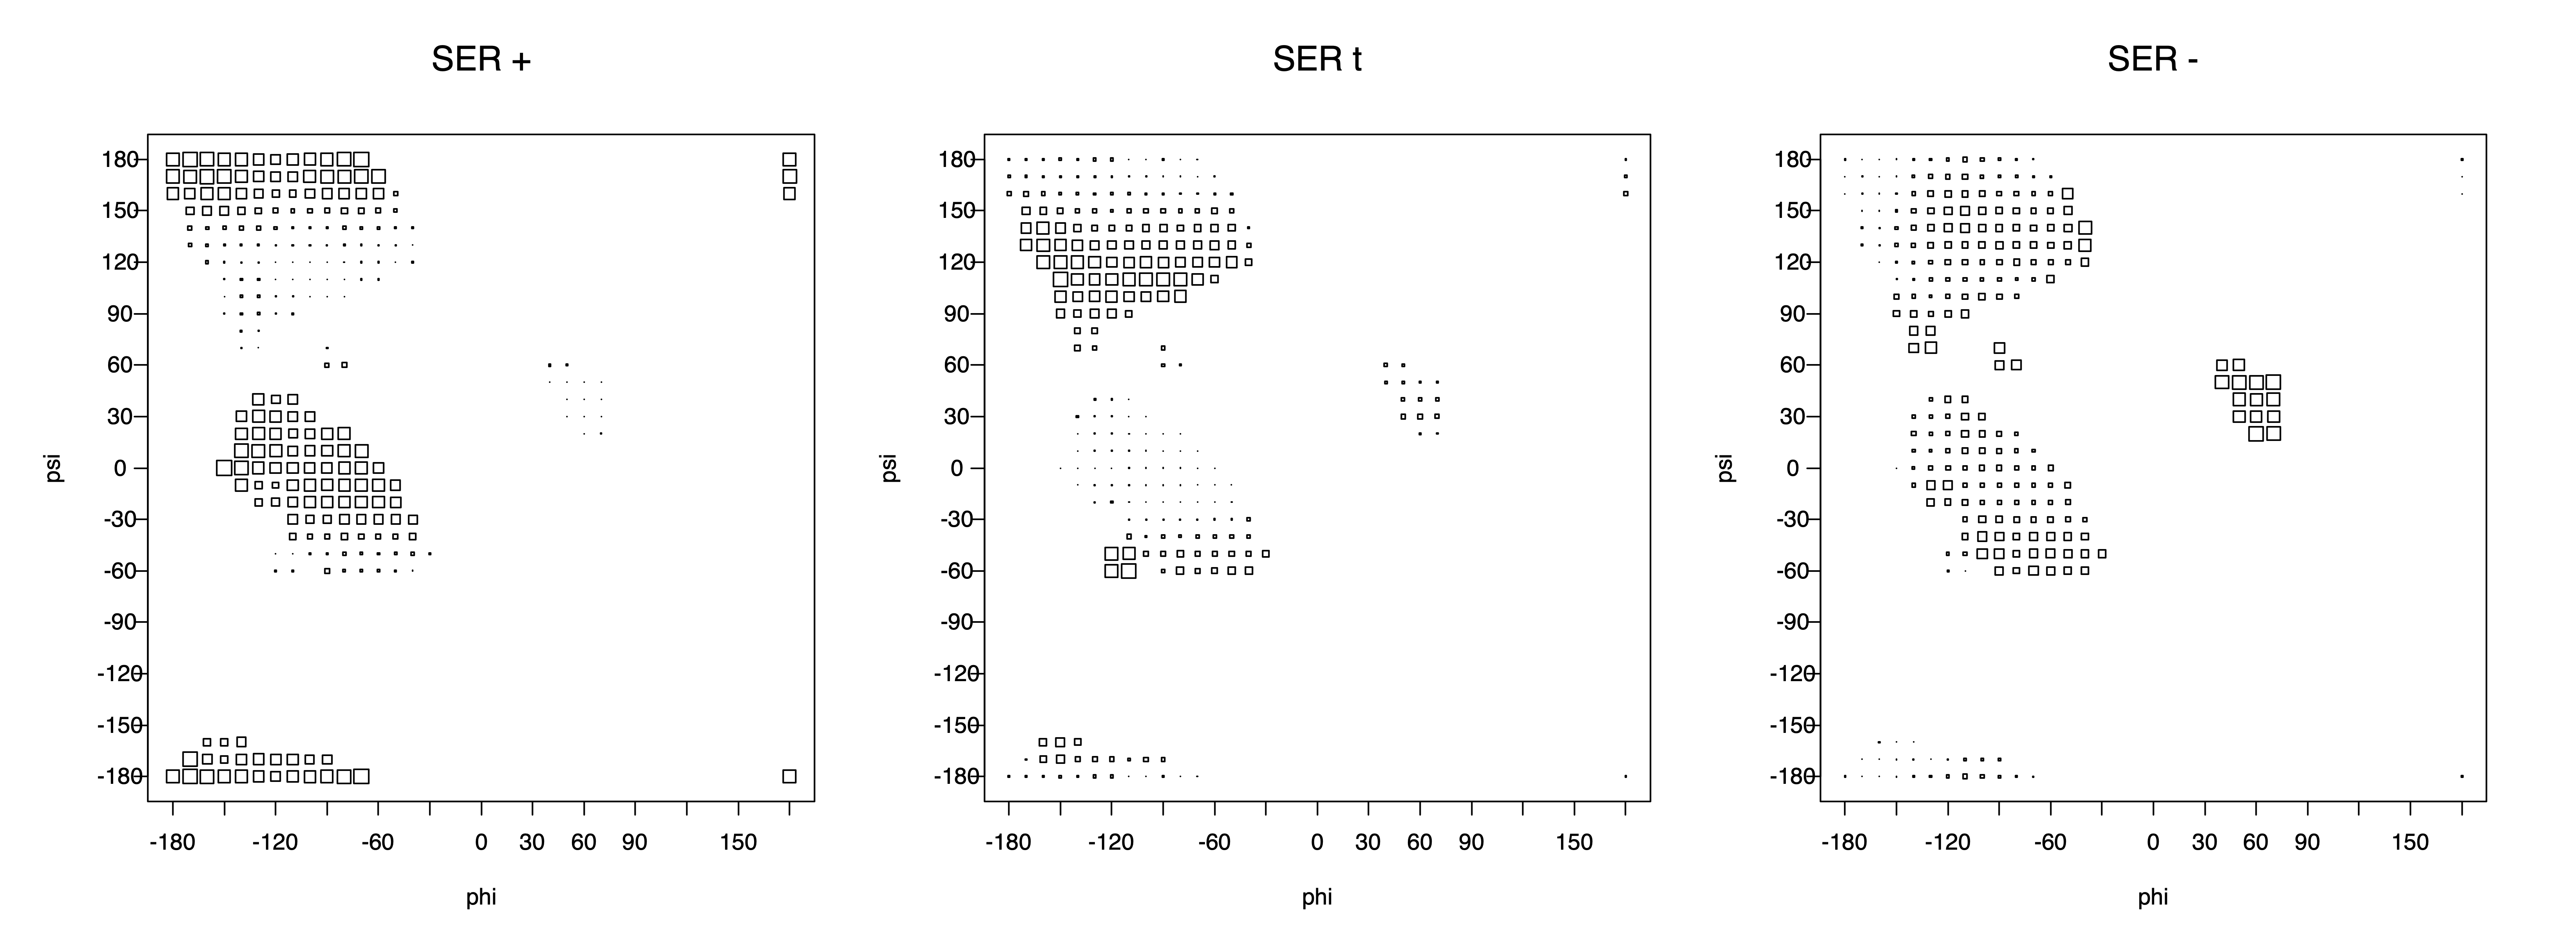
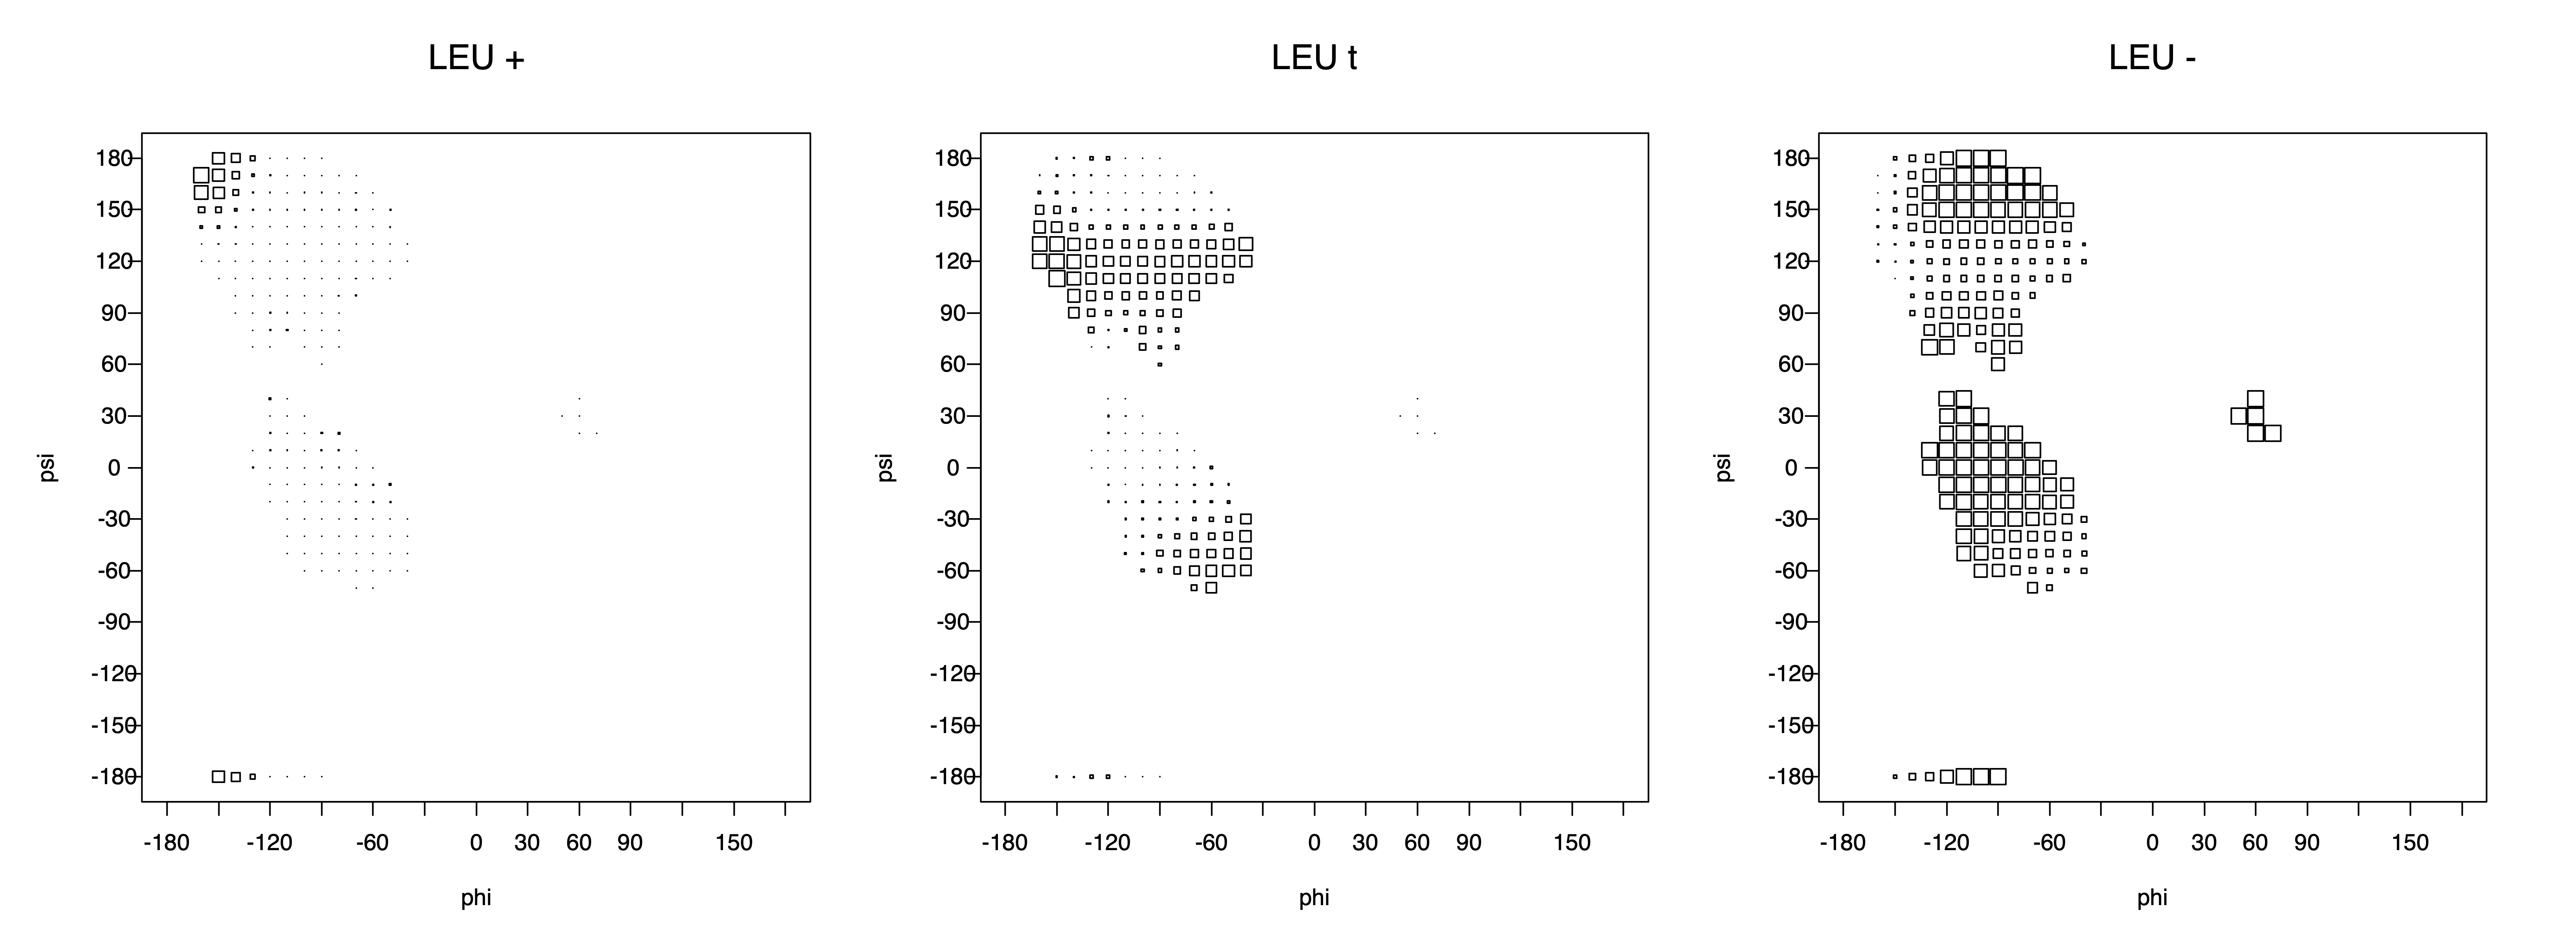
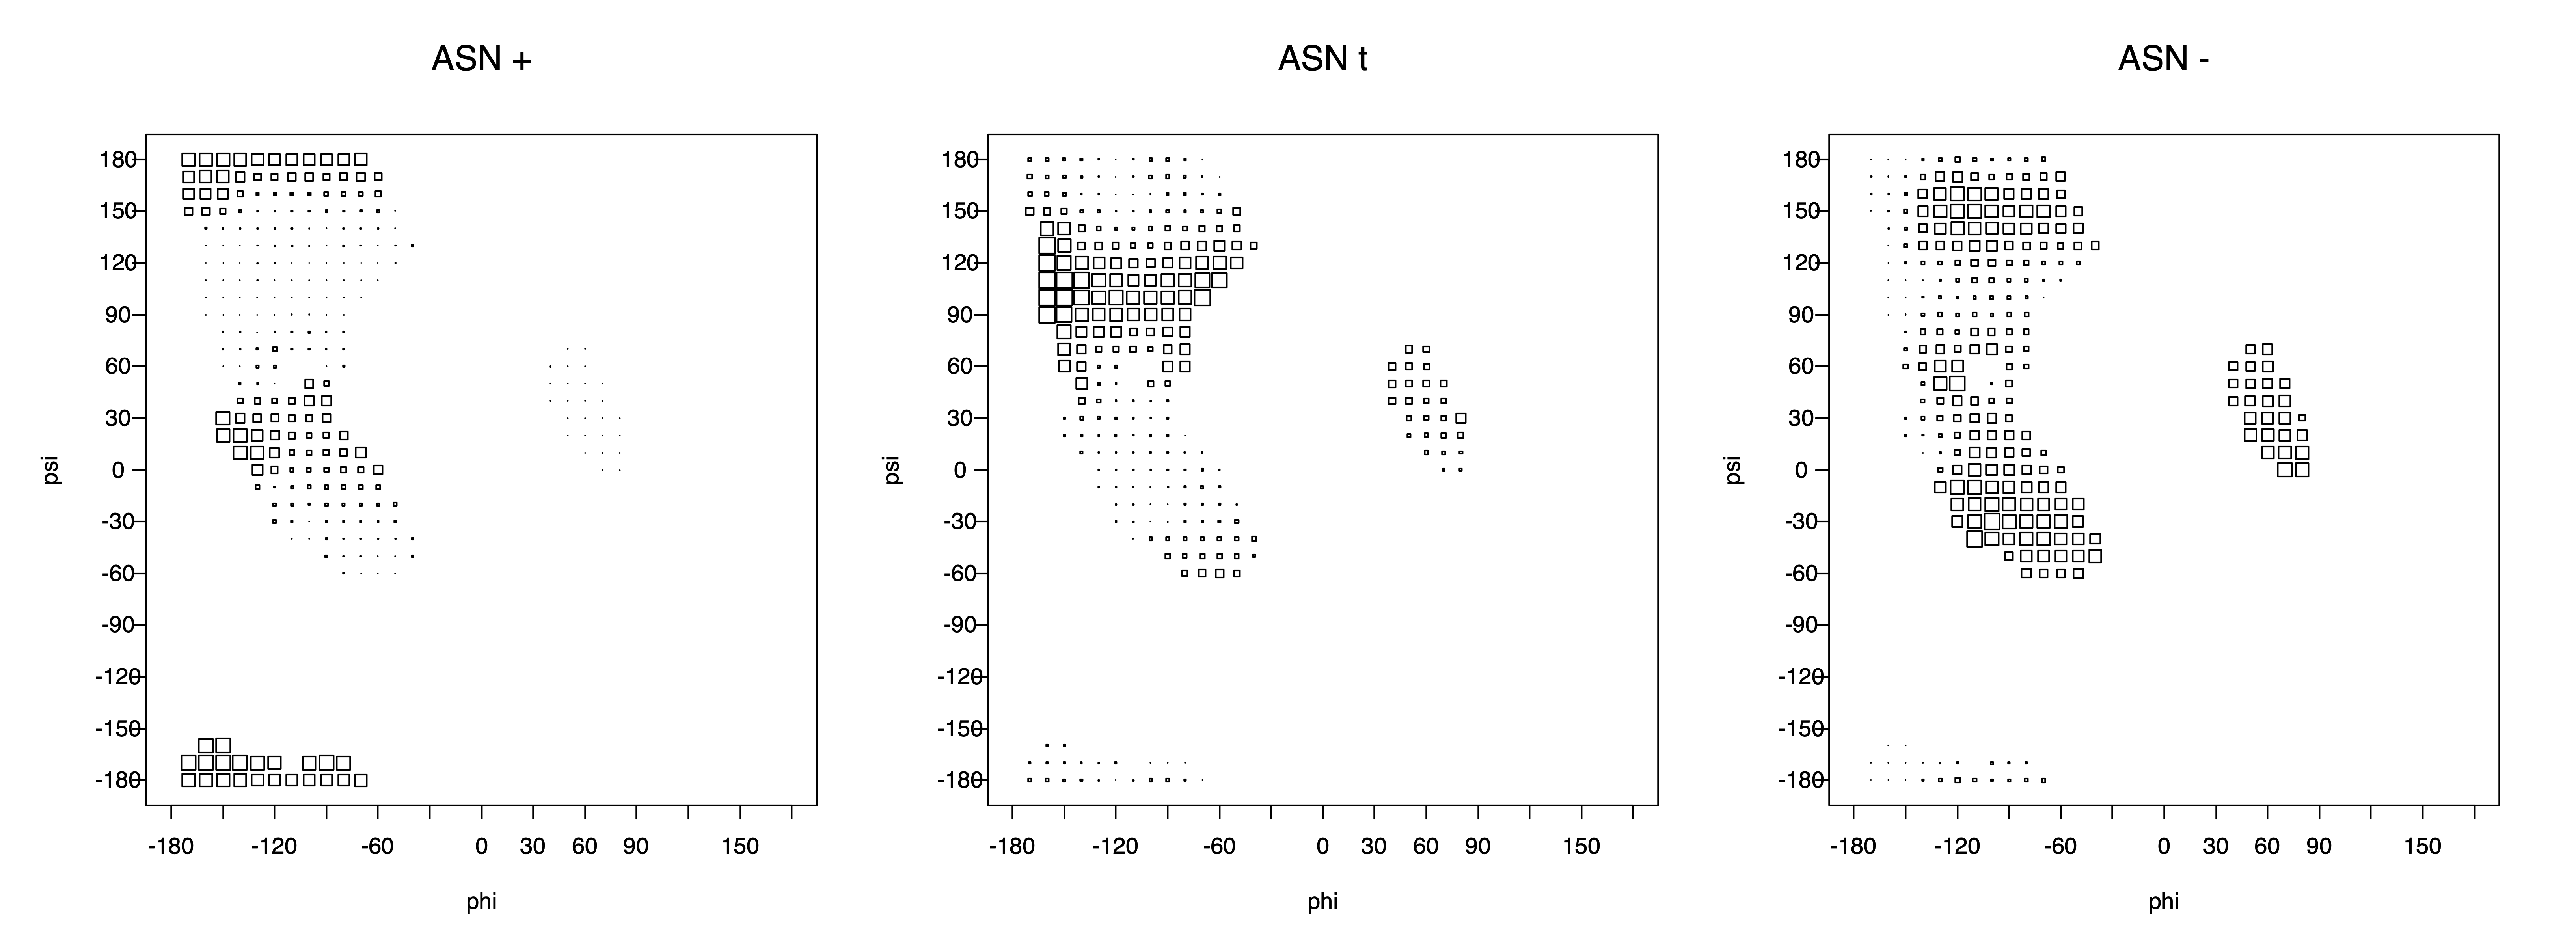
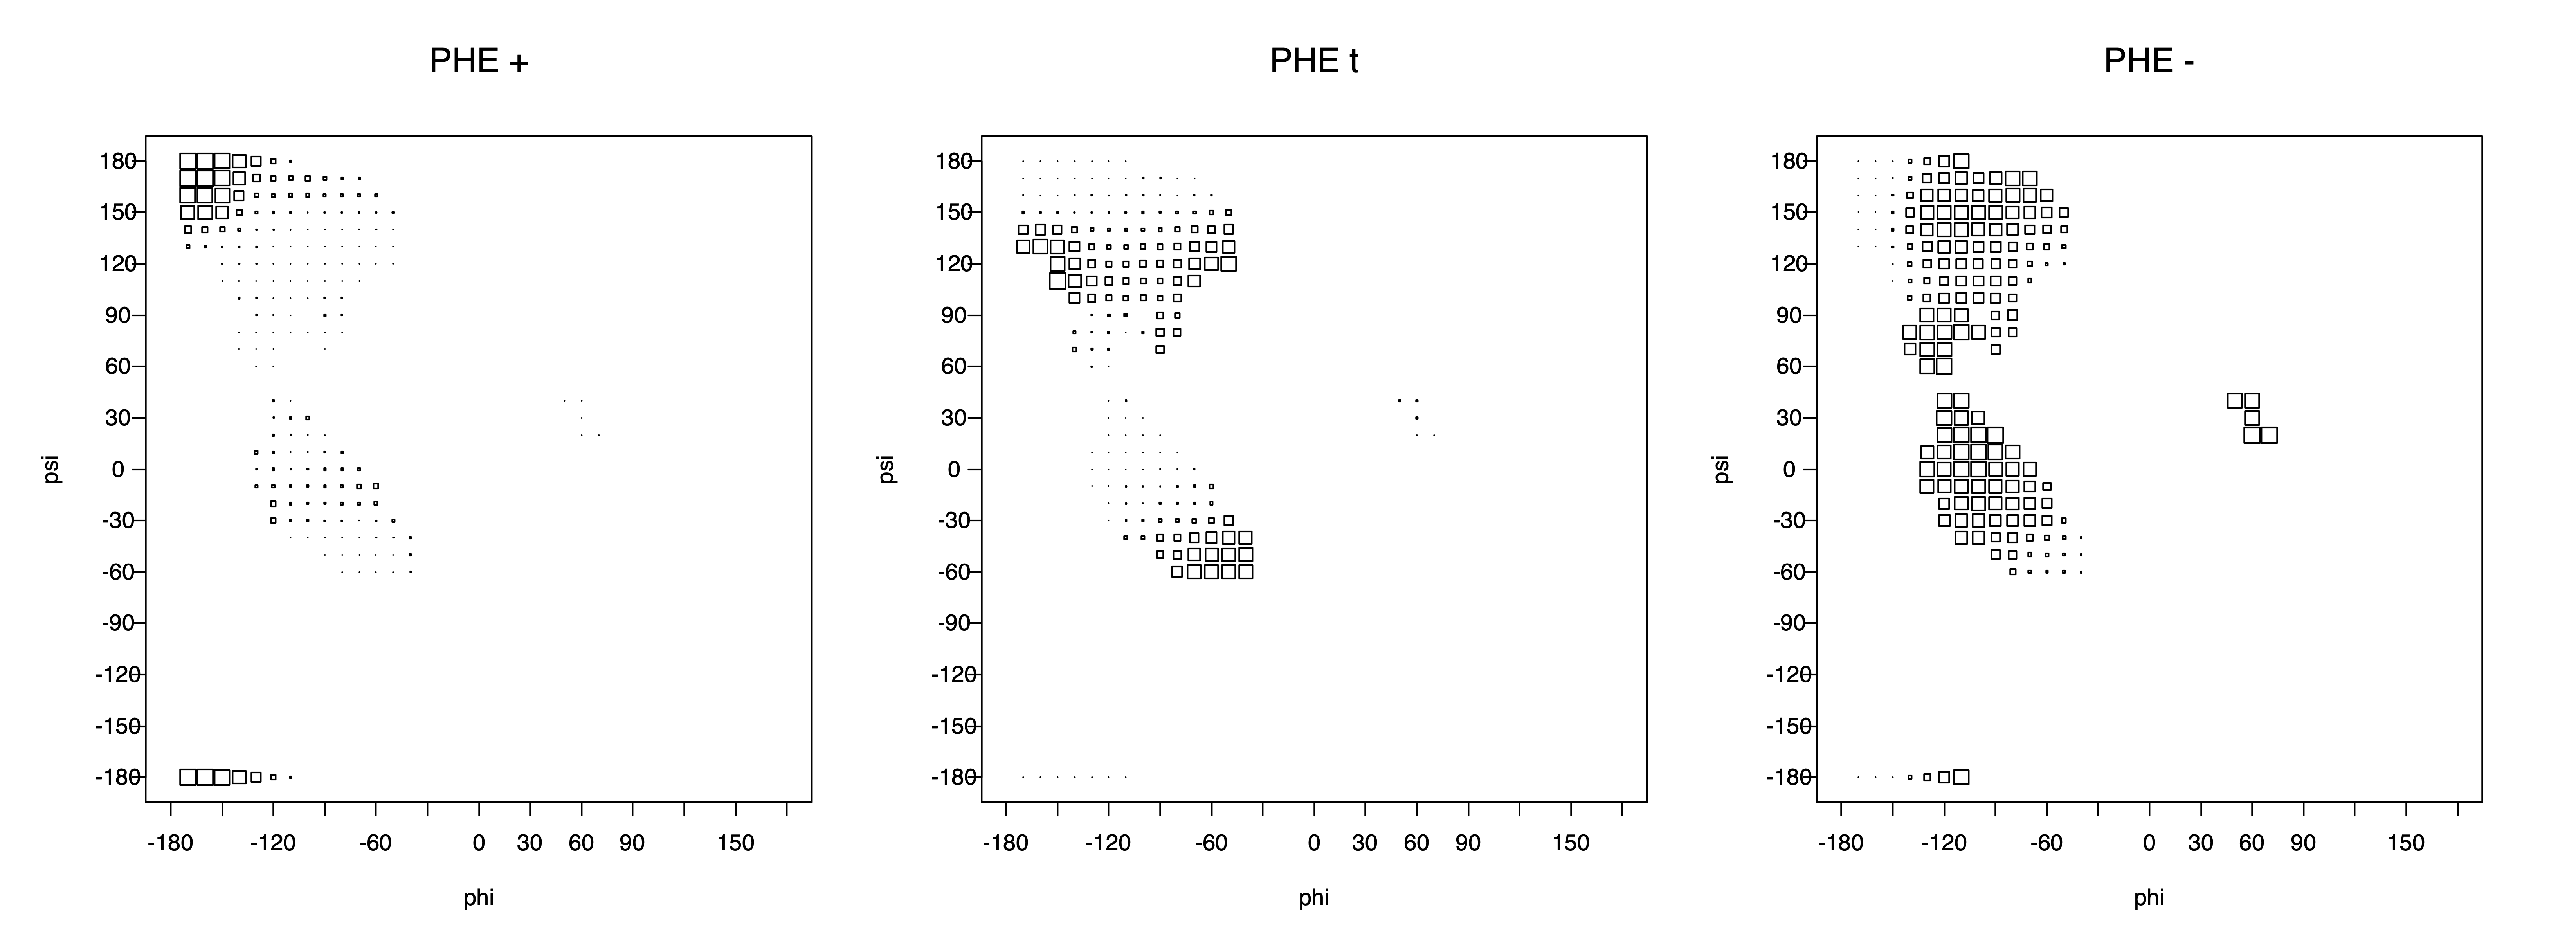
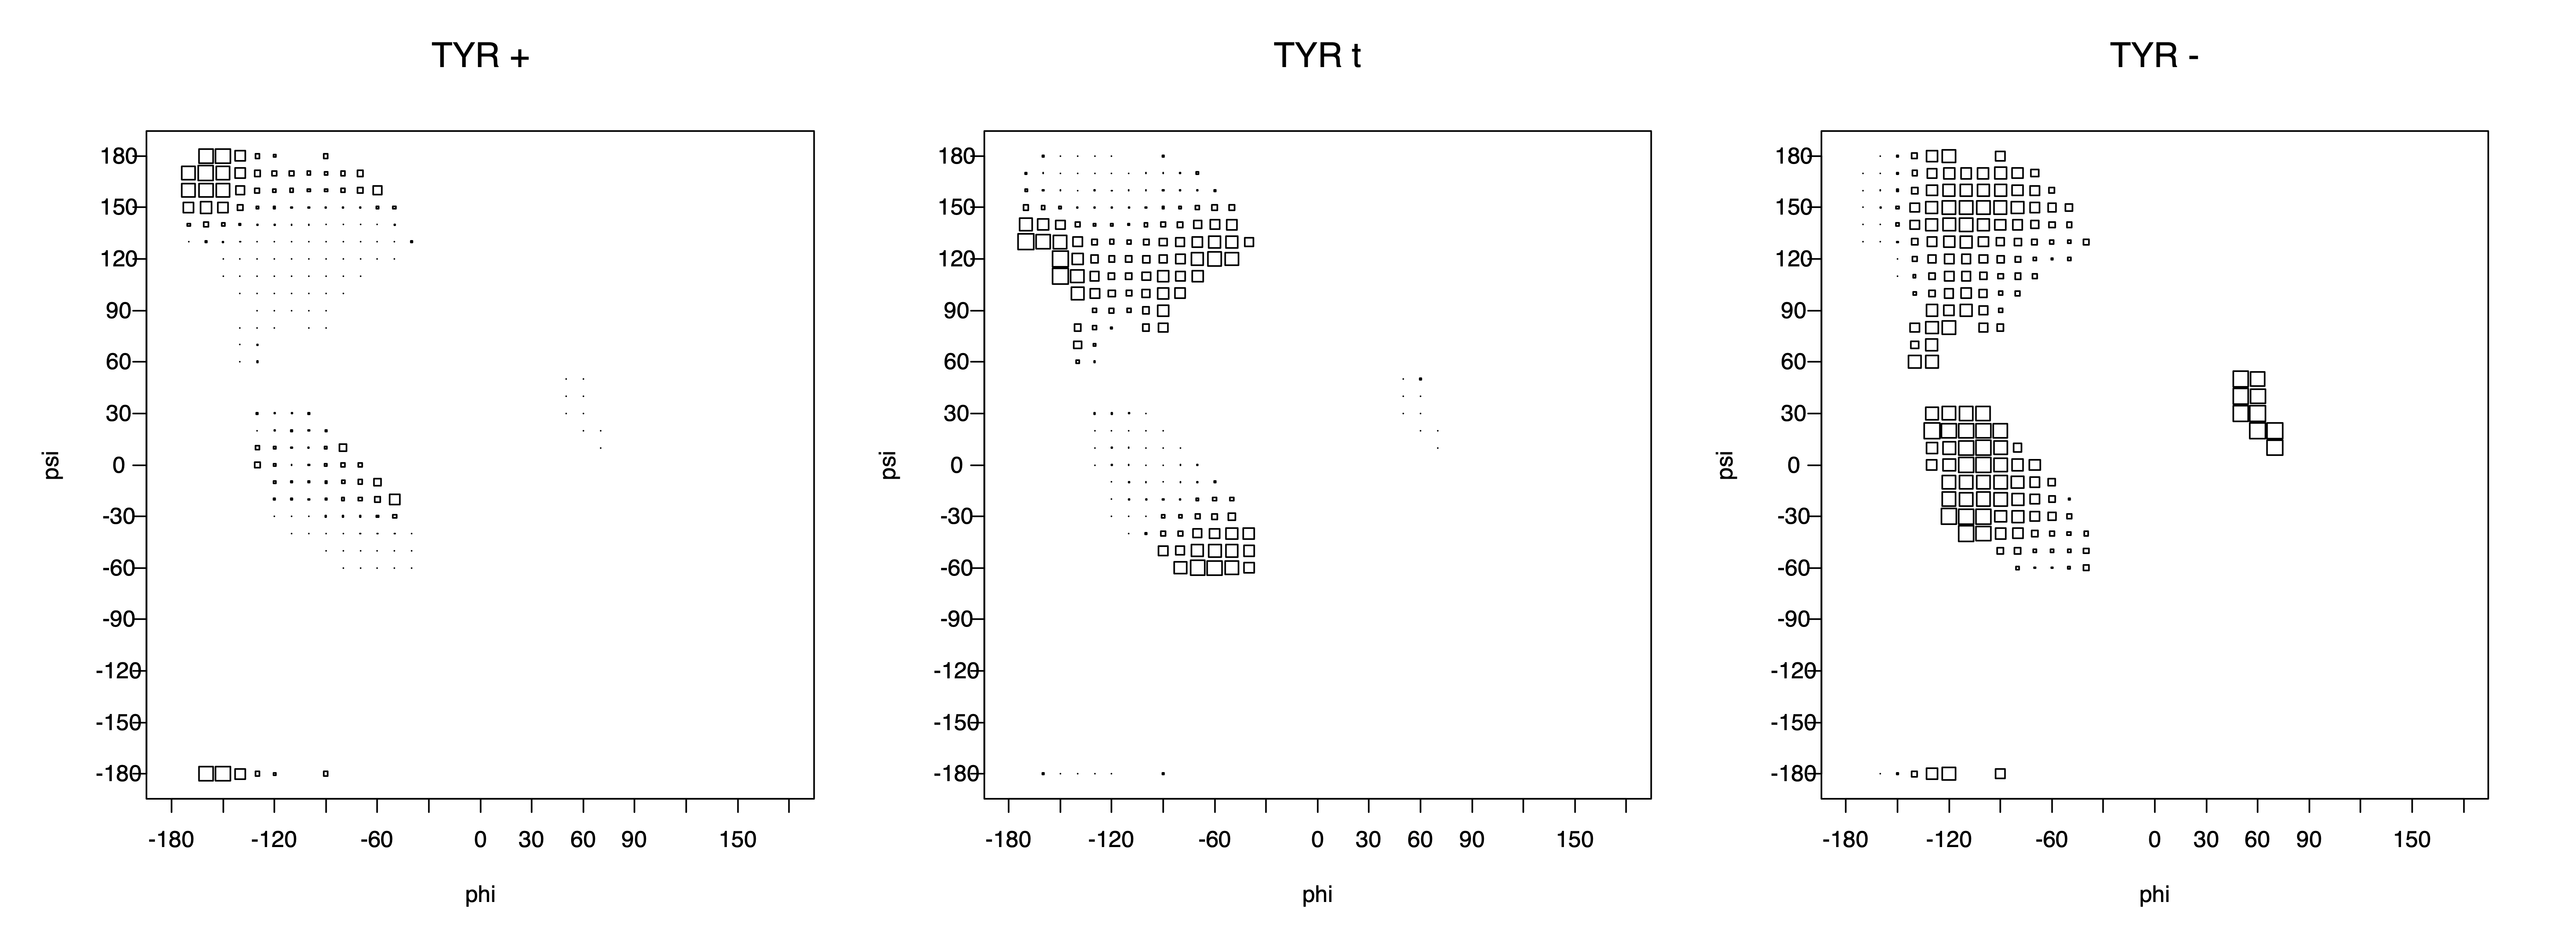
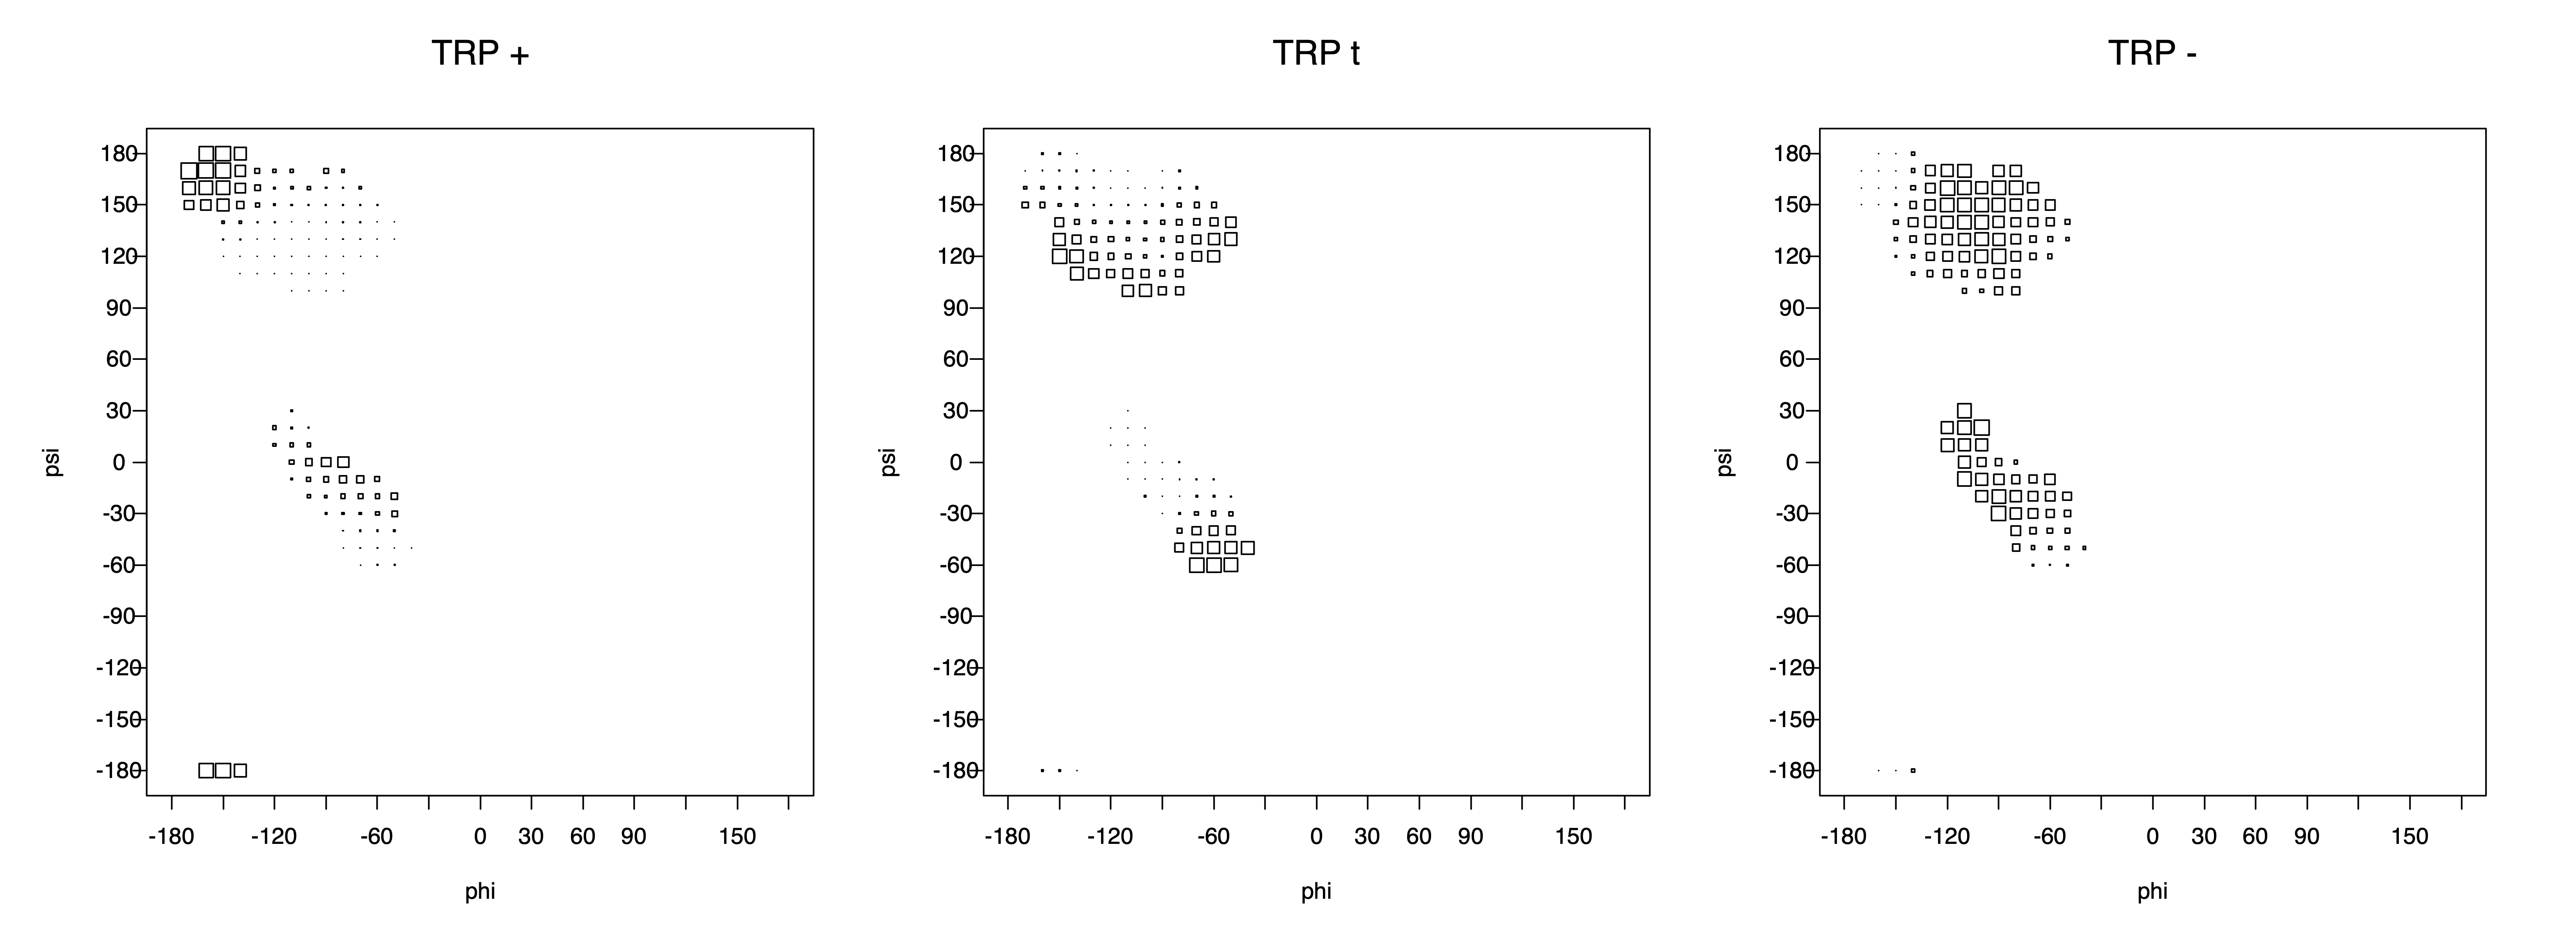
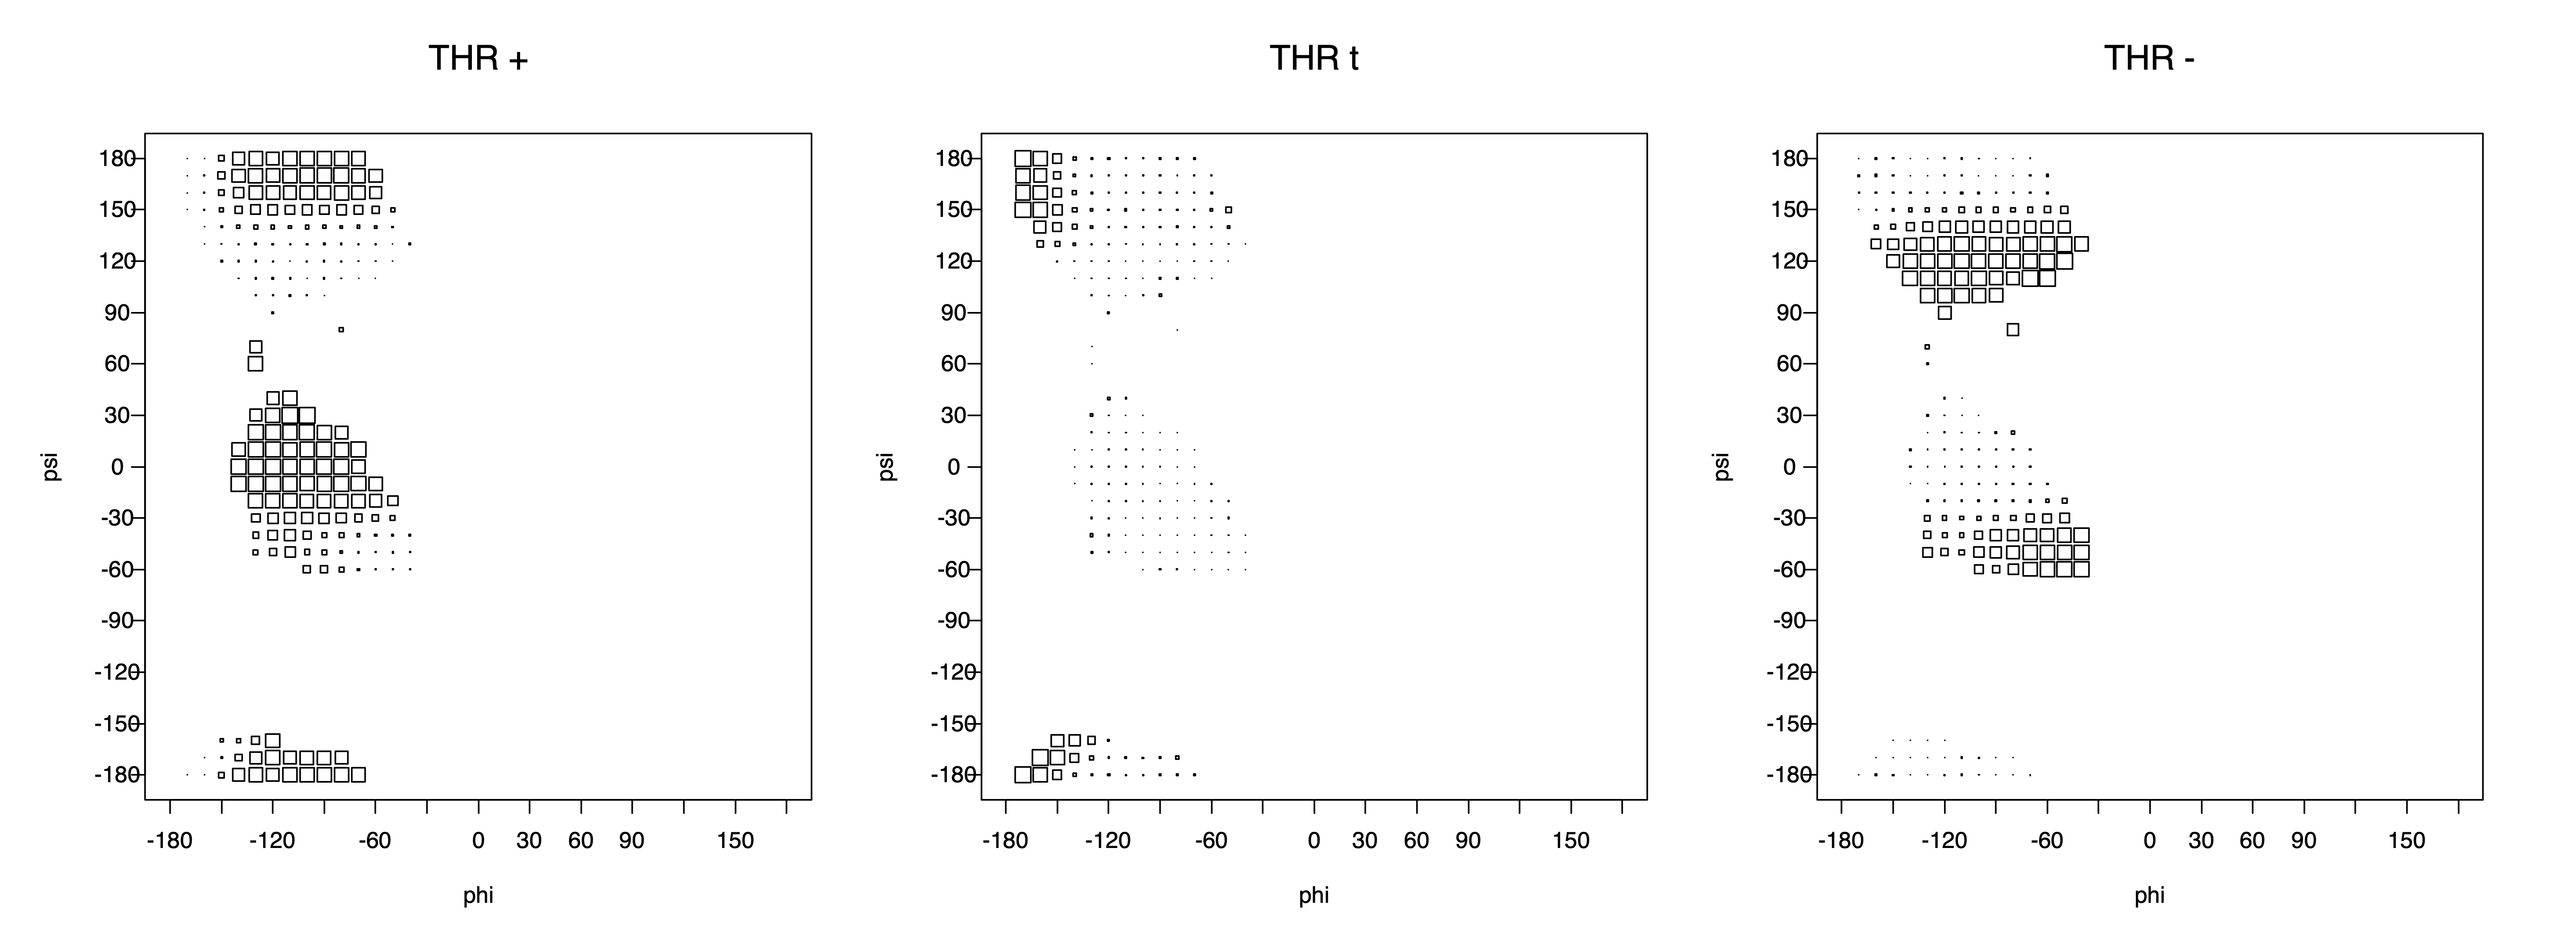
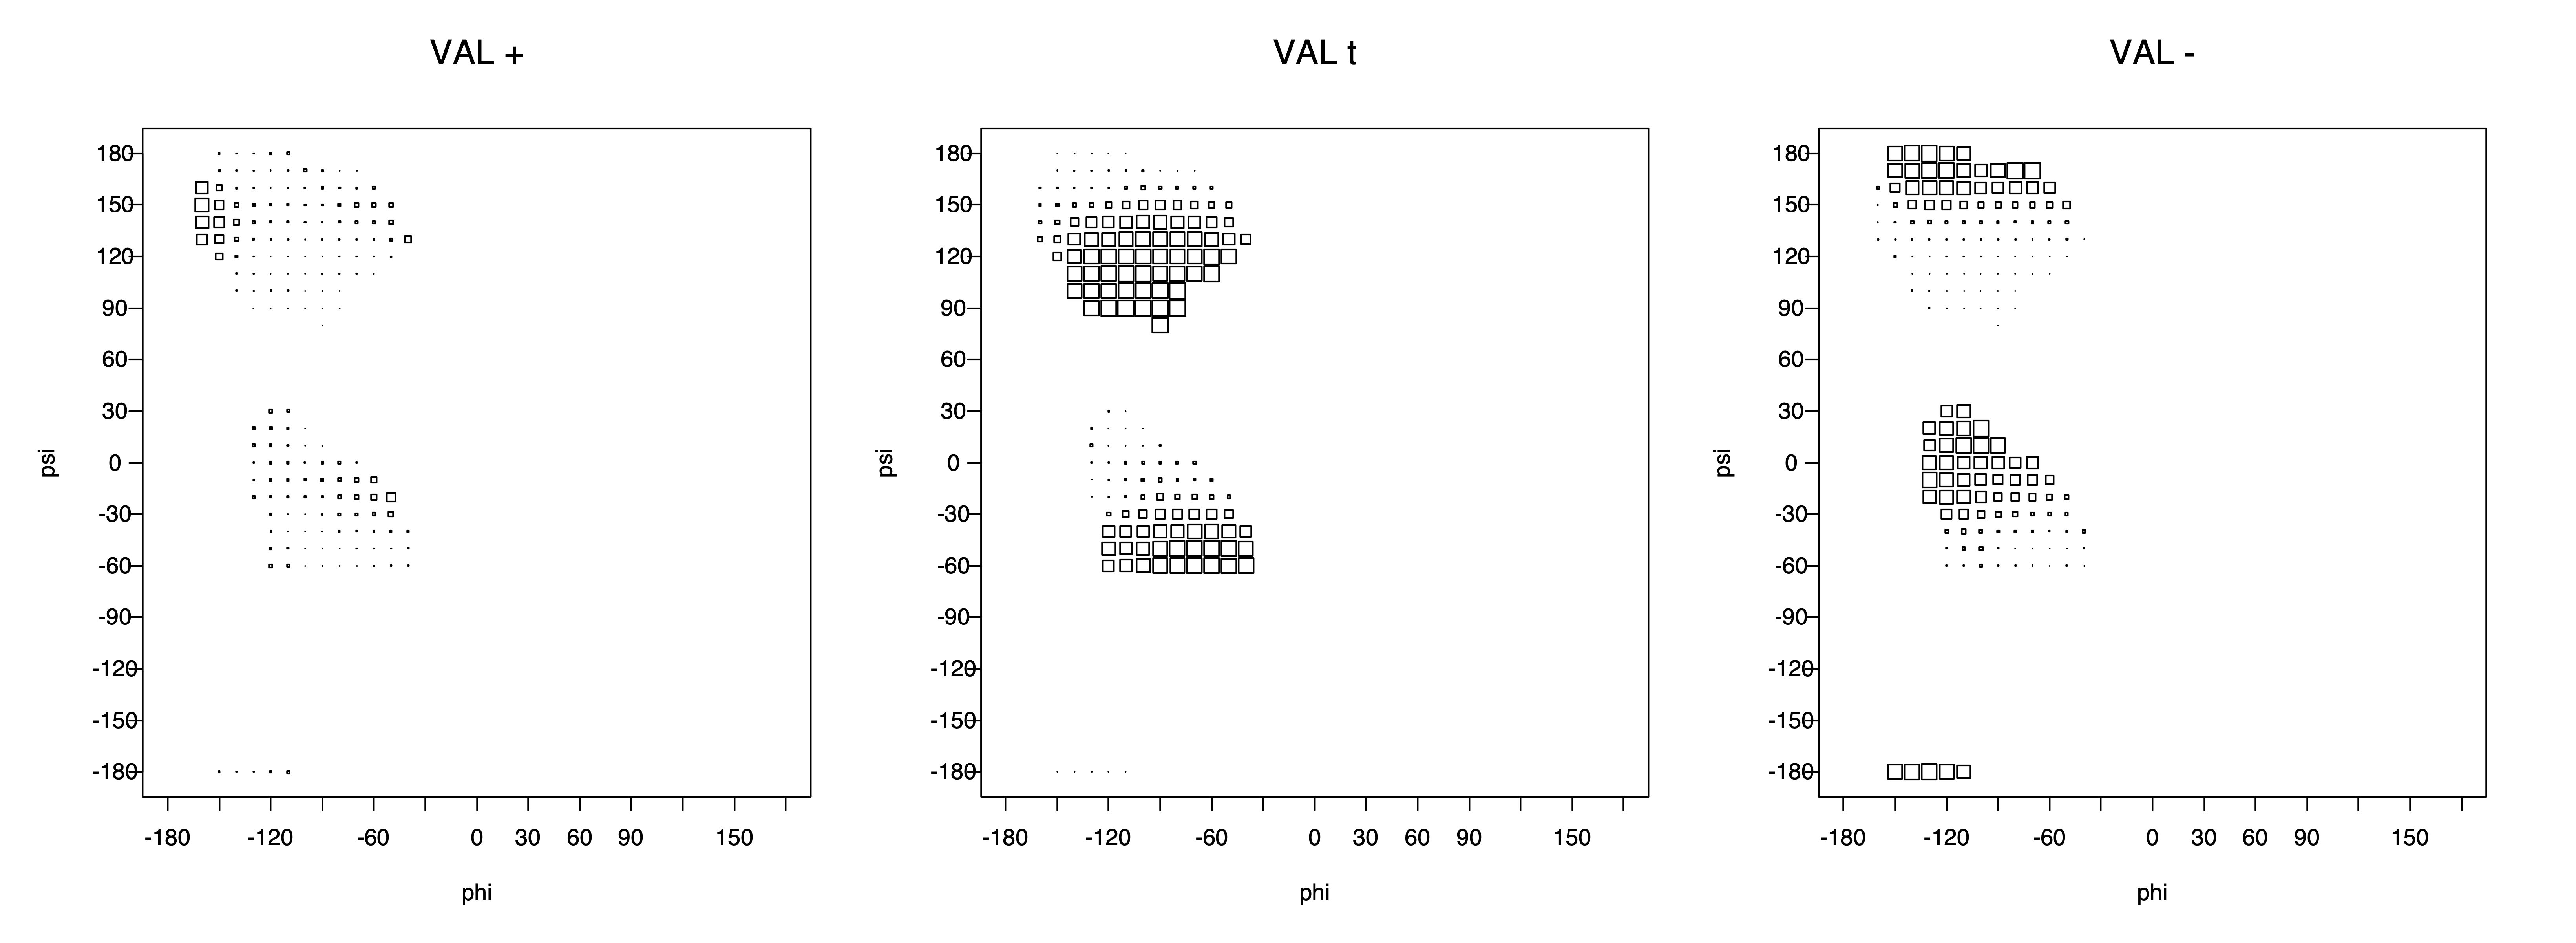
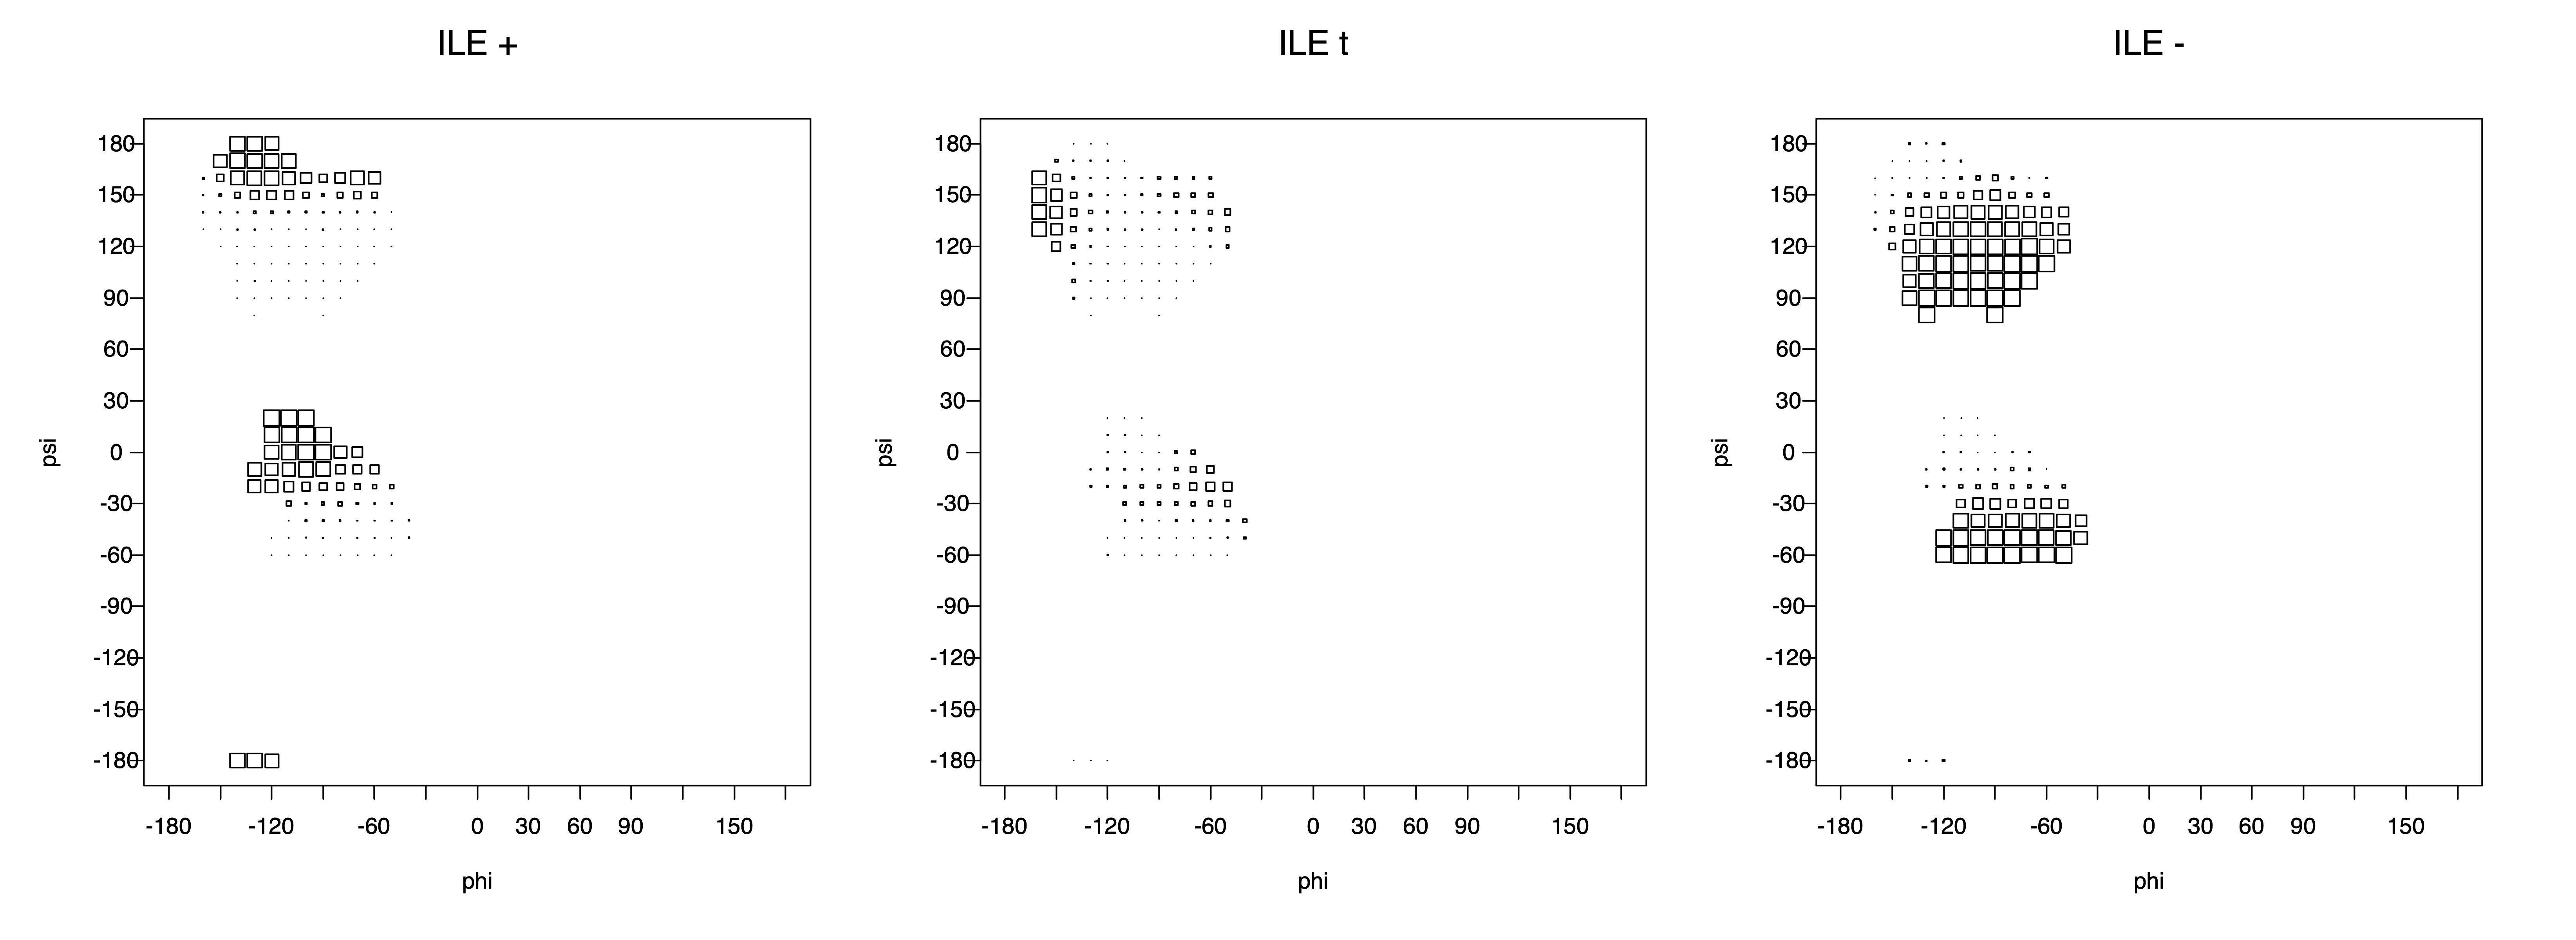
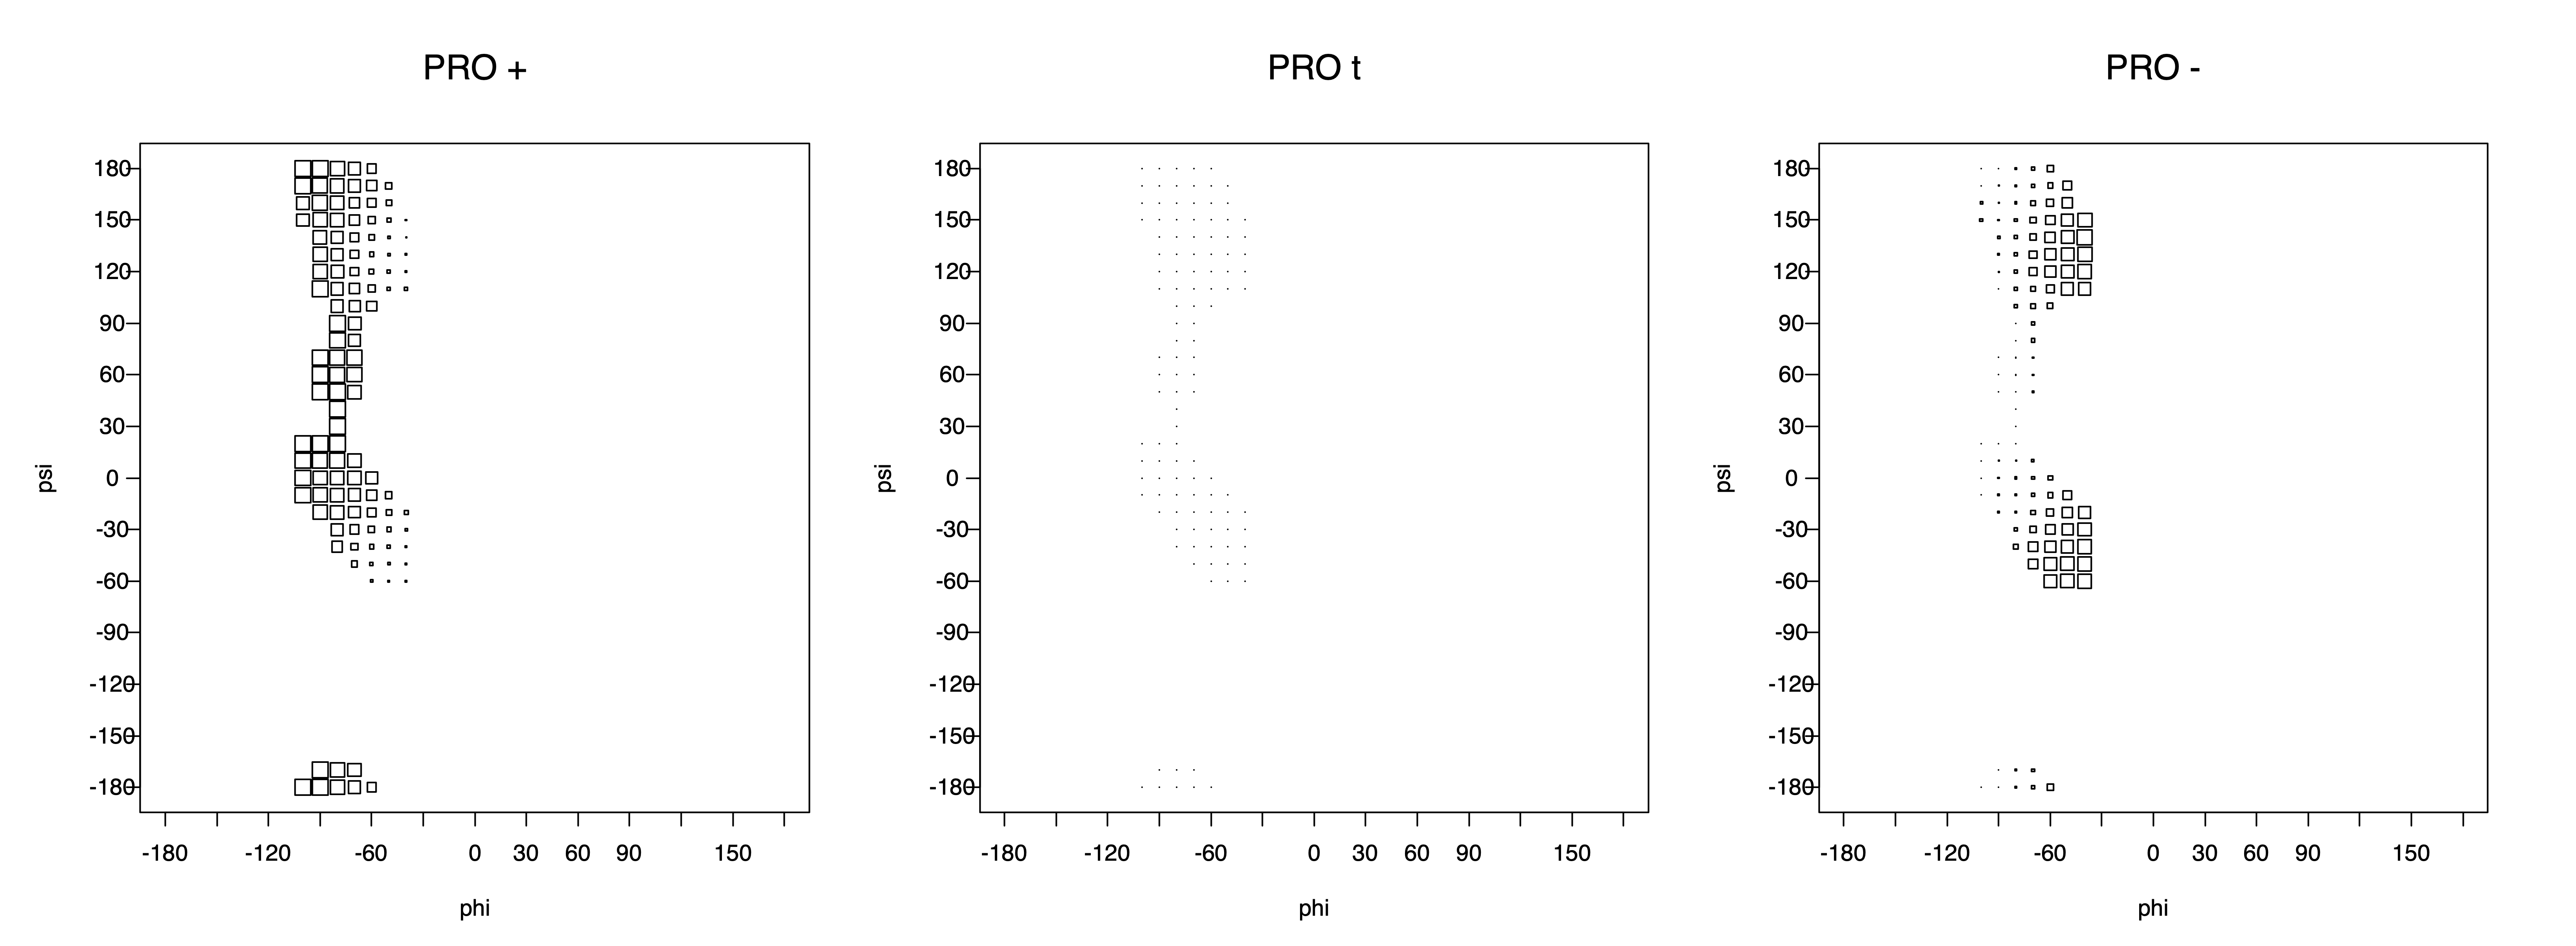
2. Box plots
The φ and ψ dependence can be illustrated simultaneously in box plots. The width of the boxes located at each φ,ψ point in a Ramachandran map are proportional to the percentage of rotamers for that φ,ψ that are a particular rotamer (one graph for each of the g+, t, and g- rotamers, labeled "+", "t", and "-" in the plots). The summed distribution (Arg, Lys, Glu, Gln, Met) is clearest (labeled "CGG"). The plot labeled "ARO" includes all four aromatic residue types (PHE, TYR, HIS, TRP). These plots are based on the 1997 data. The interactions between the XG atom and various backbone atoms is illustrated in the first plot. All of the plots can be downloaded here.


3. Surface Plots
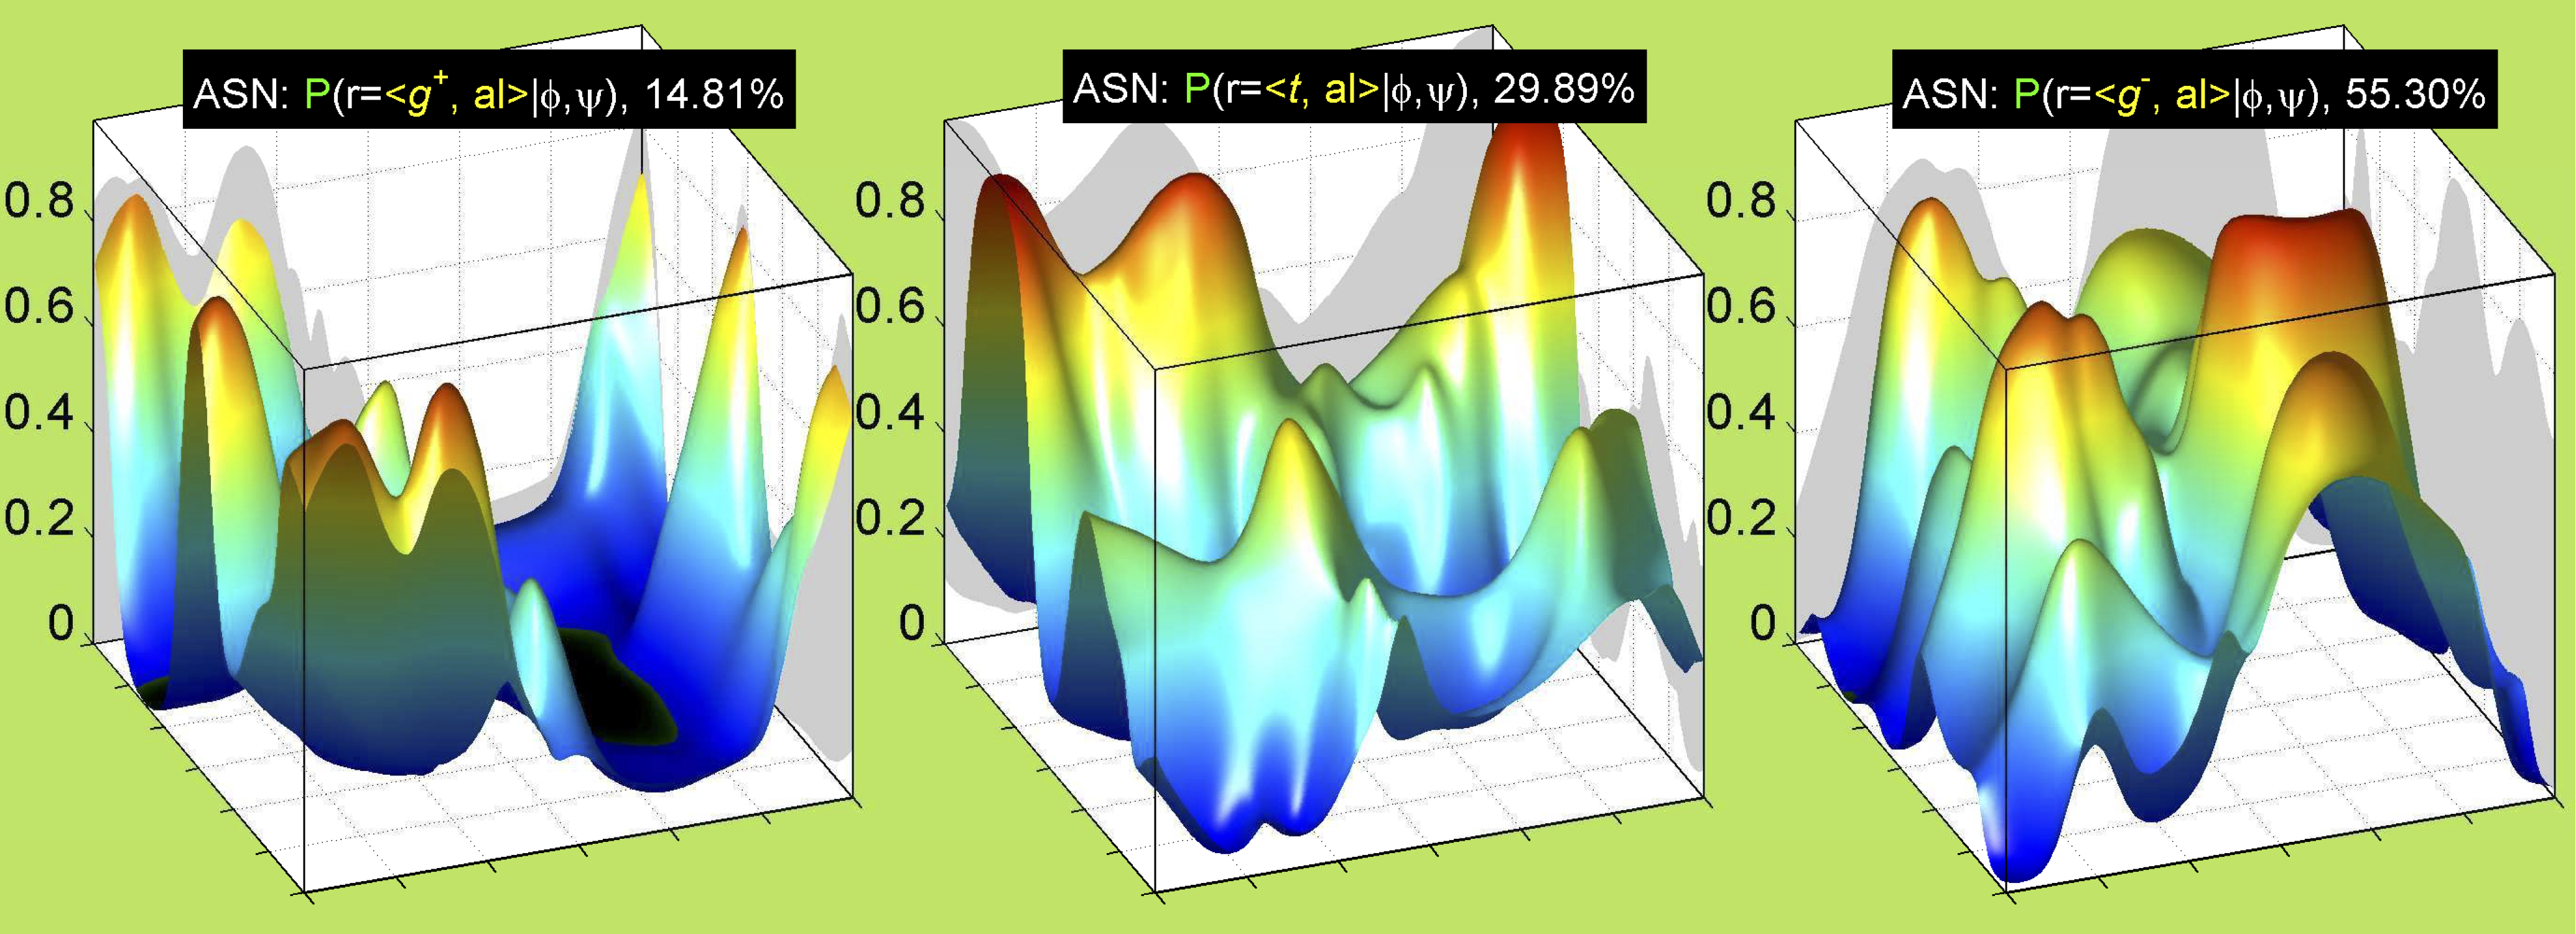

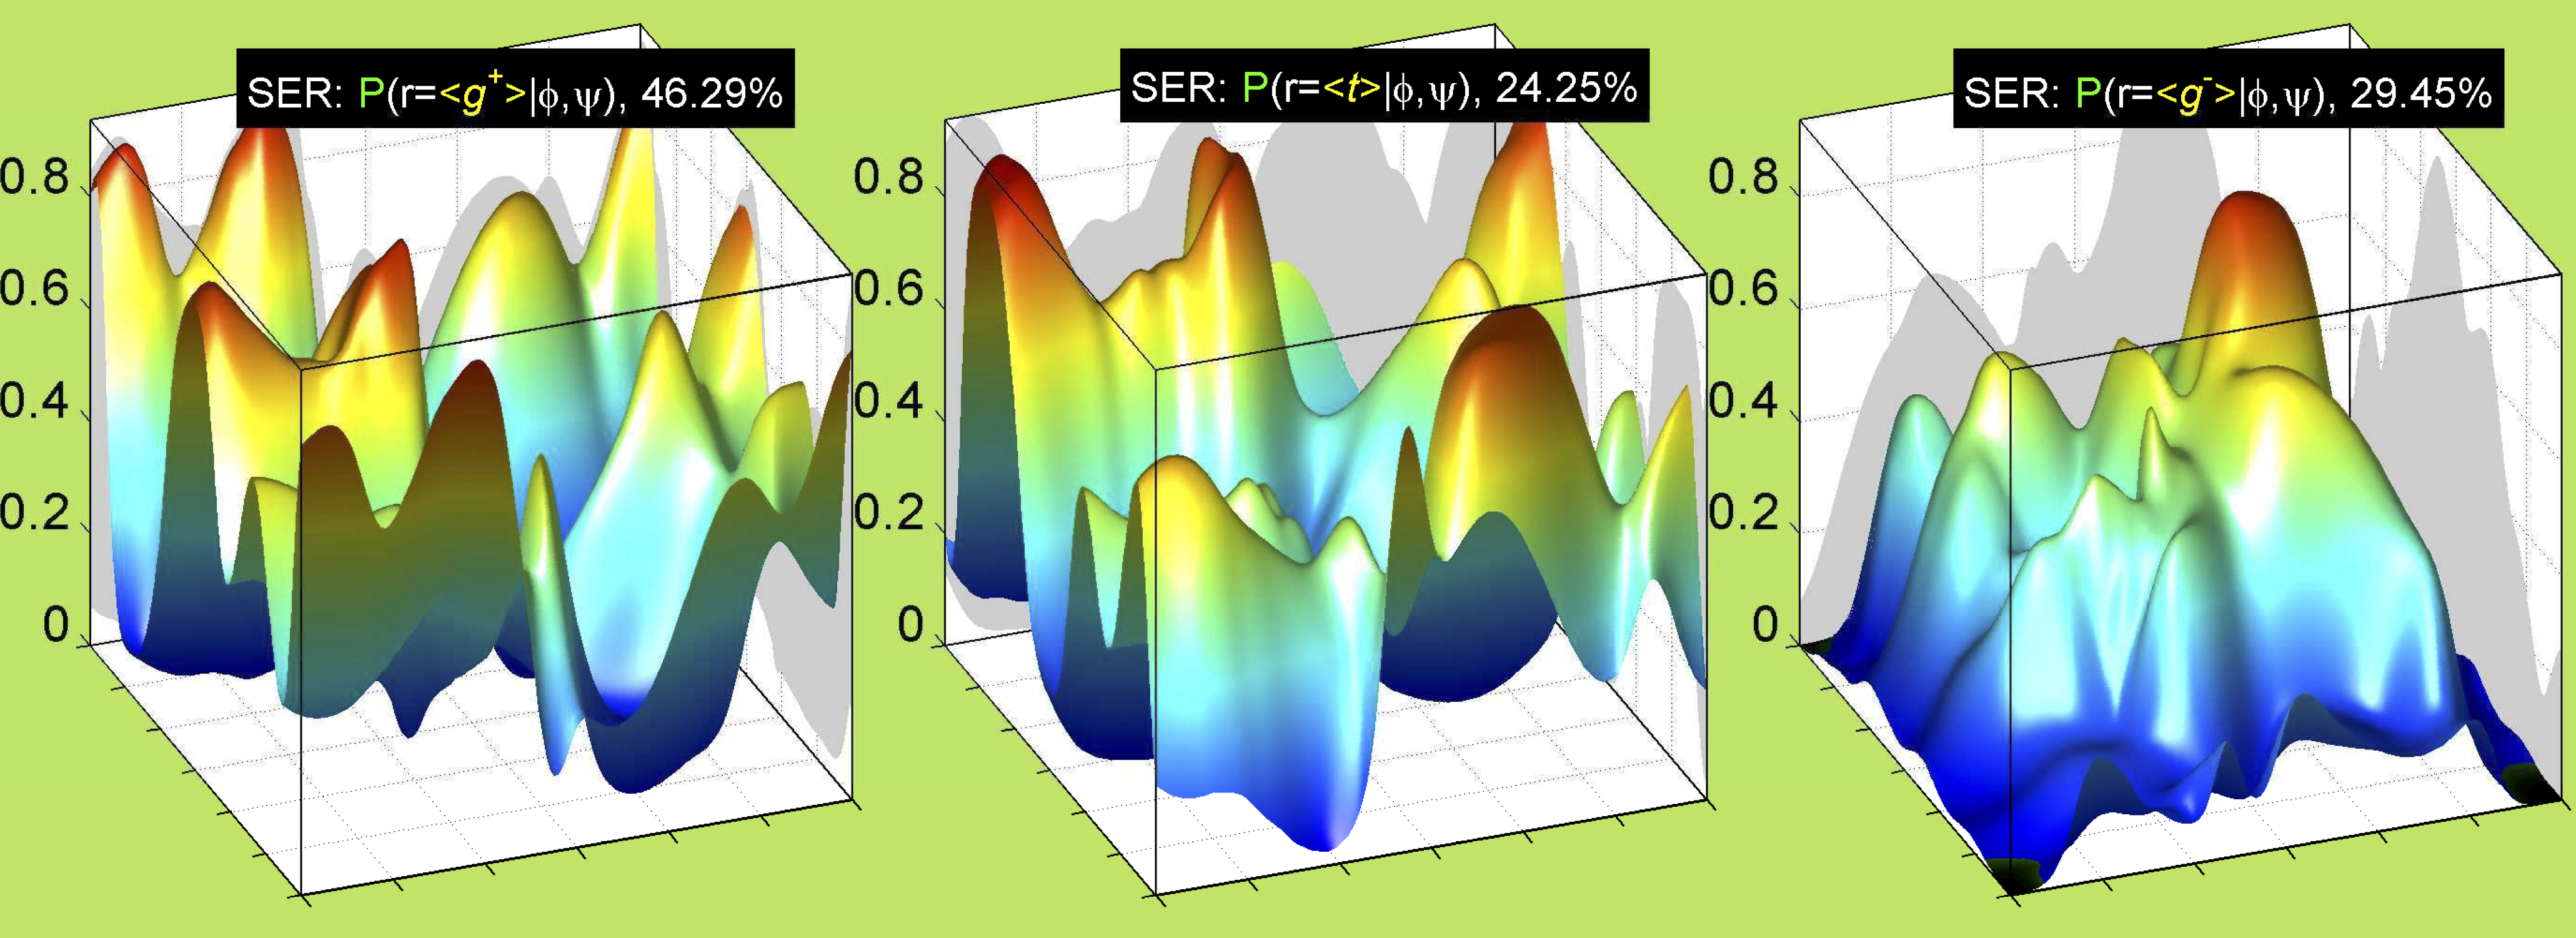
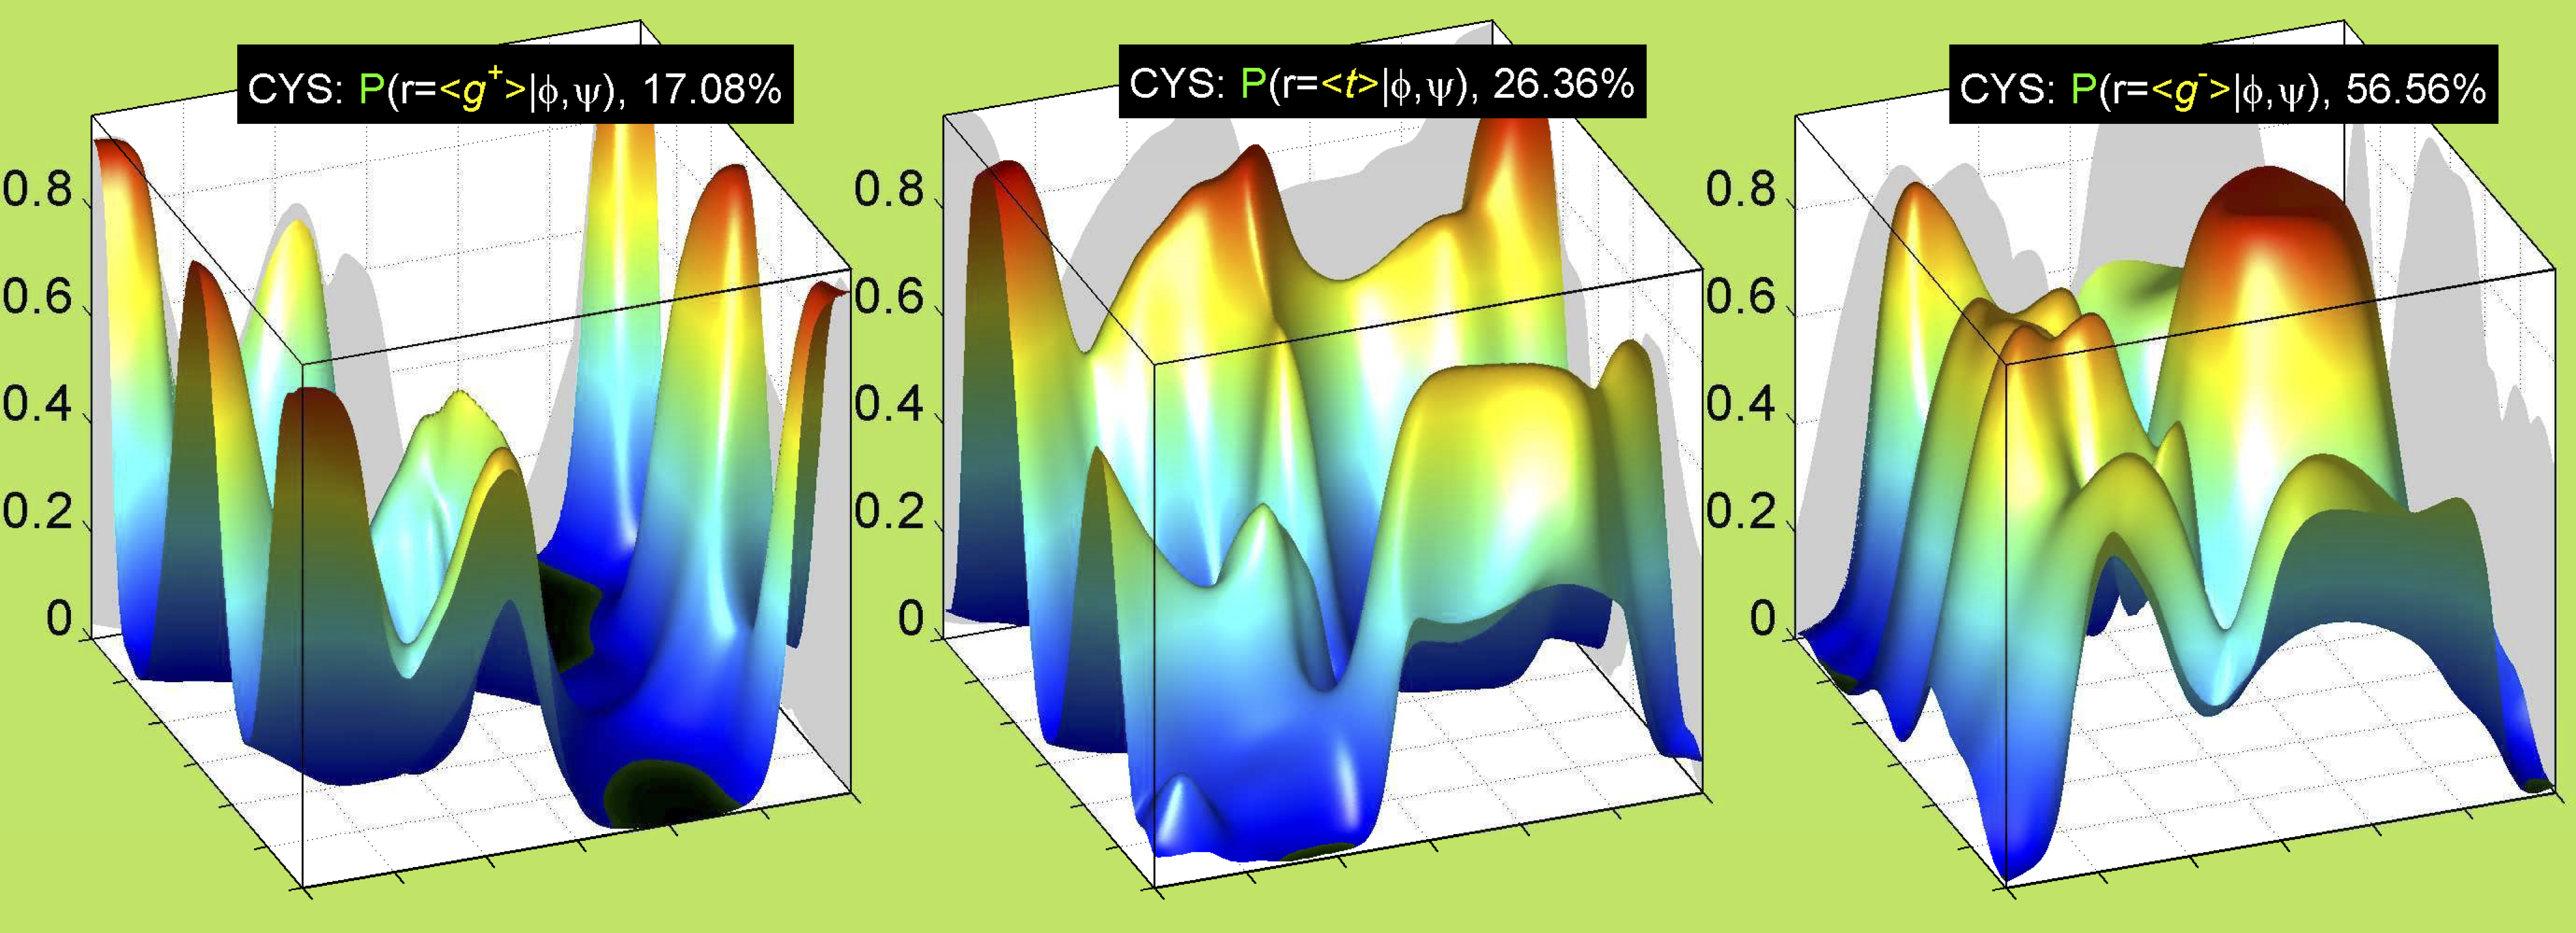
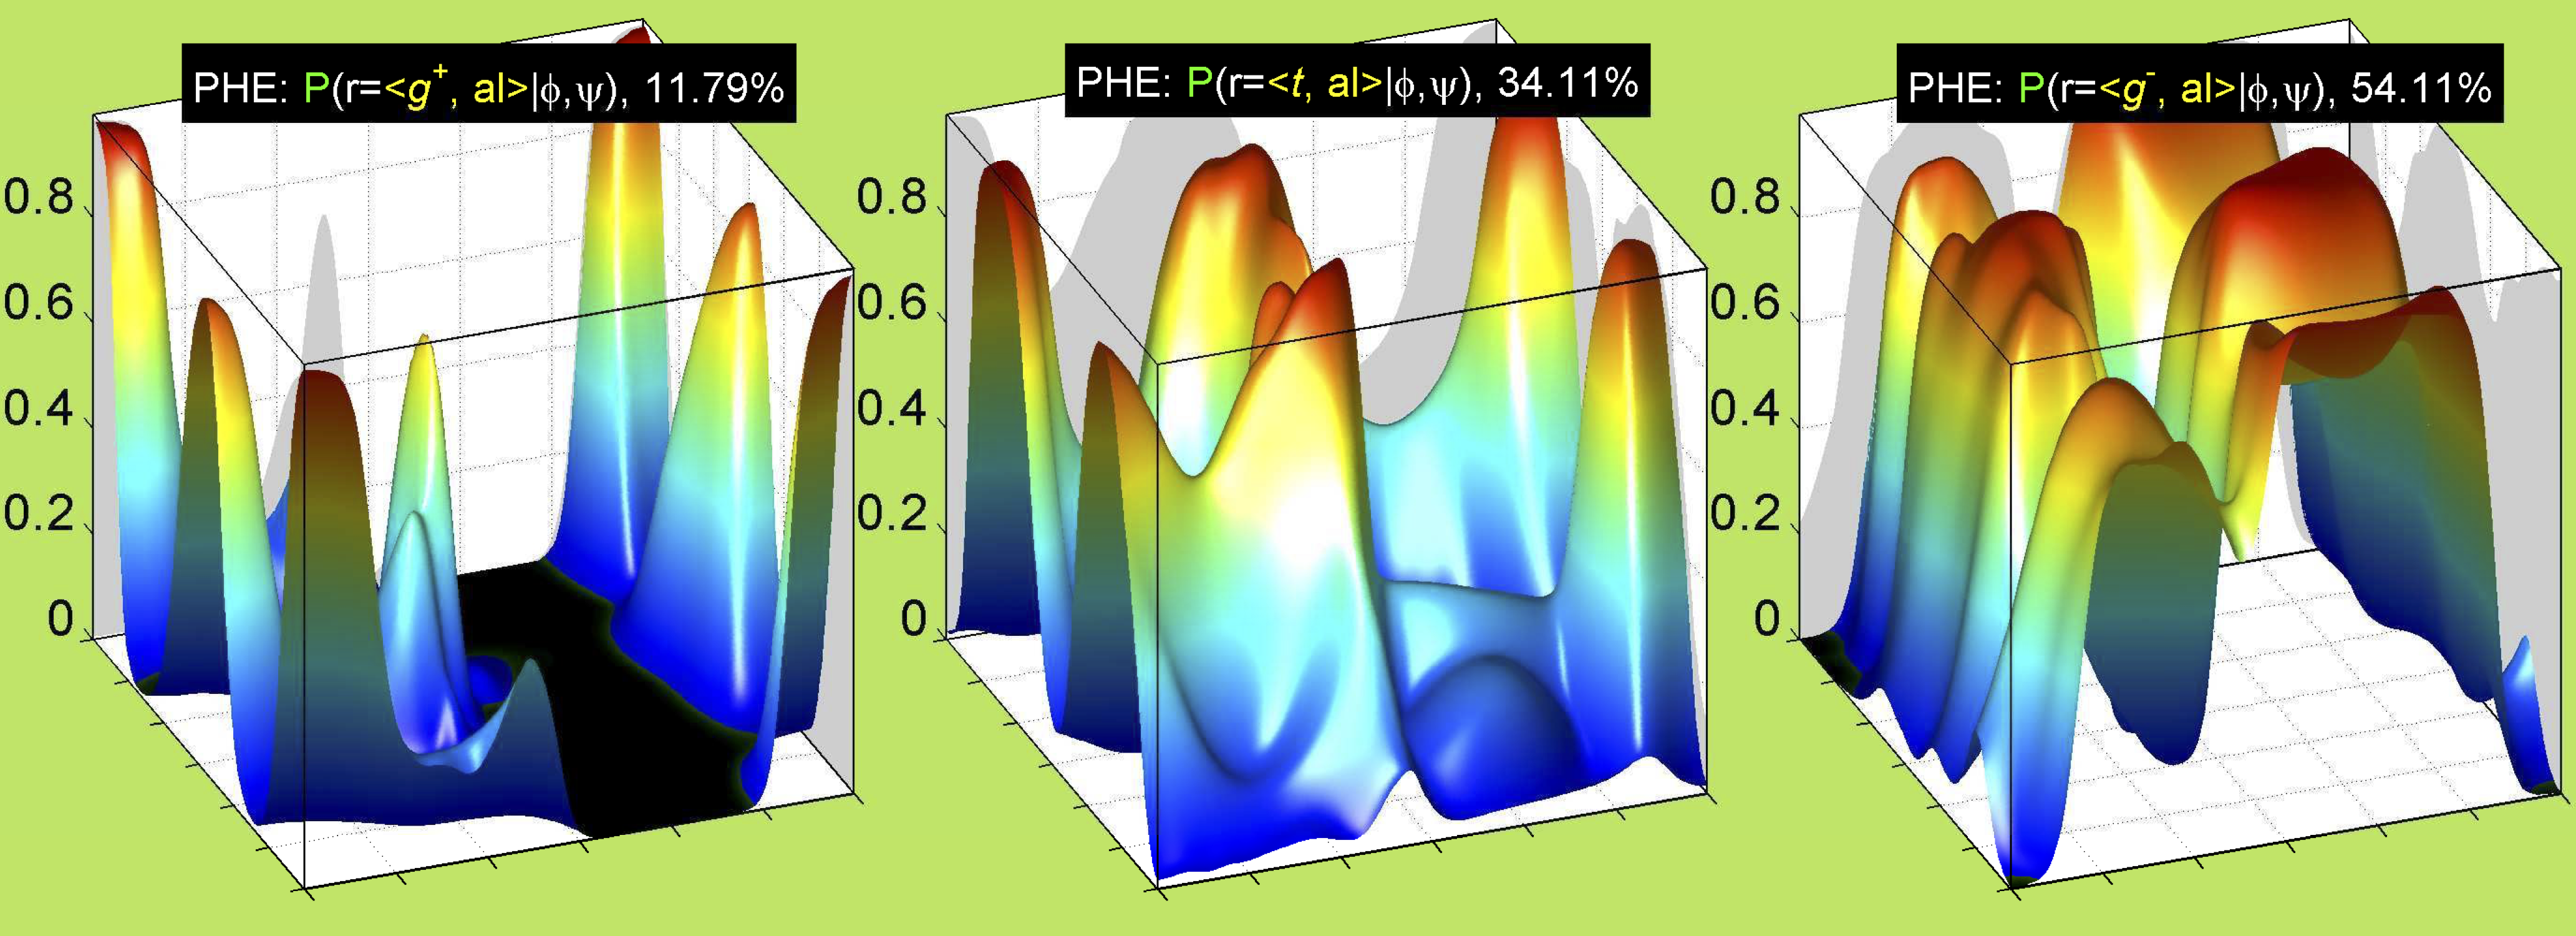
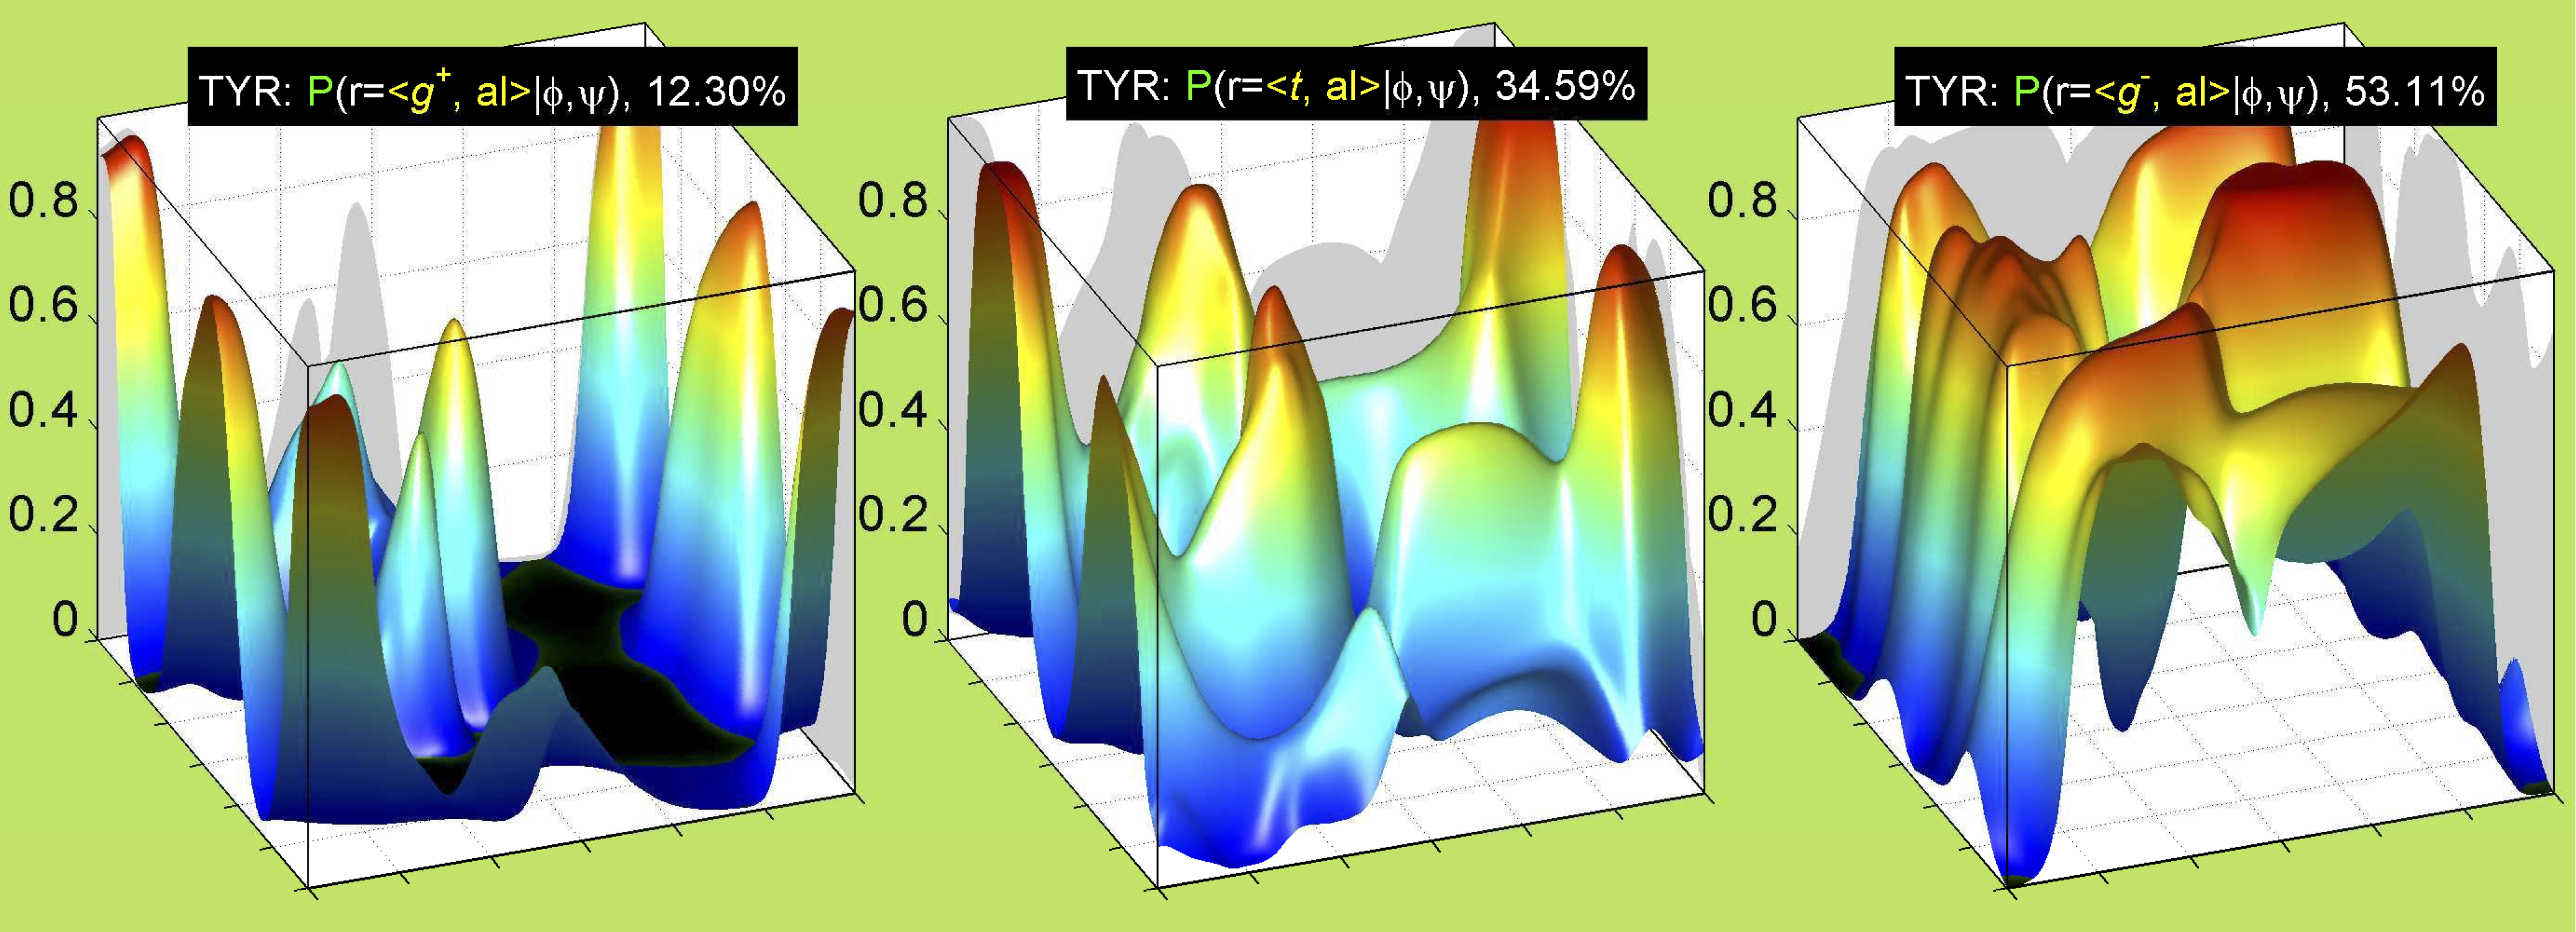

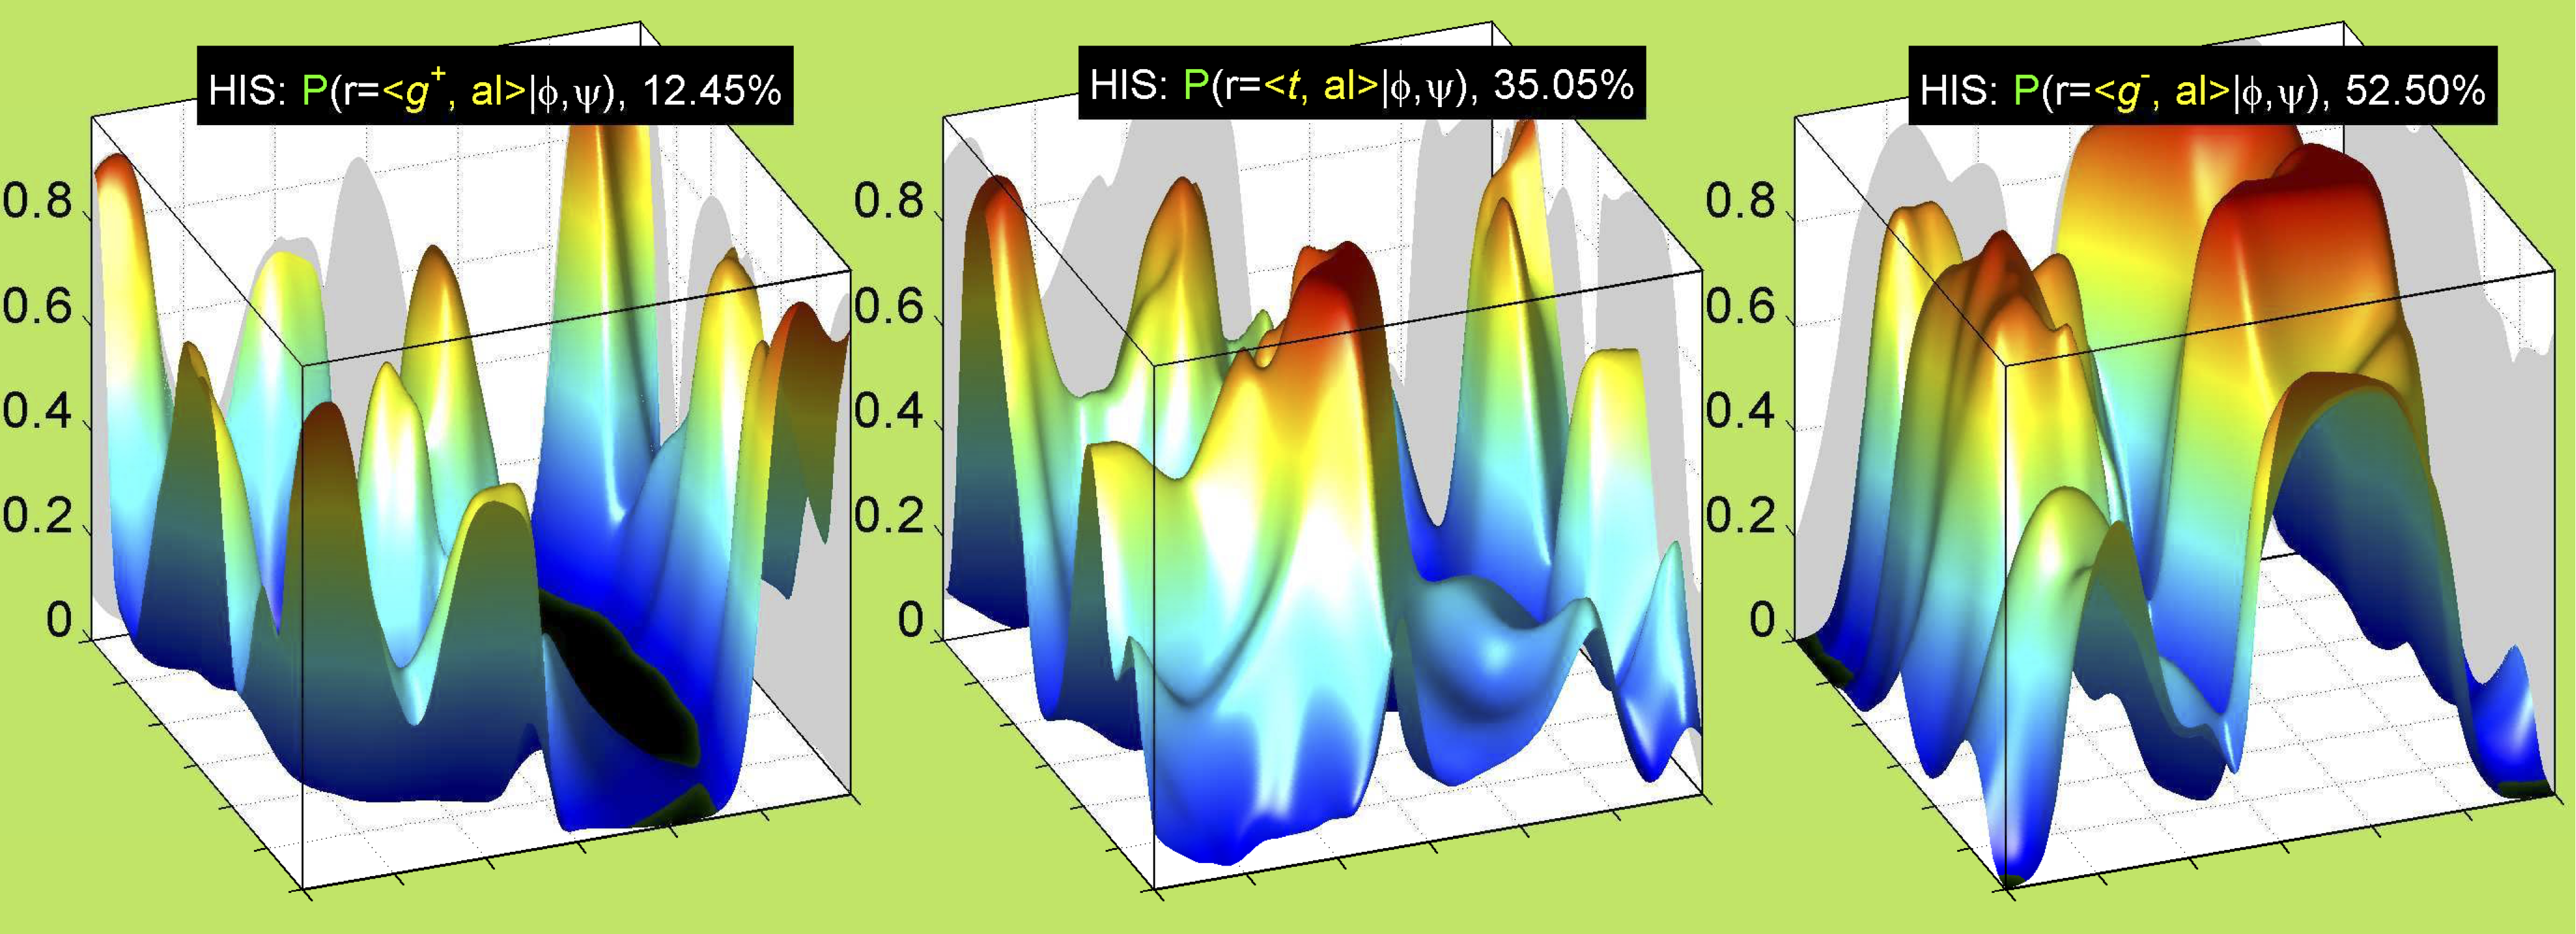

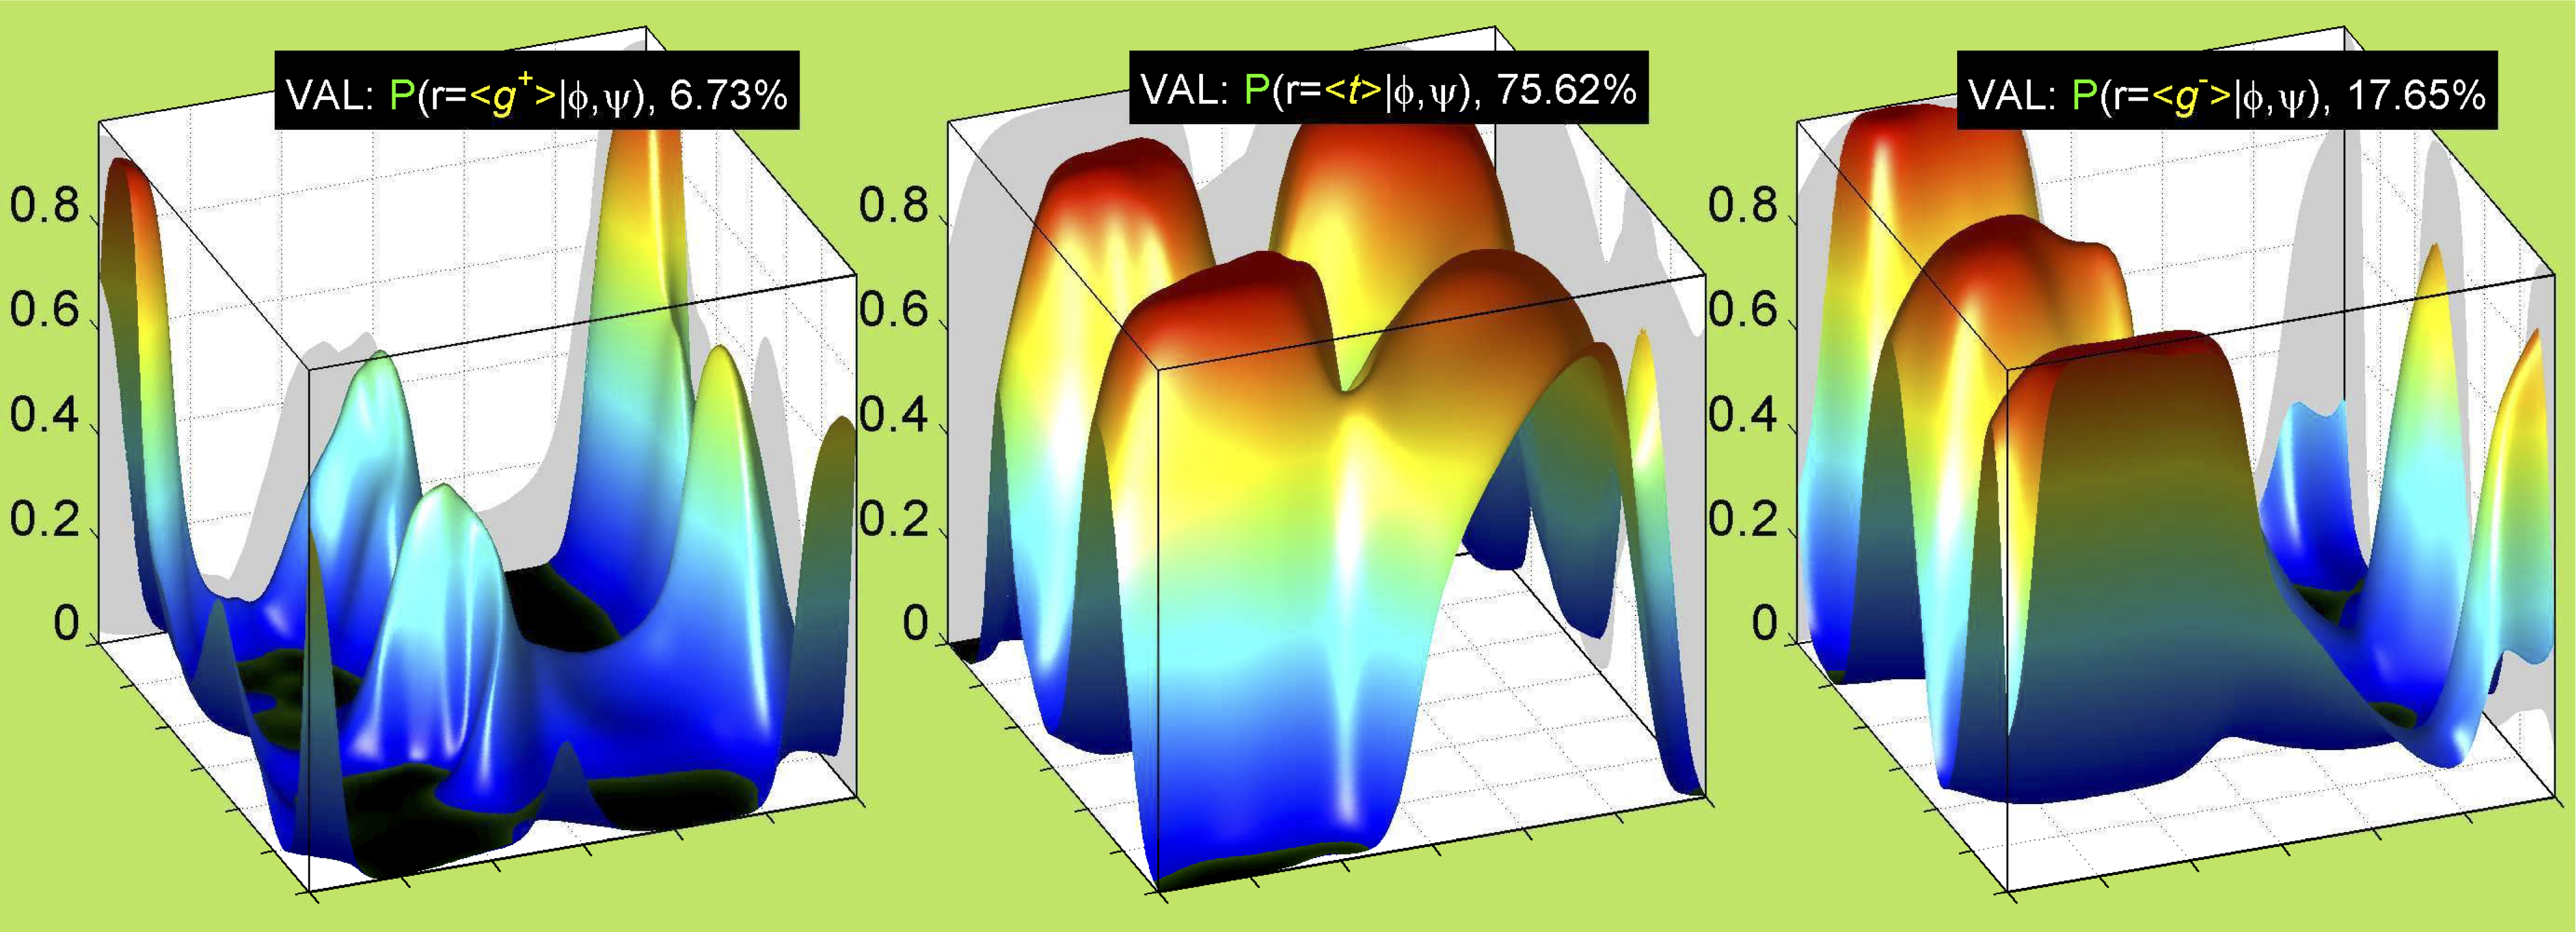
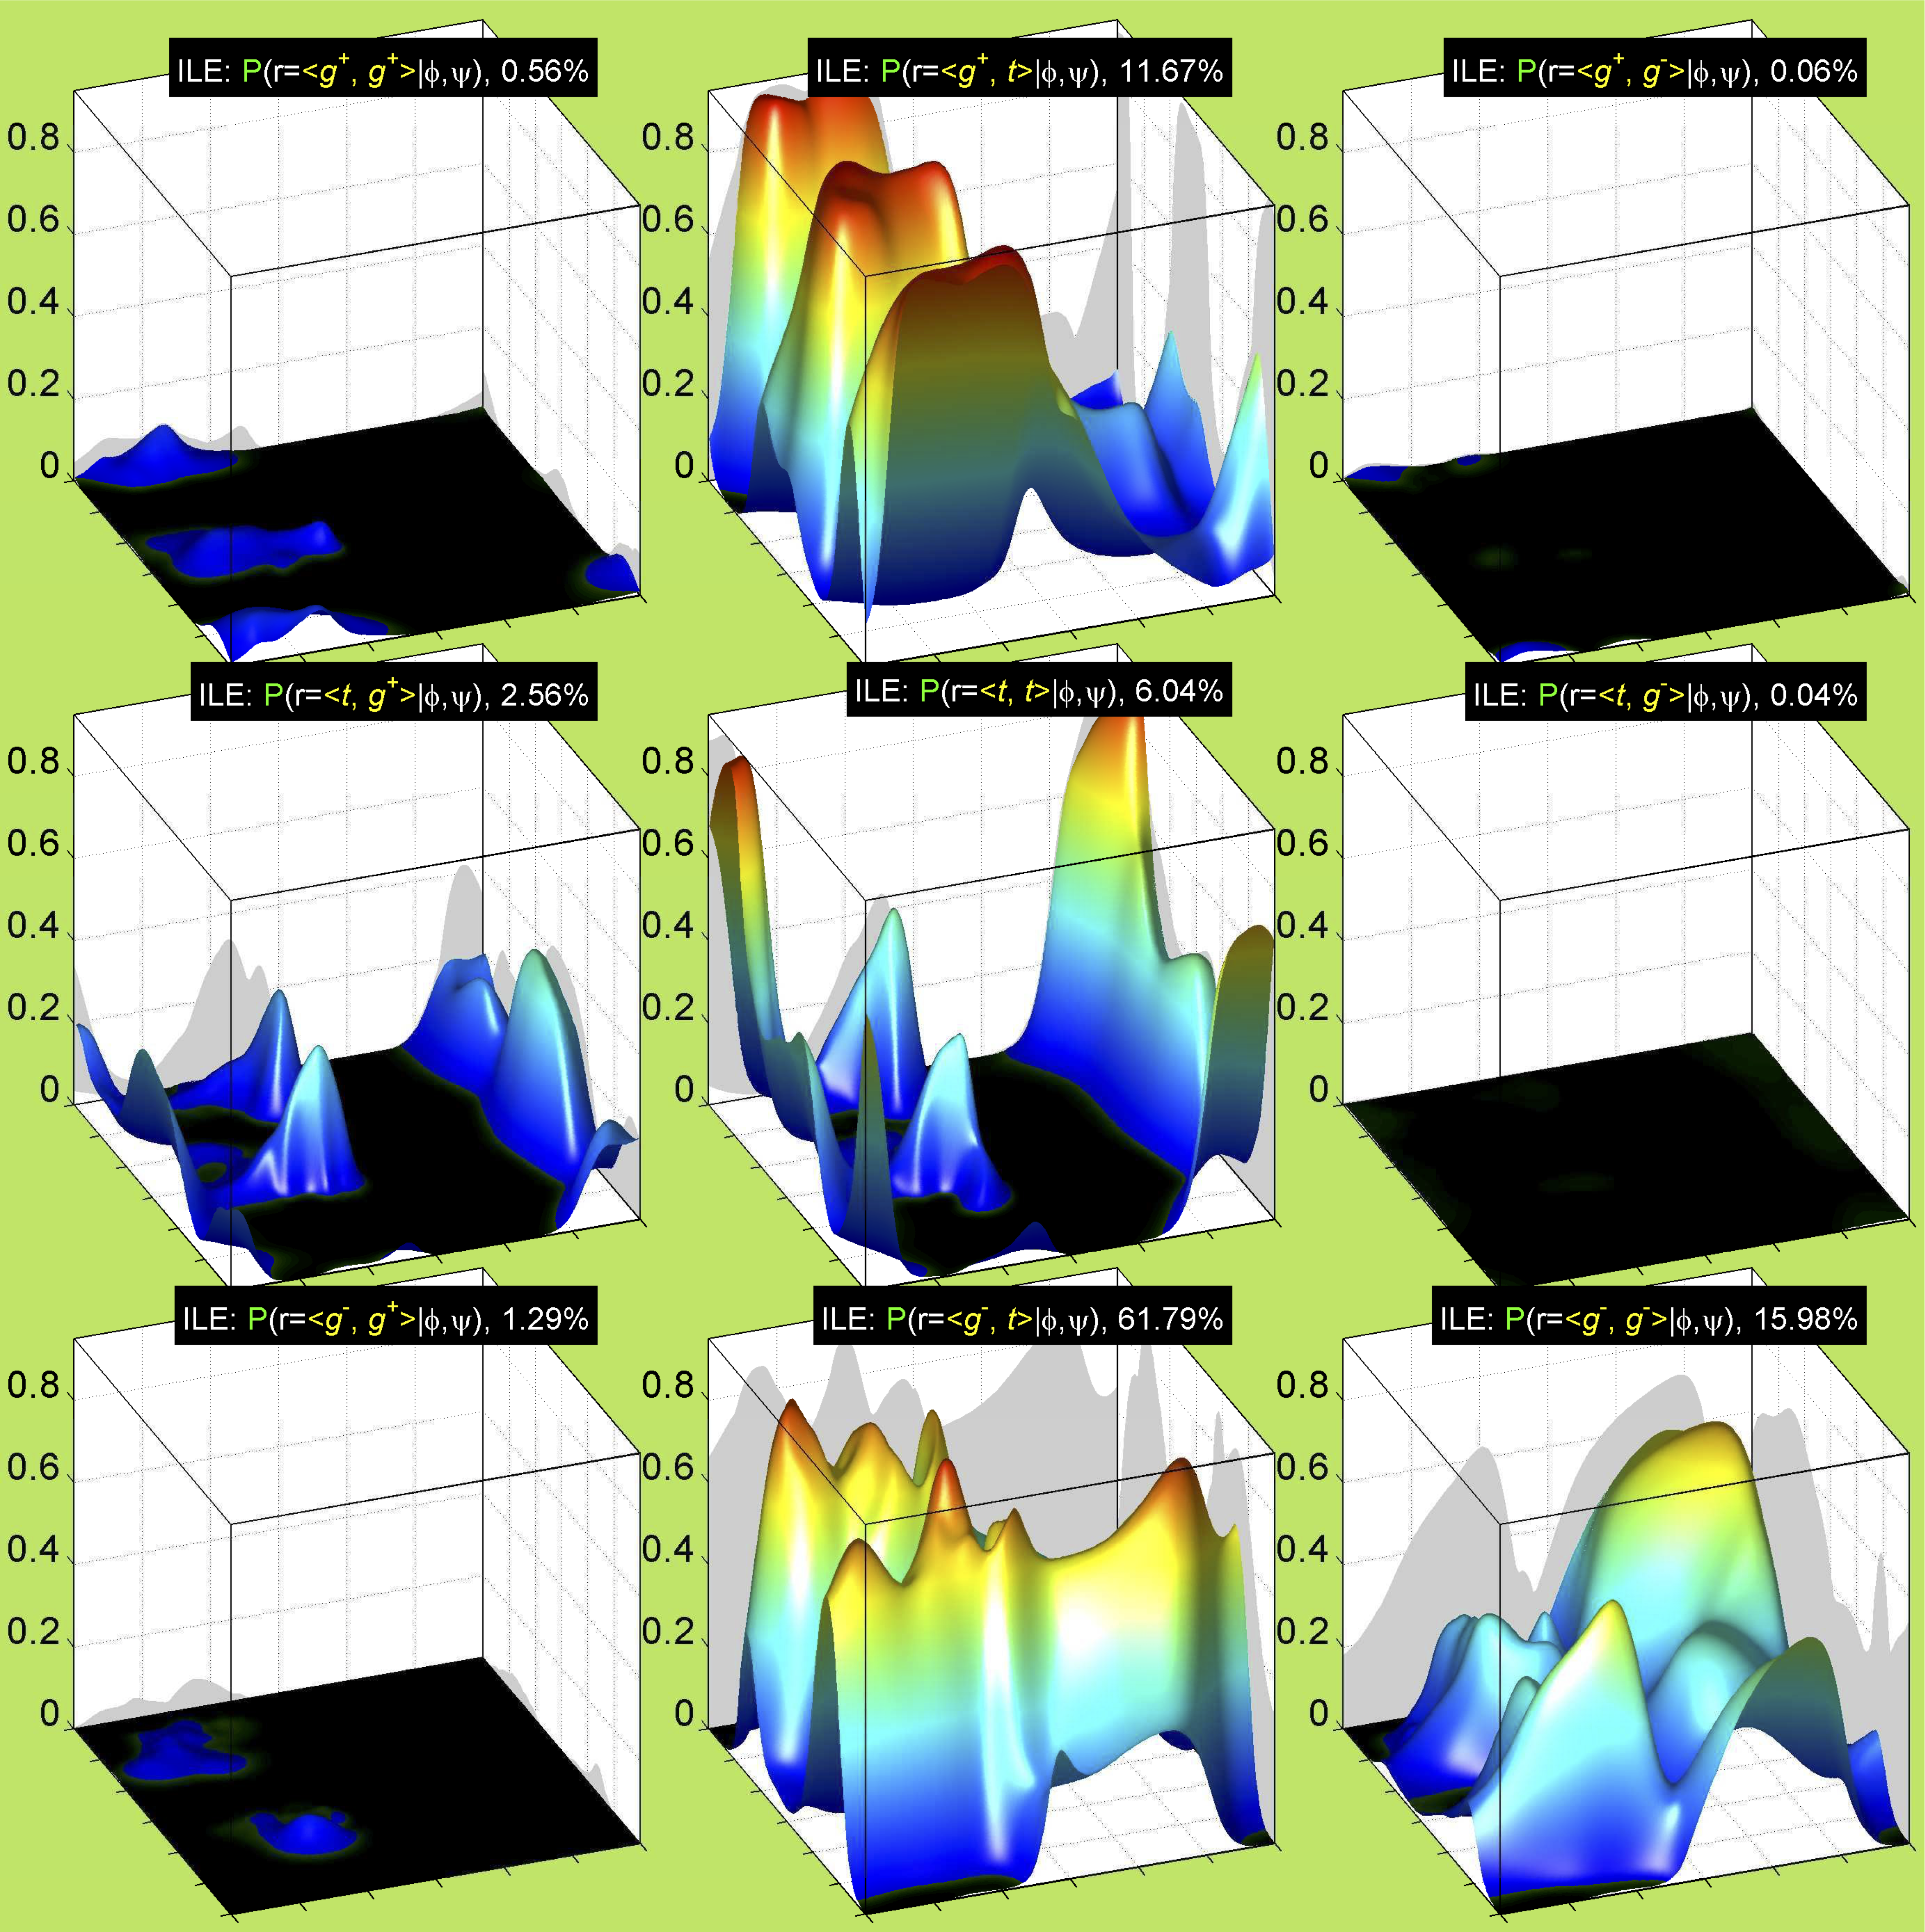
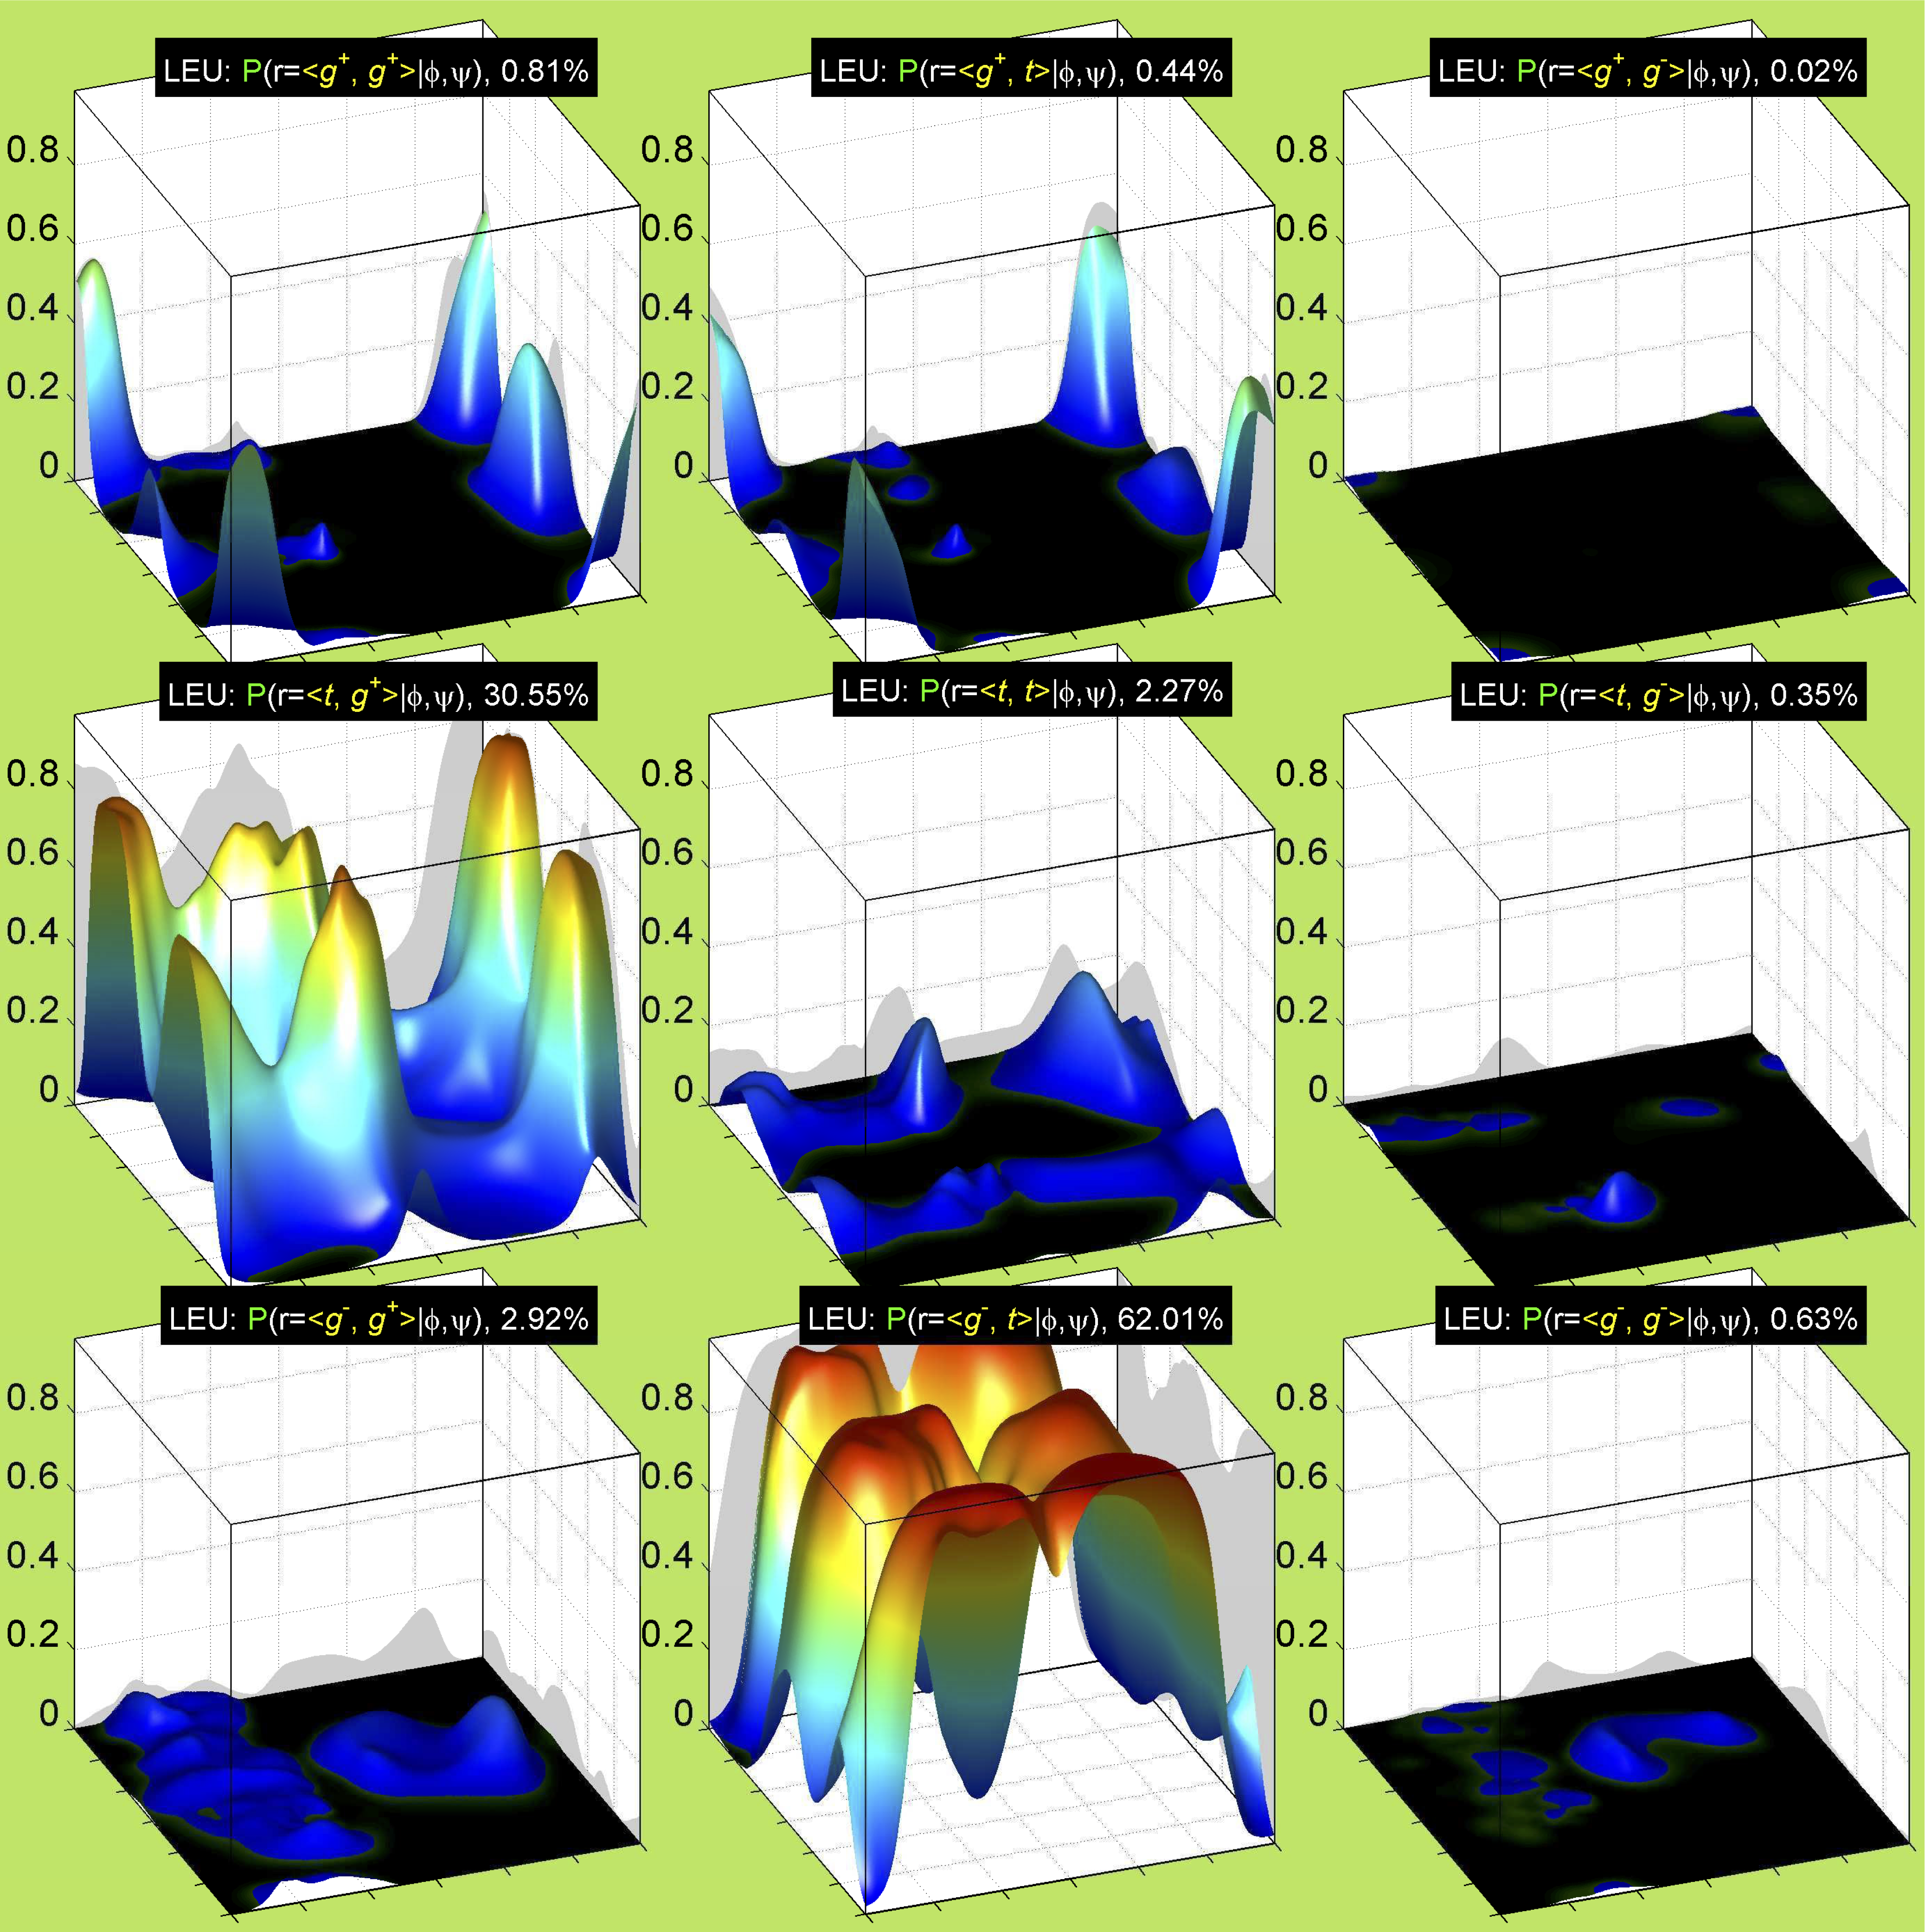
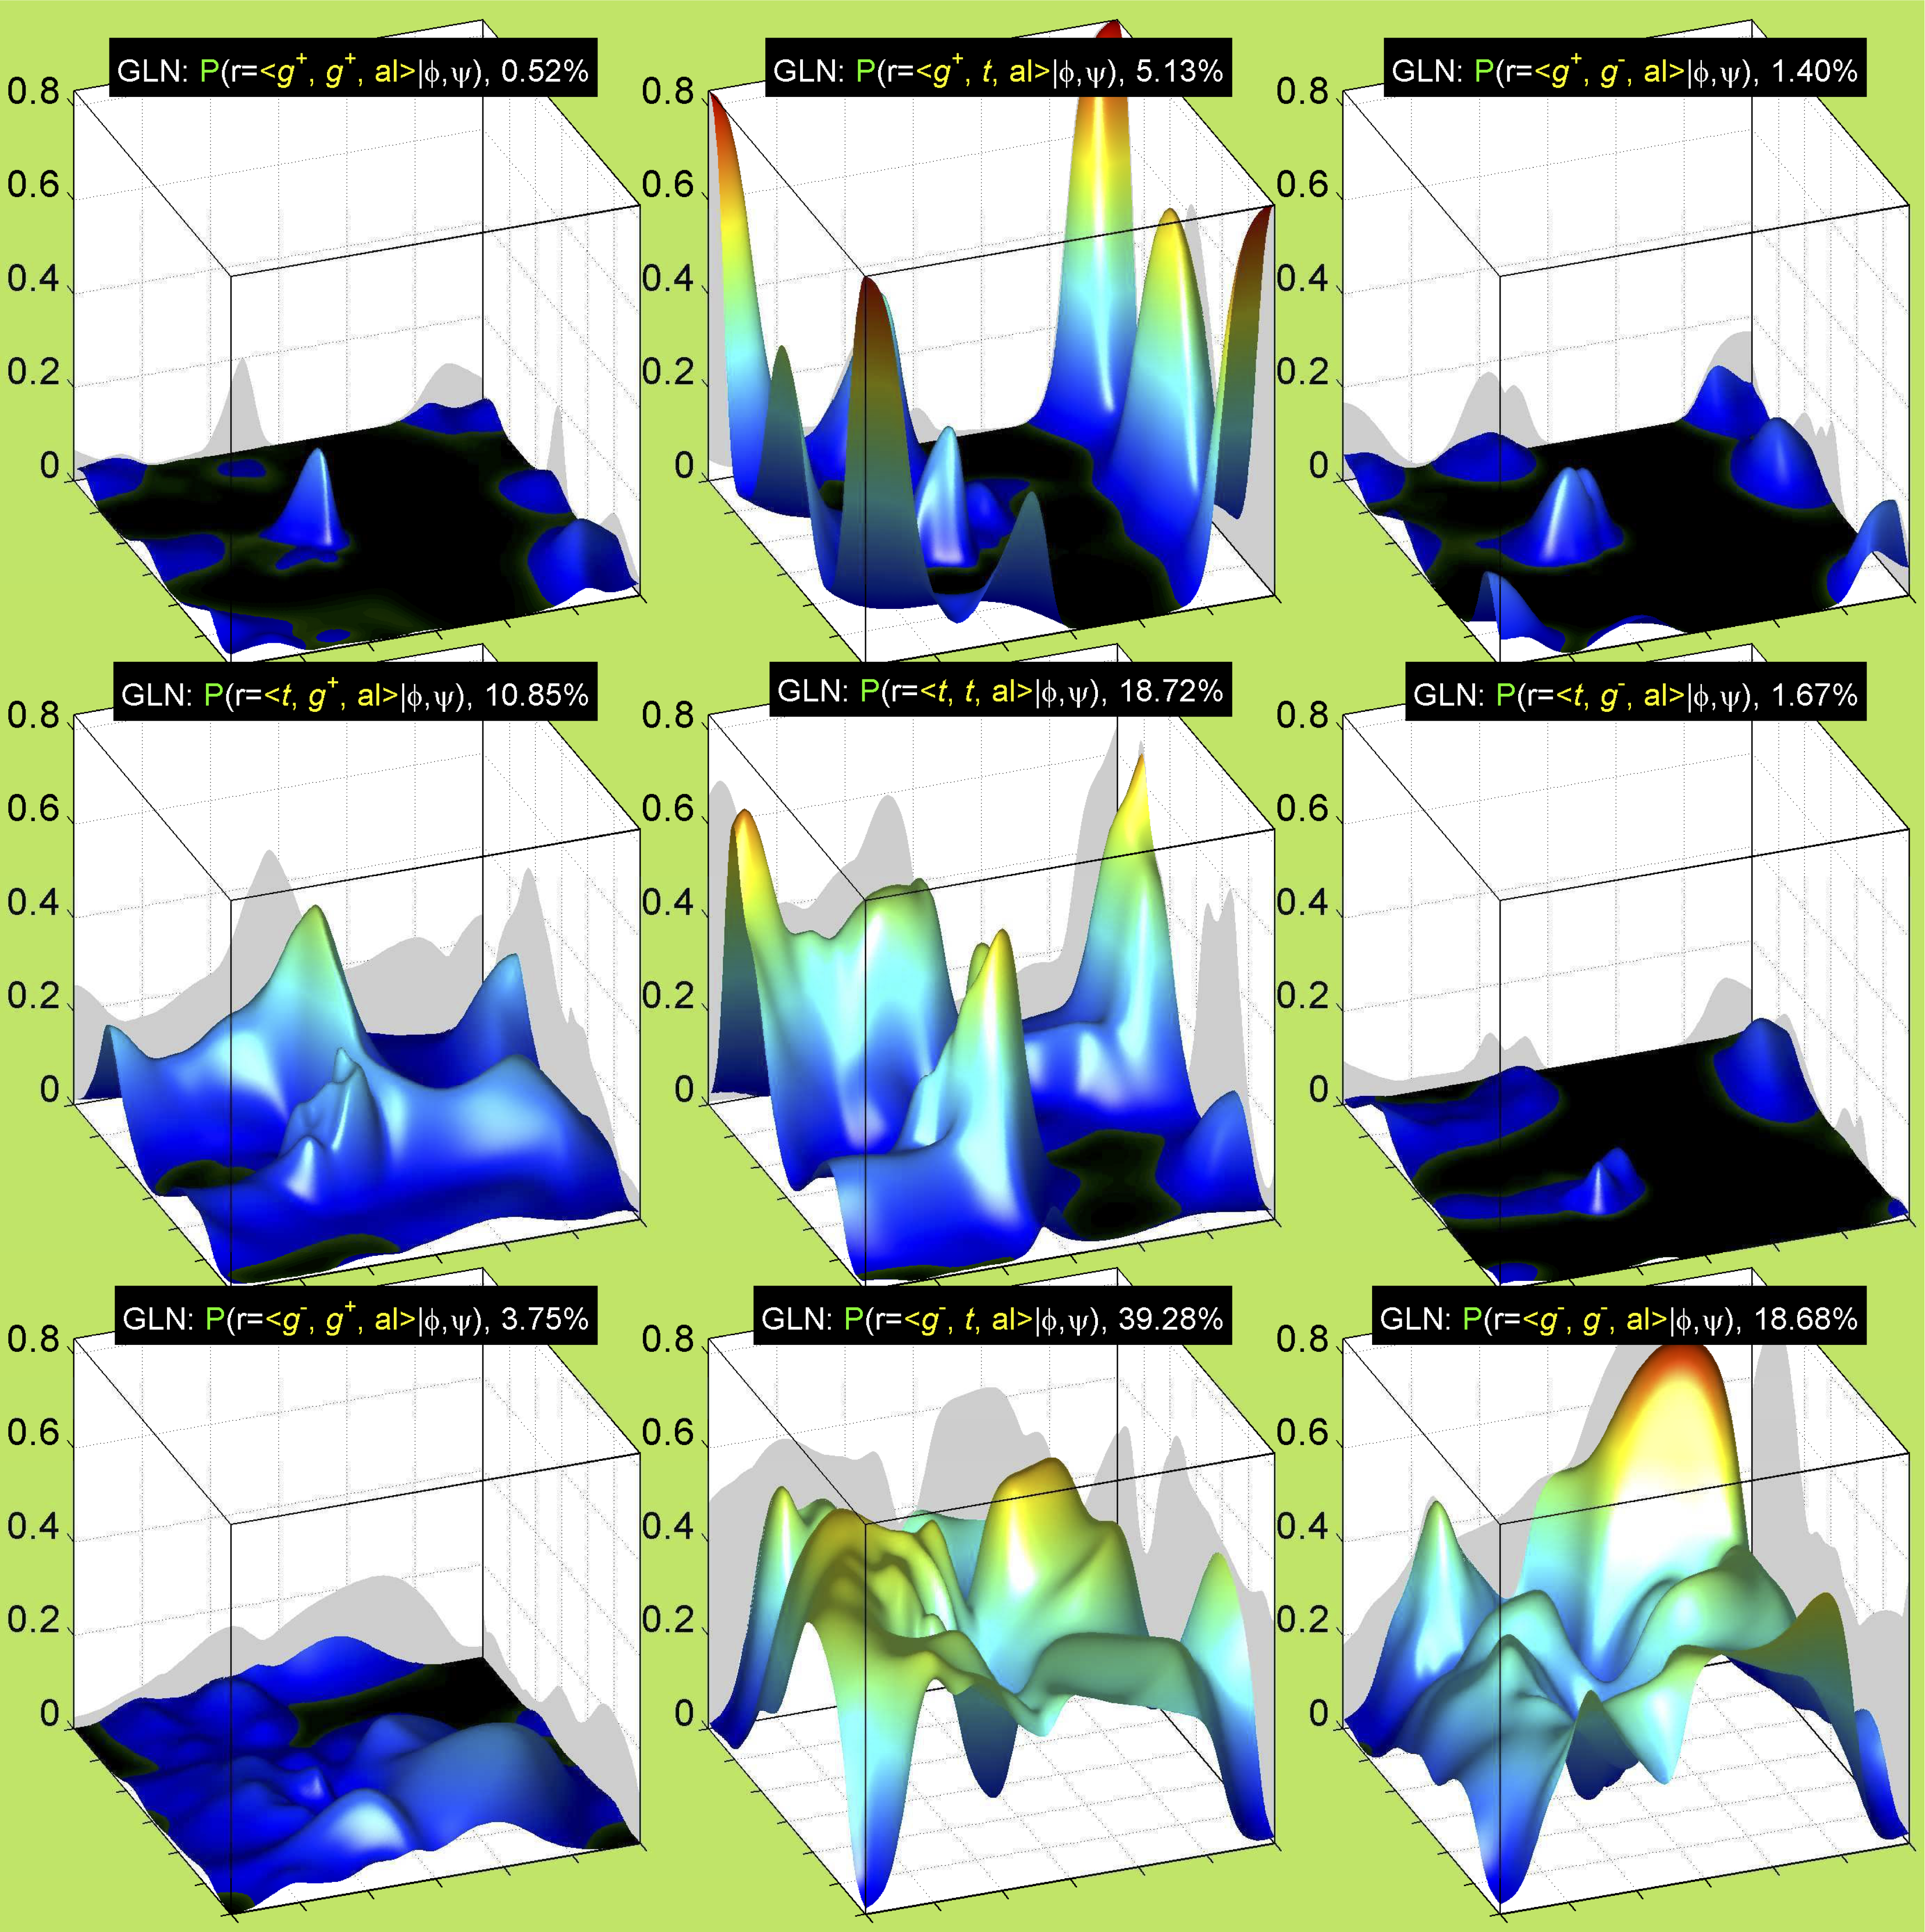
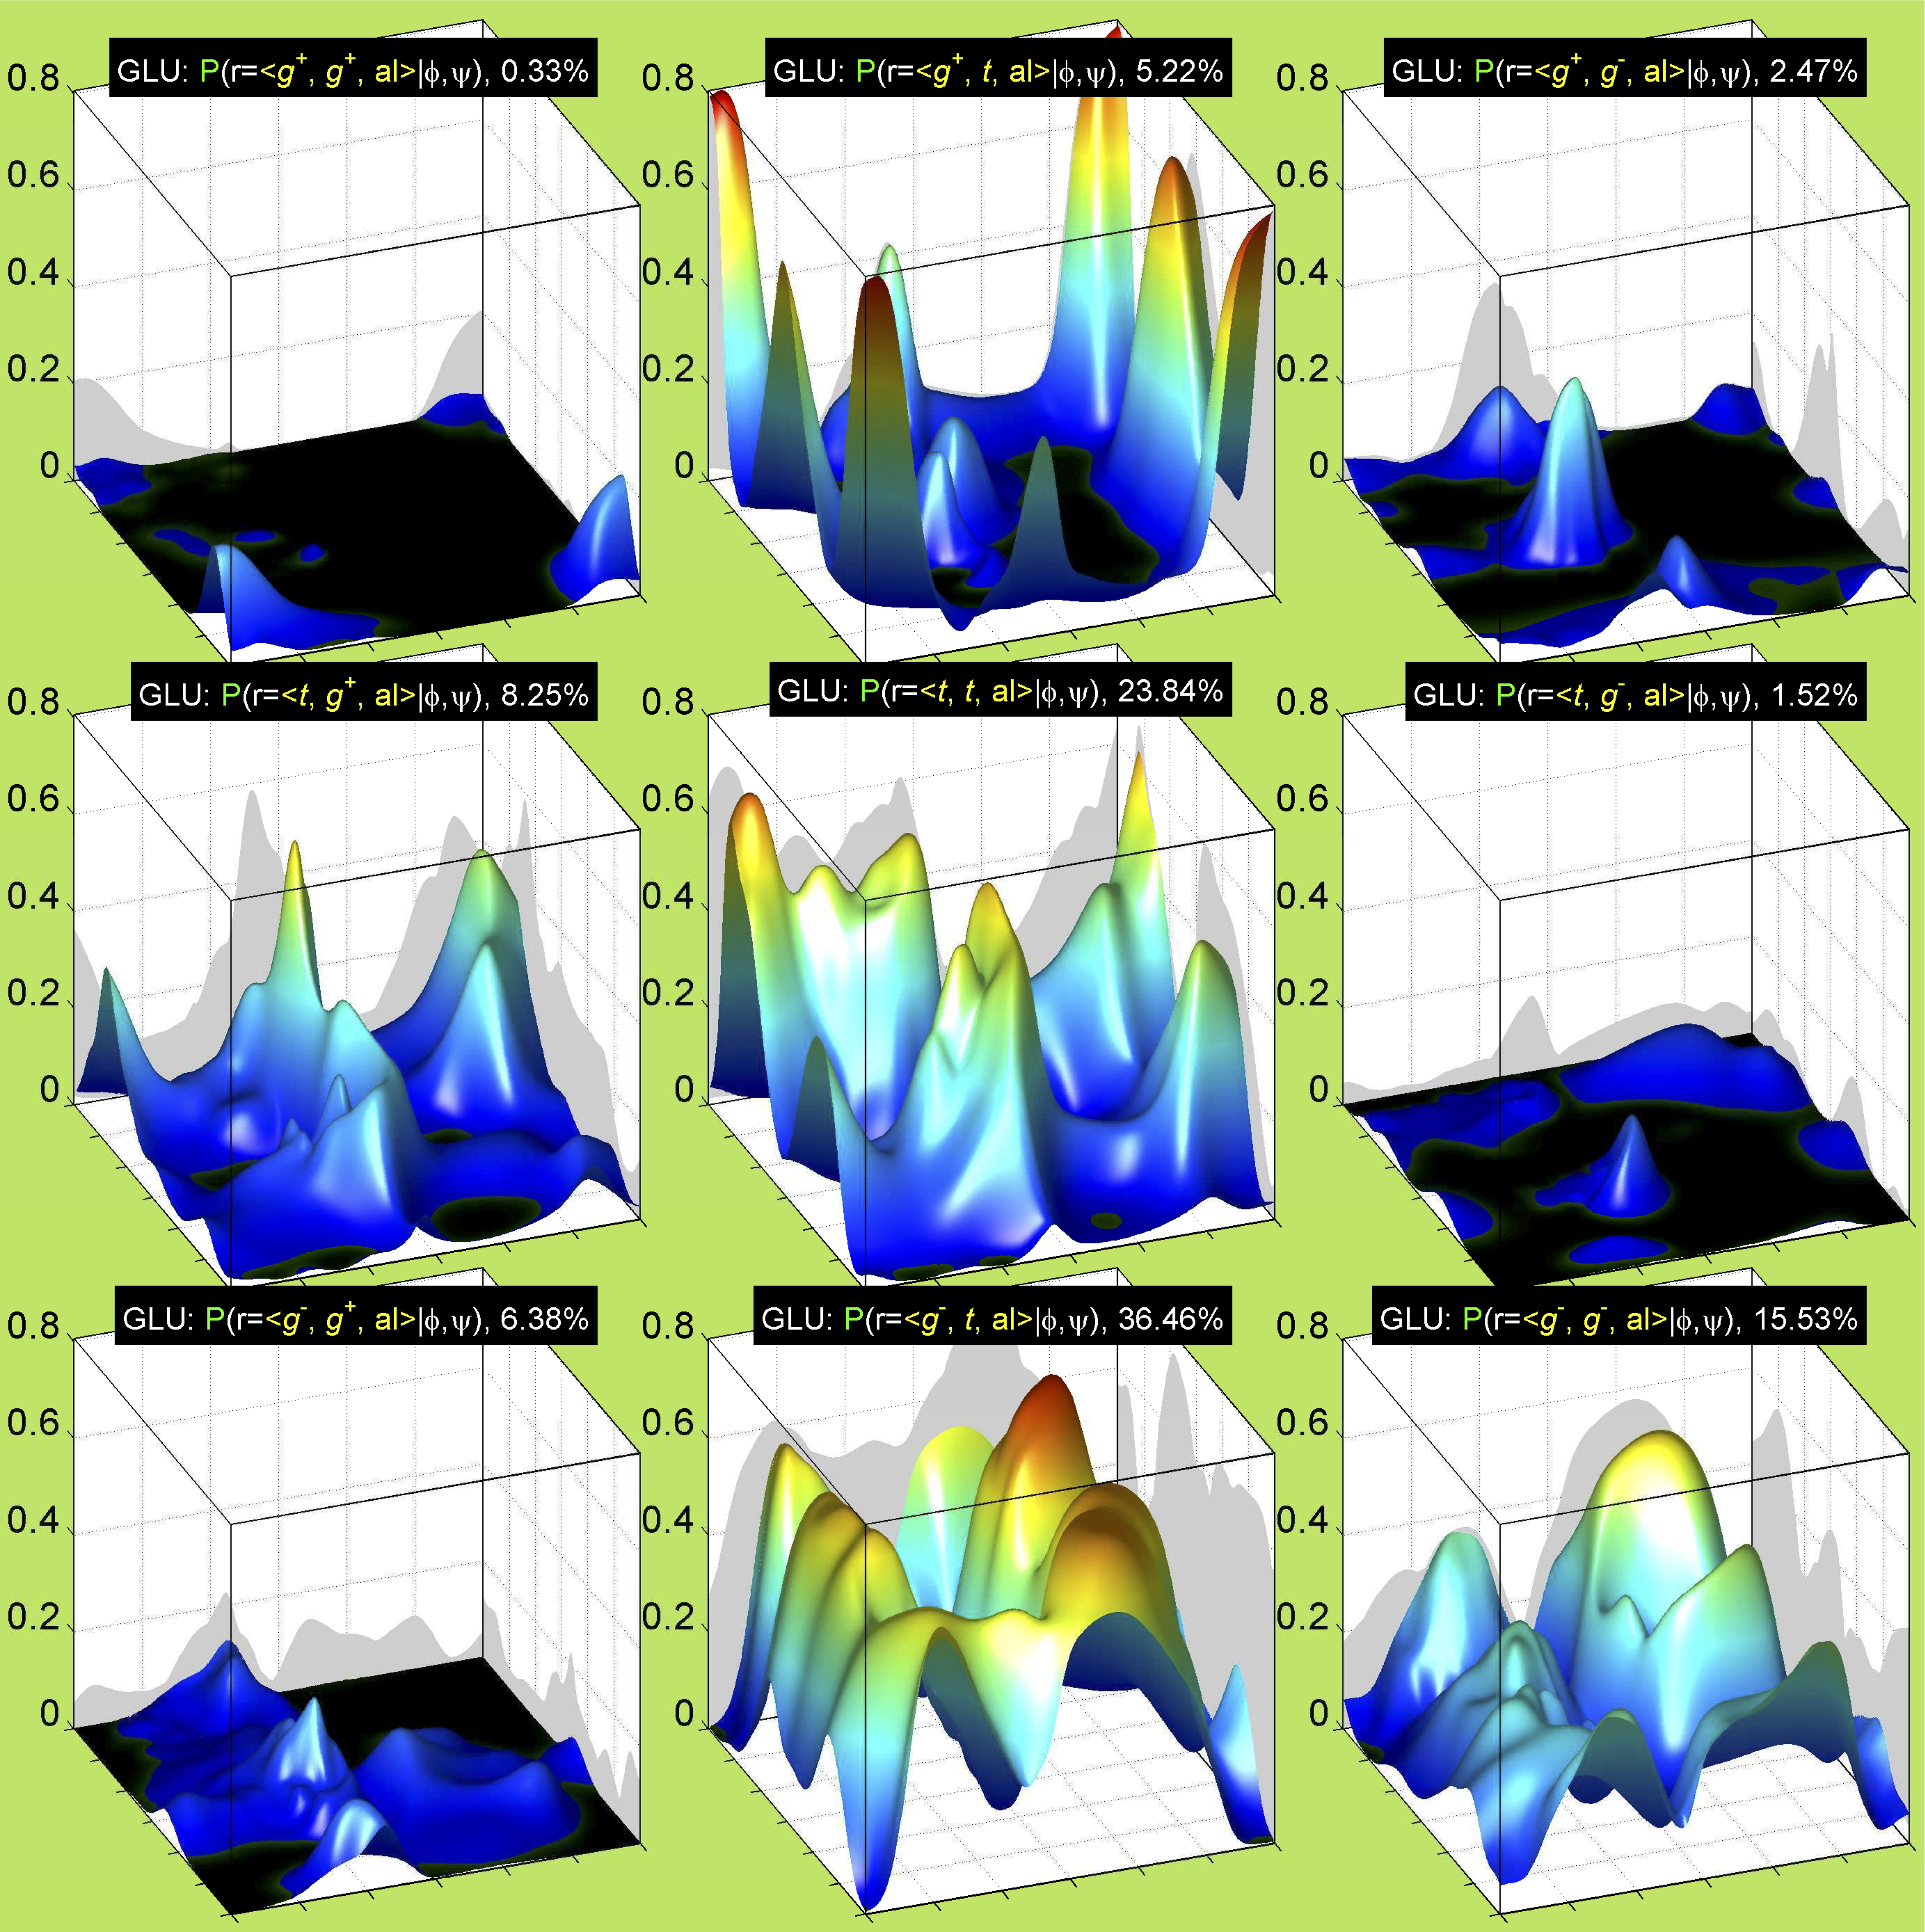
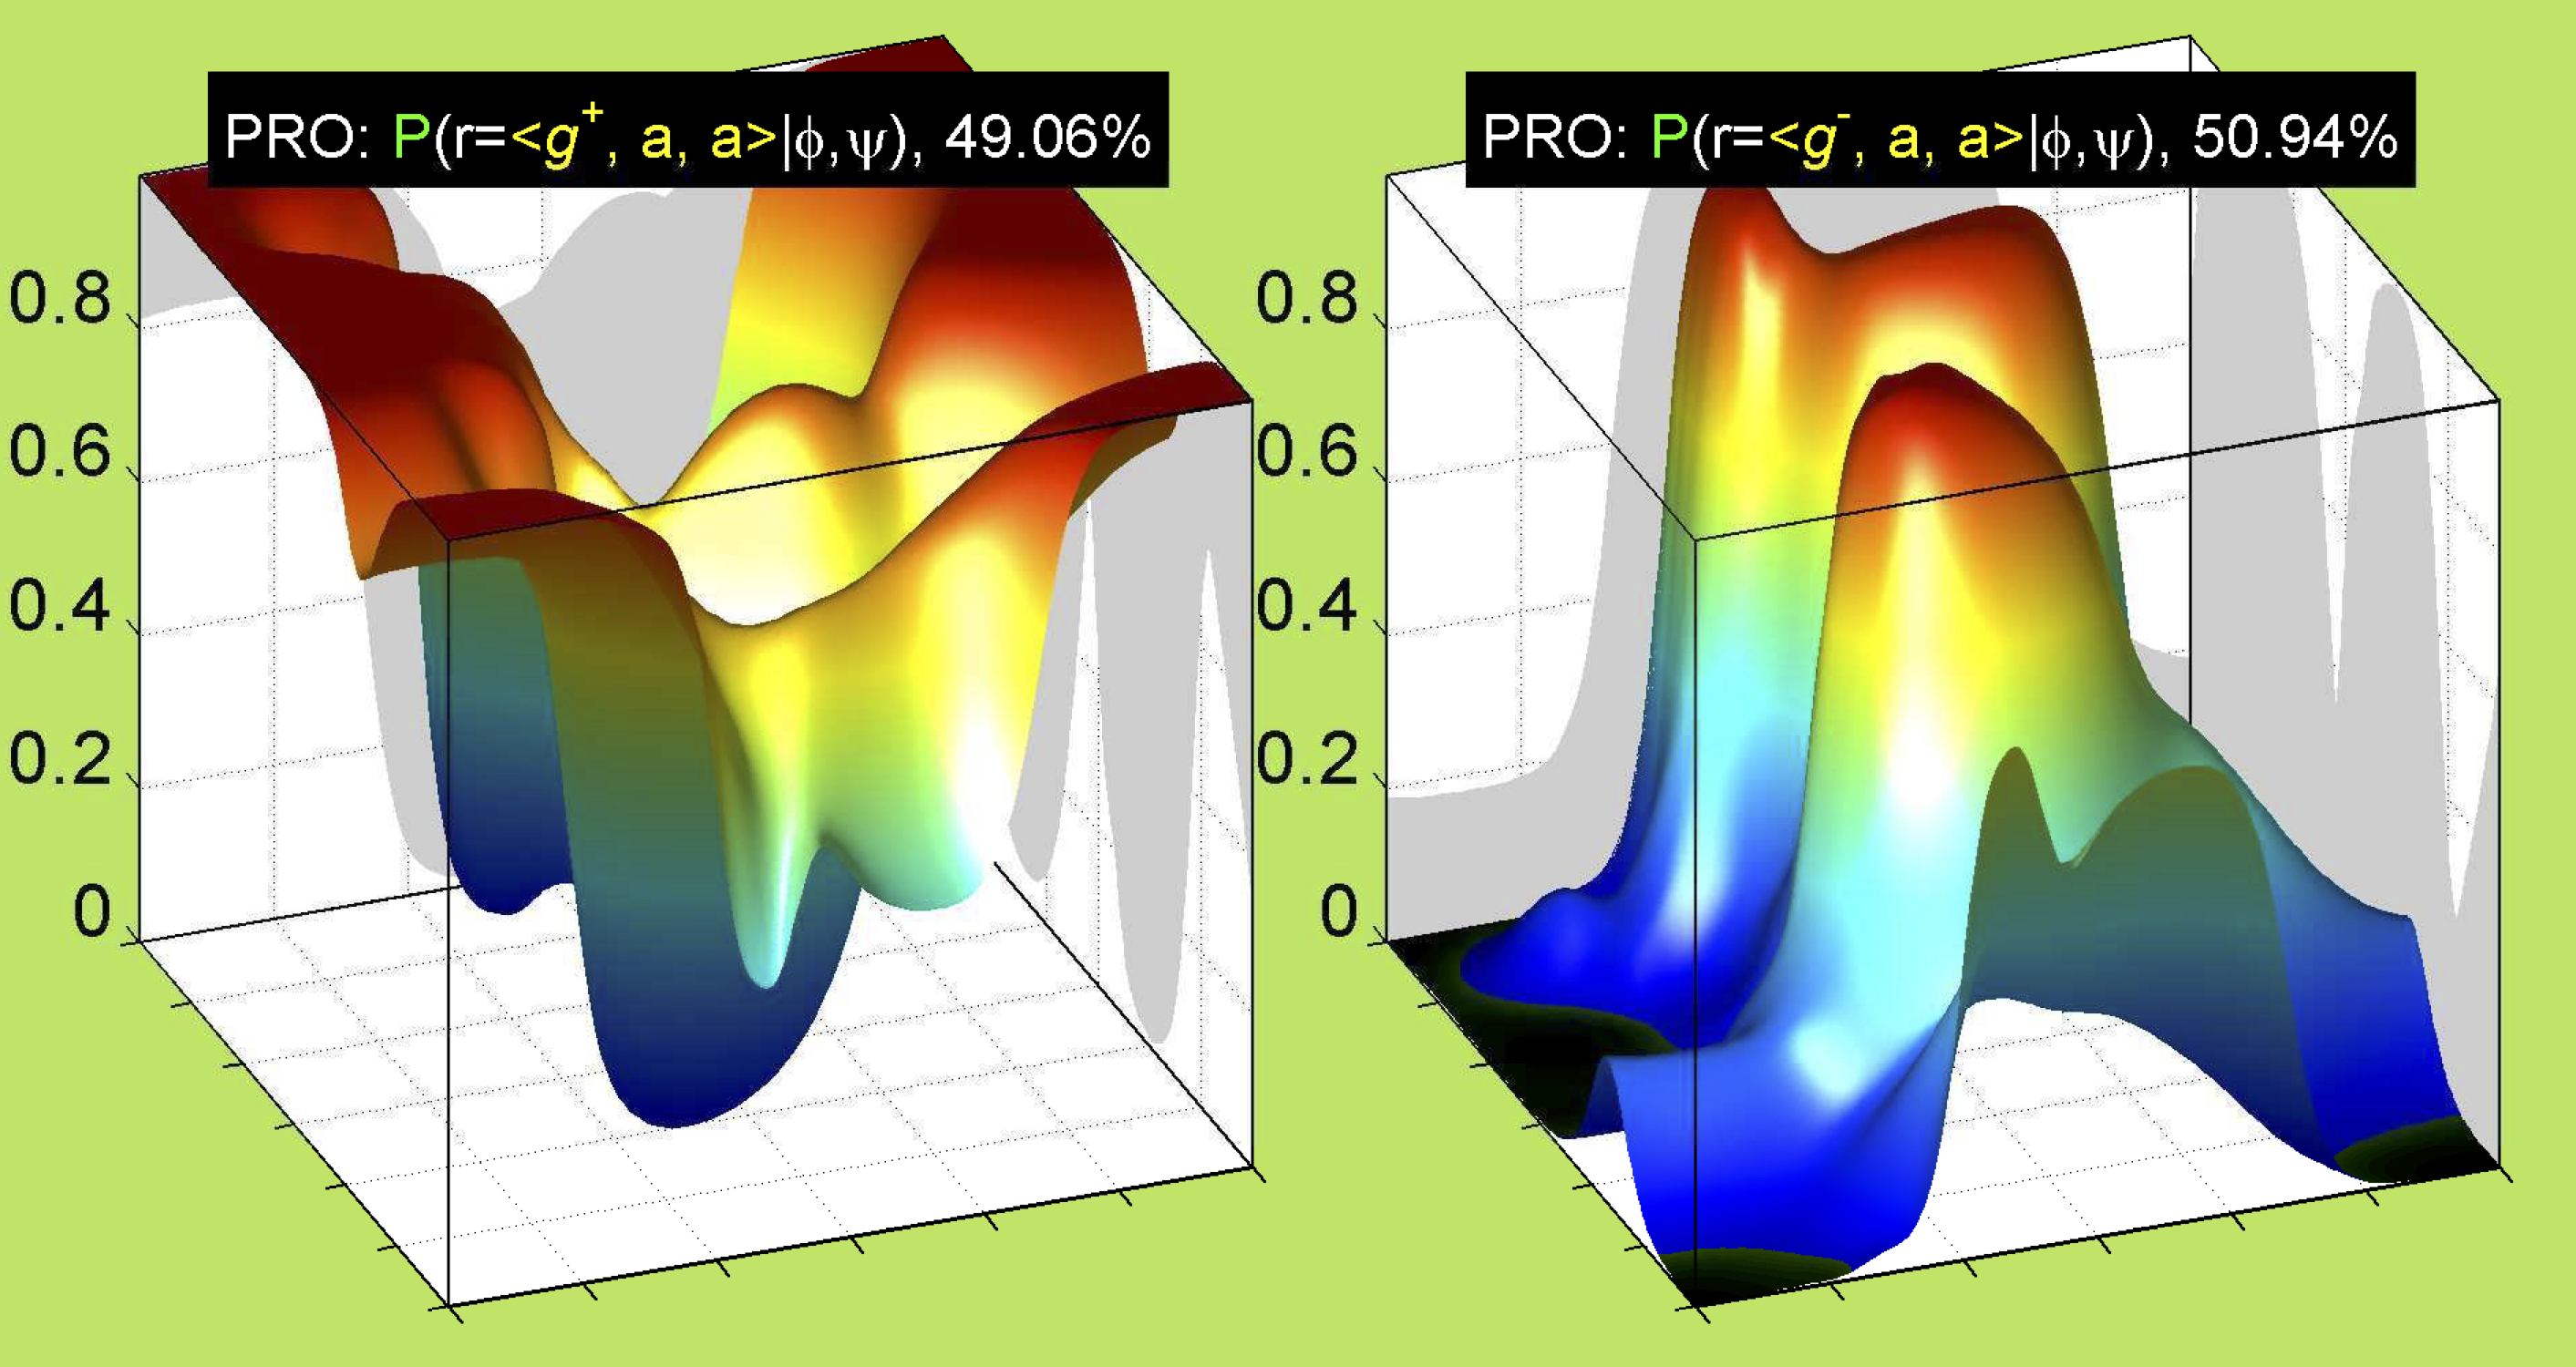
References
- R. L. Dunbrack, Jr. and M. Karplus. Backbone-dependent Rotamer Library for Proteins: Application to Side-chain prediction. J. Mol. Biol., 230, 543-574 (1993). Download PDF
- R. L. Dunbrack, Jr. Conformational analysis of protein side chains: Empirical energy parameters for proline and development of a backbone-dependent rotamer library. Ph. D. dissertation, Harvard University (1993). Download PDF
- R. L. Dunbrack, Jr. and M. Karplus. Conformational analysis of the backbone-dependent rotamer preferences of protein side chains. Nature Structural Biology, 1, 334-340 (1994). Download PDF
- R. L. Dunbrack, Jr. and F. E. Cohen. Bayesian statistical analysis of protein side-chain rotamer preferences. Protein Science, 6, 1661-1681 (1997). Download PDF
- R. L. Dunbrack, Jr. Rotamer libraries in the 21st century. Curr Opin Struct Biol 12, 431-440 (2002). Download PDF
- M. V. Shapovalov and R. L. Dunbrack, Jr. Statistical and conformational analysis of the electron density of protein side chains. Proteins 66, 279-303 (2007). Download PDF
- M. S. Shapovalov and R. L. Dunbrack, Jr. A smoothed backbone-dependent rotamer library for proteins derived from adaptive kernel density estimates and regressions. Structure, 19, 844-858 (2011). Download PDF