Research
High-resolution structural bioinformatics and structure prediction
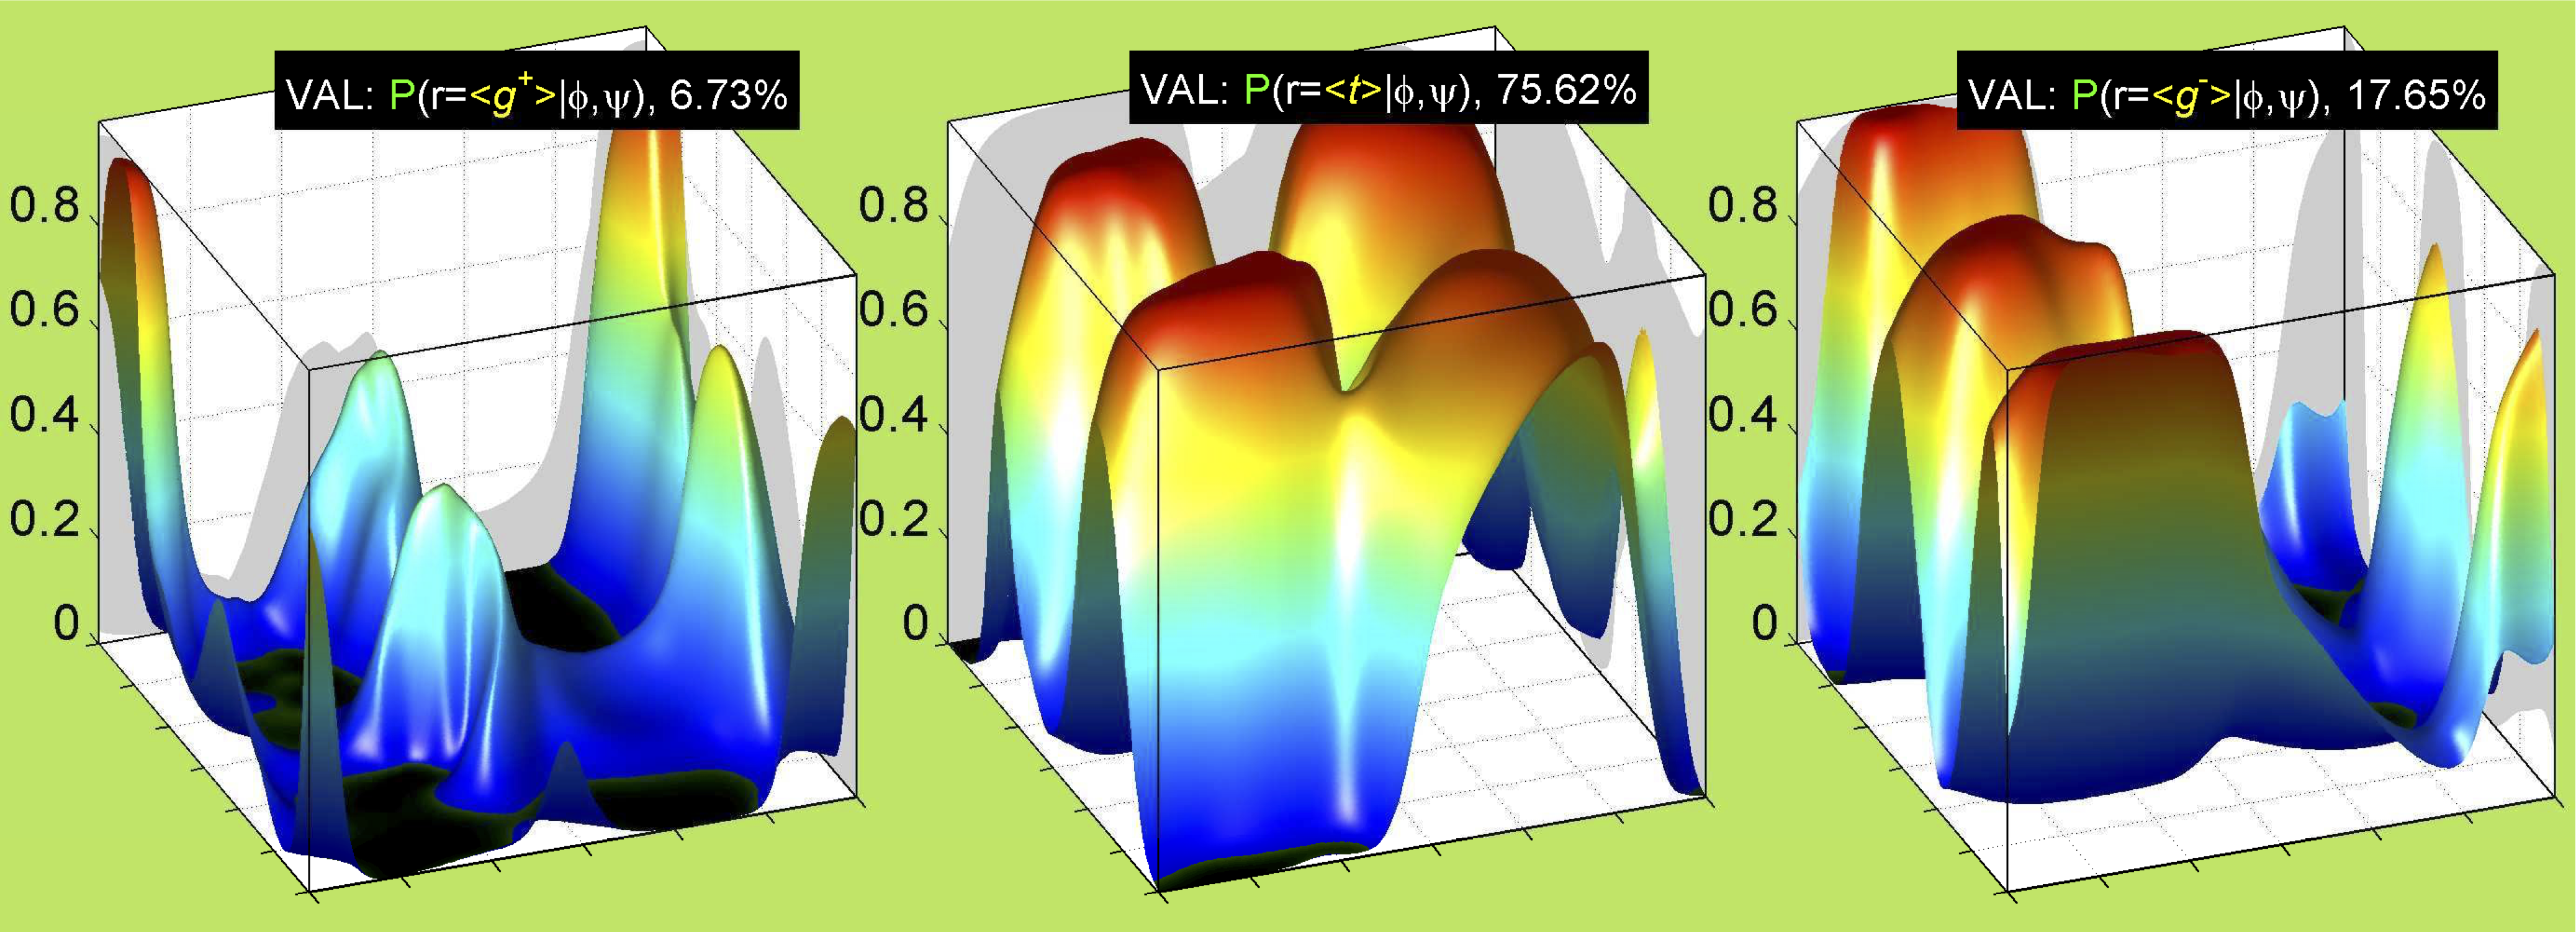
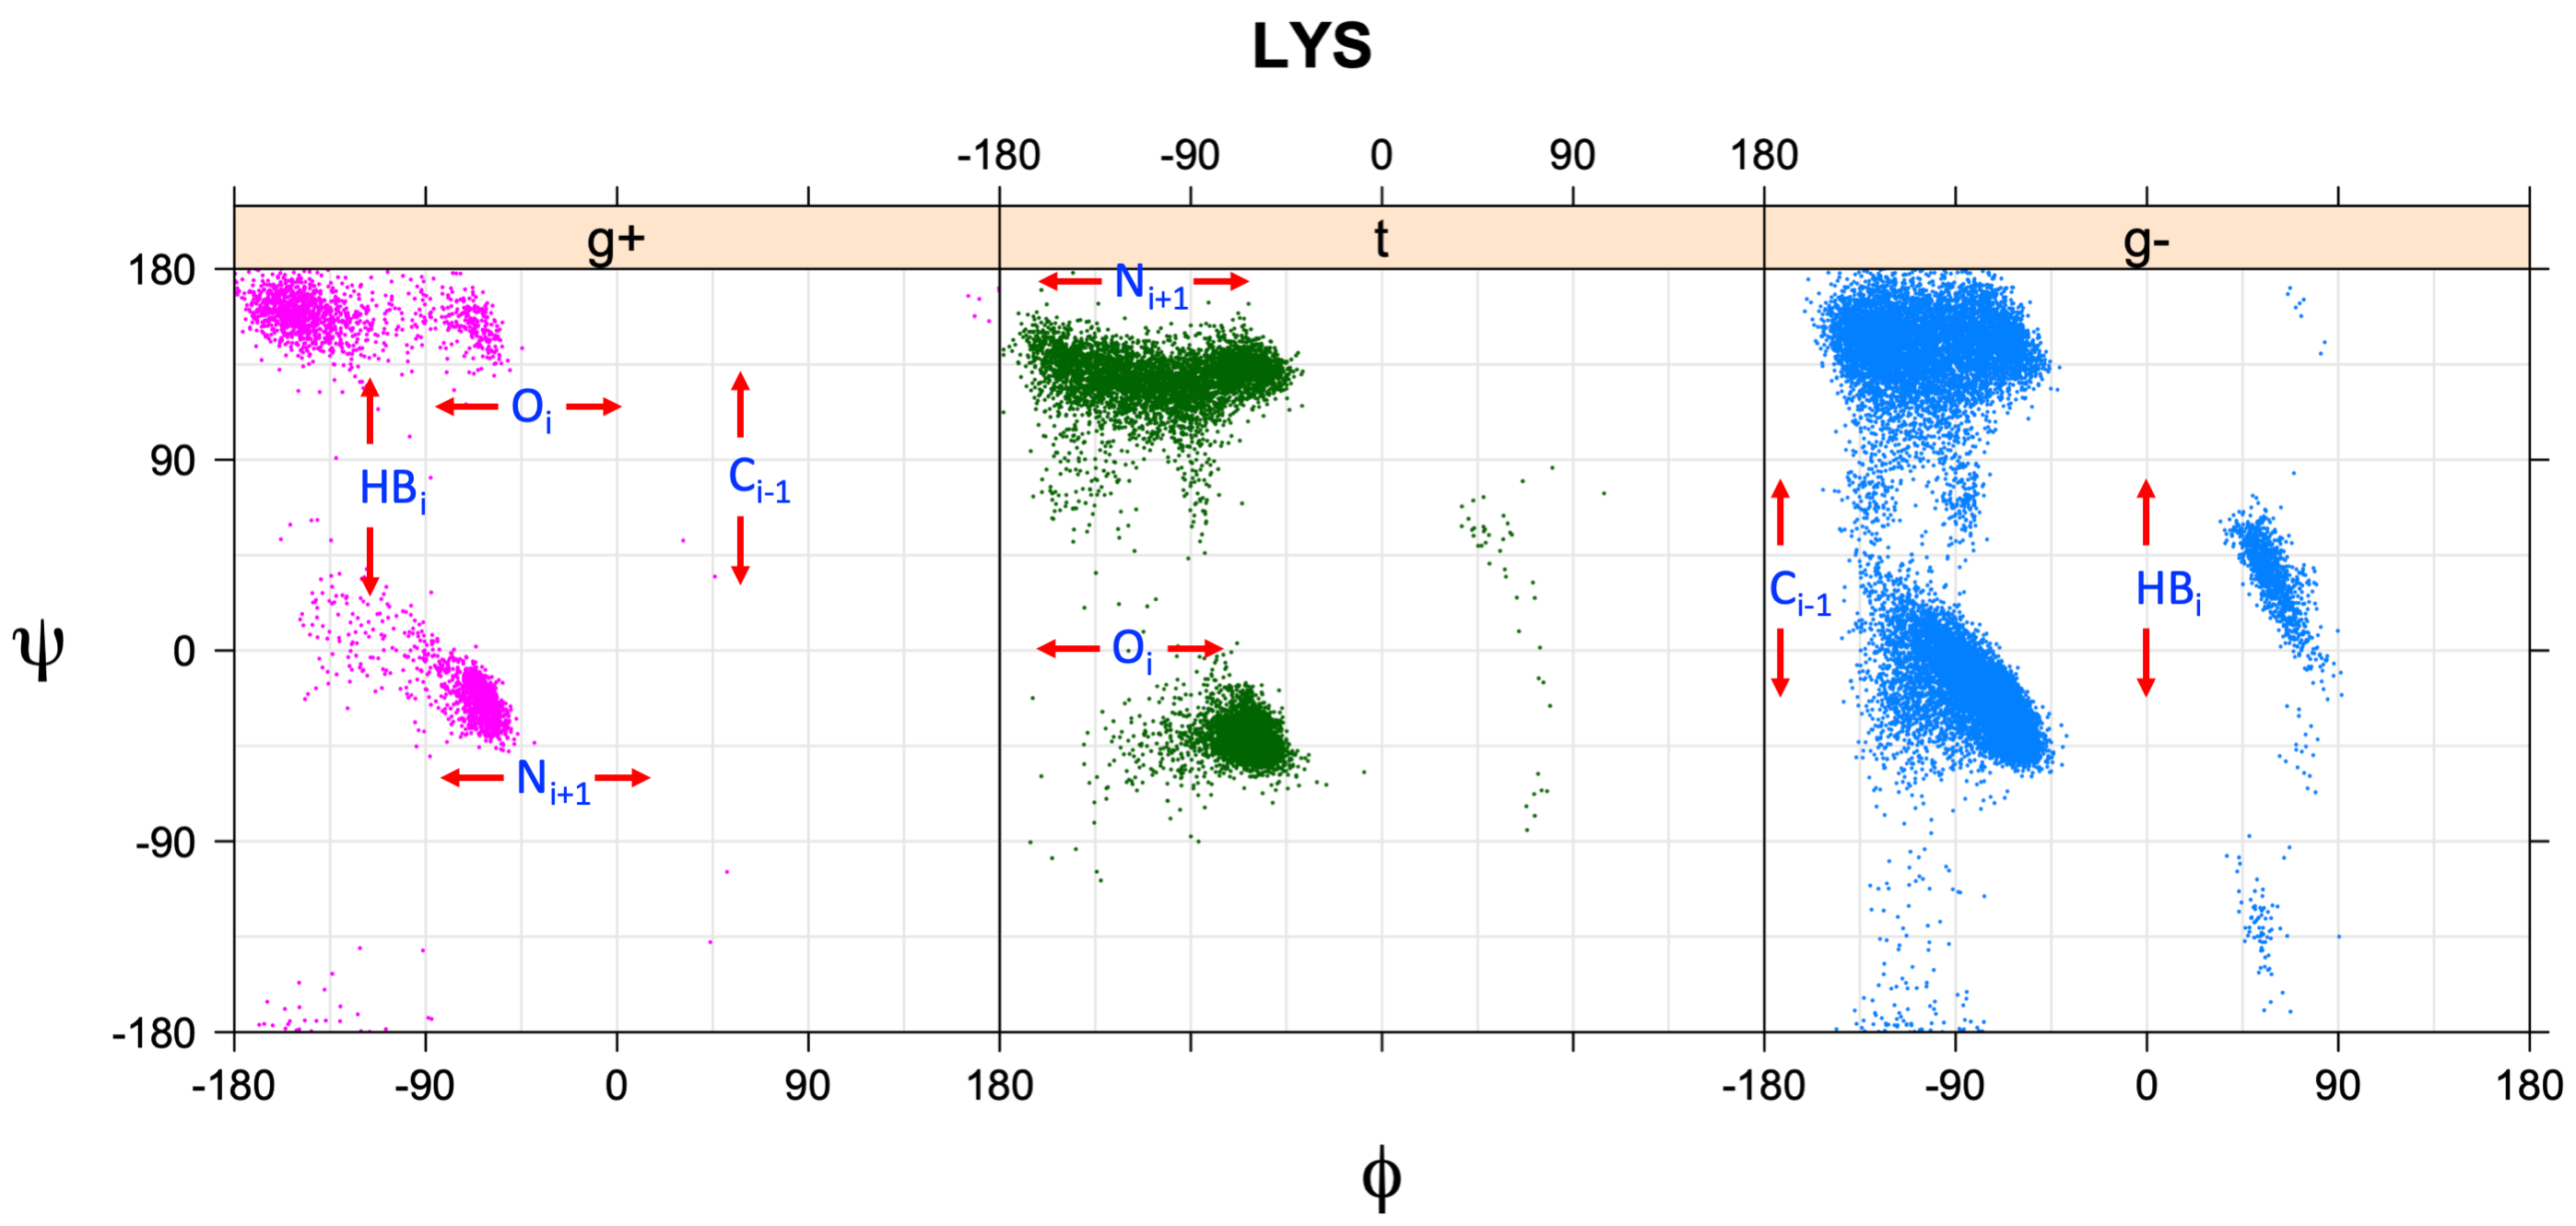
We perform statistical analysis of protein backbone and side-chain dihedral angles and other structural parameters for use in protein structure prediction, including our SCWRL4 program for predicting side-chain conformations.
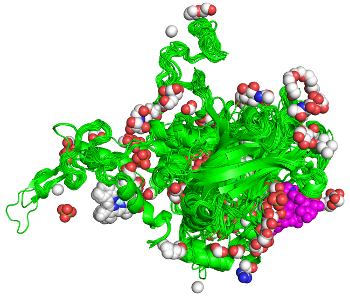
Structural bioinformatics of protein interactions and protein assemblies
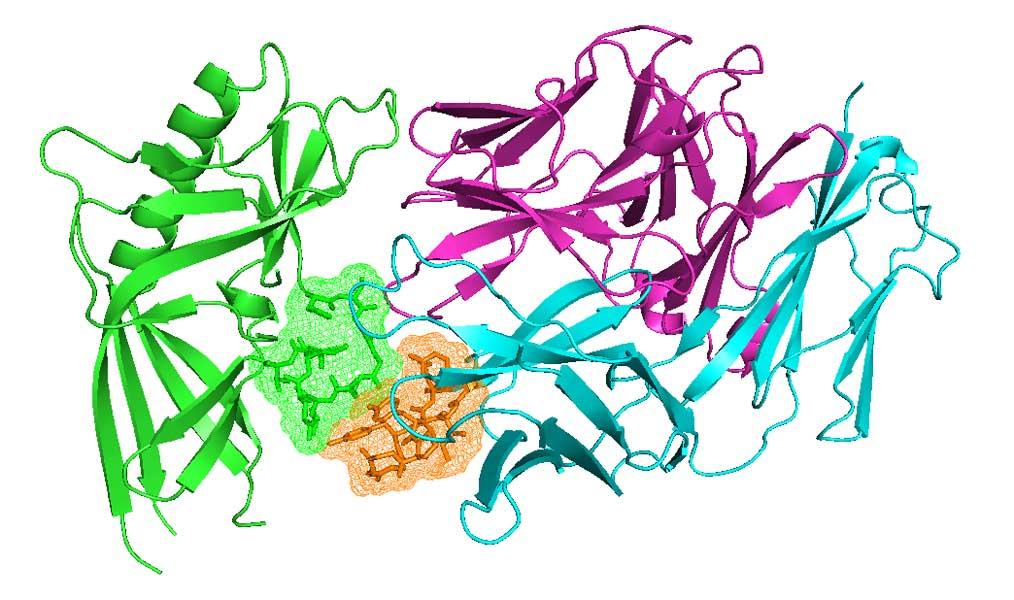
Proteins act through interactions with other molecules. For any protein family, finding all examples of any kind of interaction across the PDB is challenging. Our ProtCID server provides clustered interactions of protein domain and chain pairs, as well as domain/peptide, domain/ligand, and domain/nucleic-acid interactions.
Antibodies and T-cell receptors
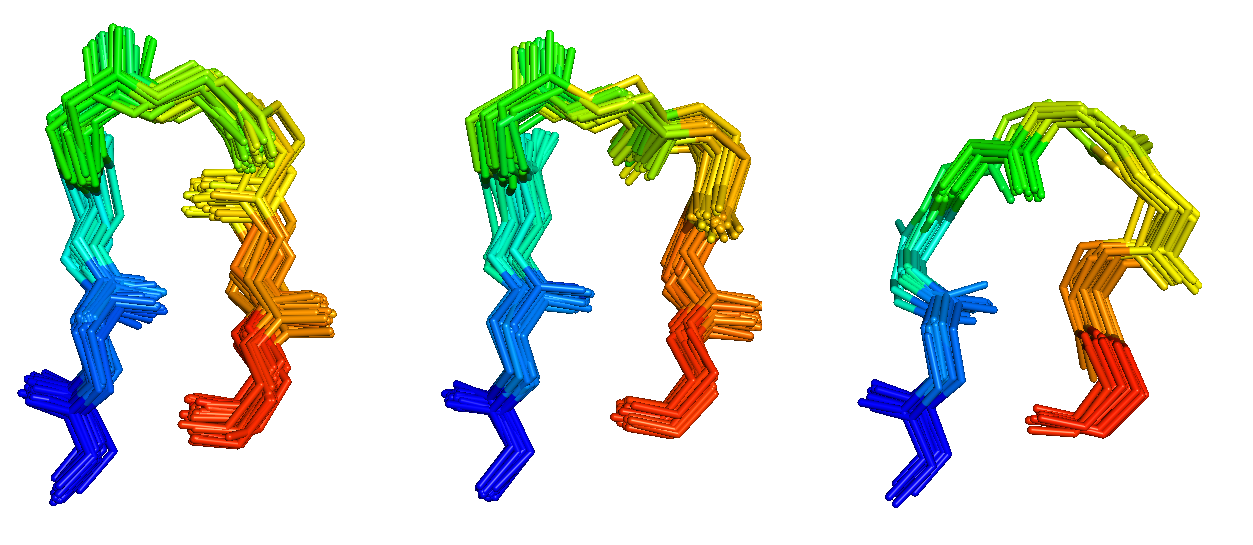
Antibodies and T-cell receptors bind their antigens through loops on their surface called complementarity determining regions (CDRs). We have clustered the conformations of antibody CDRs and we provide the PyIgClassify server for structures currently in the PDB. Our program RosettaAntibodyDesign uses these clusters for computationally designing antibodies with higher affinity and stability.
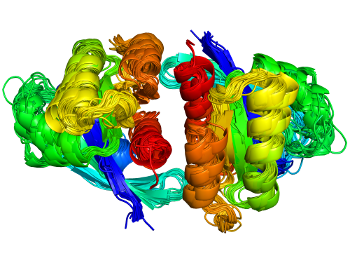
Kinases and RAS
Many proteins switch between active and inactive states through changes in the conformations of protein loops. We analyze the structures of protein loops in different protein families by clustering the conformations of active or binding site protein loops, including kinases and RAS. Our Kincore webserver and database presents extensive structural analysis of kinases and their bound ligands.